Among the various arguments advanced for why we should expect that large-scale government-led non-citizen immigration will prove economically beneficial to New Zealanders are claims about the labour market.
There are, for example, suggestions that the unemployment rate will tend to be (a bit) lower than otherwise, because ready access to offshore labour facilitates better skill-matching. Larger labour markets might work in the same direction – easier for people displaced, or new entrants, to find jobs in a deeper more diverse market.
And there is the suggestion that average GDP per capita is likely to be raised just because the average immigrant is more likely to be of working age (few countries let in many 75 year olds). On this telling, even if there were no productivity gains (ie lifts in, say, GDP per hour worked) from large scale immigration, average incomes would be raised simply because of the implied higher rates of labour force participation. In fact, this argument was run only a matter of weeks ago in an official Australian government document, a defence of Australia’s large-scale immigration programme published by the Federal Treasury and the Department of Home Affairs (the department directly responsible for immigration matters). From page 27
After trending upward for almost three decades, Australia’s labour force participation rate declined from the early 2010s through to 2016 (Figure 22). This decline coincided with a large cohort of baby boomers reaching retirement, which weighed on Australia’s participation rate. Yet evidence shows that migrants, particularly skilled migrants, have helped curb the ageing of the population by boosting the labour force. Without the contribution from migrants, all else being equal, Australia’s participation rate would be lower than at present.
Many of these claims had initially seemed plausible enough to me. In fact, in a major modelling exercise done for one of MBIE’s predecessor departments a decade ago – and widely touted at the time – the only overall economic gains from immigration resulted from this assumed higher participation rate.
But a while ago I noticed that the unemployment rate in Auckland hadn’t been any lower than that in the rest of New Zealand. This chart uses annual data, up to and including the latest release last week.
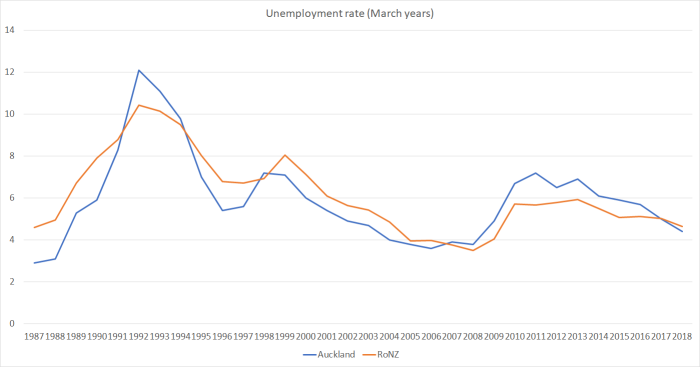
Auckland is a good place to focus on. Not only is it by far the biggest labour market in the country, but it also has by far the highest proportion of foreign-born residents, and receives a disproportionate – but not surprising – share of the new migrants, temporary and permanent. Labour market laws apply nationwide, but you might think that some would be a little less binding in Auckland than elsewhere – for example, there is a nationwide minimum wage, but average productivity is higher in Auckland than on average in the rest of the country. All else equal, again one might expect Auckland’s unemployment rate to have been a little lower than that in the rest of the country.
And yet over the 32 years for which we have the data there is no sign that unemployment rates in Auckland have been lower than those elsewhere. There might be a bit of a cyclical pattern – Auckland does worse in downturns (see early 90s, and the period from 2008 until recently), and better in periods of strong economic growth (and that cyclicality may itself be exacerbated by the large New Zealand cycles in net migration) – but there is no sign of much beyond that.
What about employment rates (calculated as the share of those aged over 15 in paid employment)?
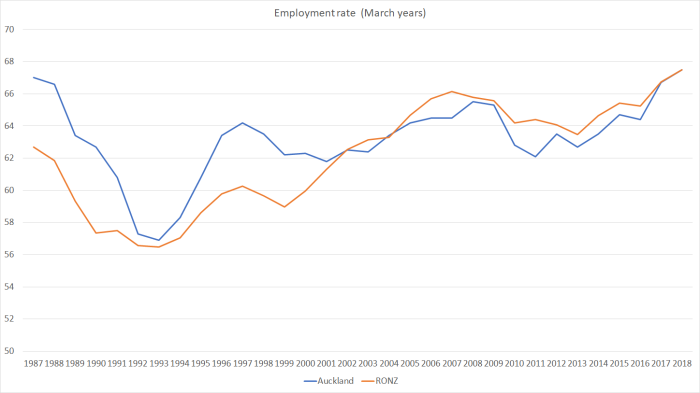
Interestingly, employment rates in Auckland used to be quite a bit higher than those in the rest of New Zealand, but they aren’t now. Perhaps the difference in the earlier period reflects differences in how the economic restructuring and reduction in trade protection affected different regions – it seems plausible (although I’m happy to see any confounding evidence) that the initial job losses might have been more heavily concentrated outside Auckland, with the gap closing again over time. Whatever the explanation for the earlier period, average Auckland employment rates have struggled to match those in the rest of the country over the last 15 years or so (periods encompassing two big waves of non-citizen migration).
And as I thought about it, this chart started to puzzle me more. After all, the denominator is the population of working age, which includes all the elderly, and yet as the recipient of the largest share of migrants wouldn’t one expect Auckland’s working age population to be concentrated in the age ranges with the highest rates of labour force participation? And there are the persistent stories of old people moving out of Auckland – the money tied up in the overpriced house goes further in the provinces.
And, sure enough, here are the official estimates of the share of the working age population aged over 65 in 2017 (the numbers aren’t materially different from the firmer numbers from the 2013 Census).
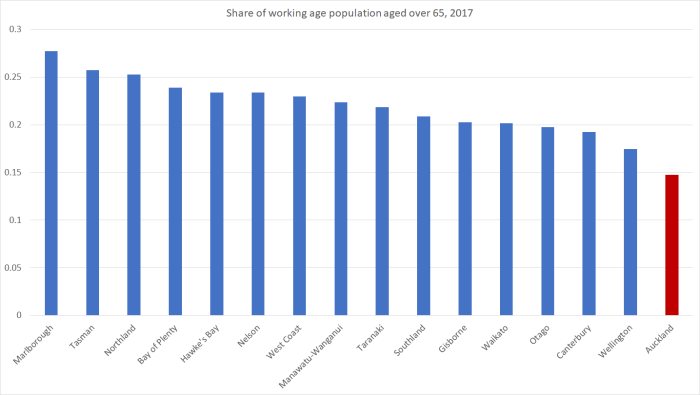
Auckland has by far the lowest share of its working age population aged over 65. Across the country, those aged over 65 have an average employment rate of about 24 per cent, while for the working age population as a whole the employment rate is more like 68 per cent. And yet, despite having so many fewer old people the overall employment rate in Auckland is no higher than in the rest of New Zealand taken together.
There isn’t a great of information about labour force status disaggregated by both age and regional council, but I did find some data for the last few years comparing Auckland and the Wellington and Canterbury regional council areas.
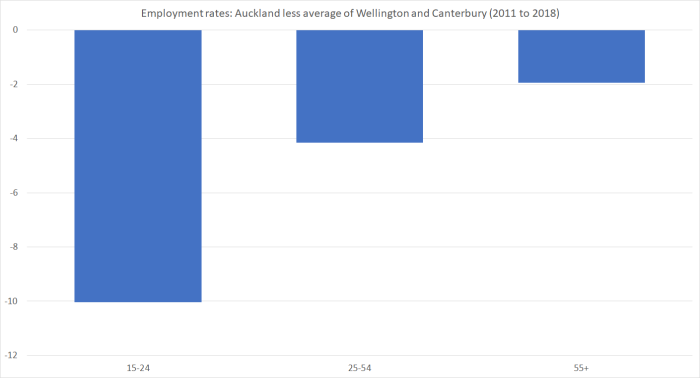
Even among the older cohort, employment rates in Auckland have been a little below those in Wellington and Canterbury (in not a single year was the Auckland rate higher than in either Wellington or Canterbury – despite the smaller number of over 65s). But in the younger cohorts the differences are quite a bit larger. Perhaps some of the difference among the 15-24 cohort reflects the presence of foreign students (although many of them are working), but in the prime age cohort (25 to 54) the average employment rate in Auckland over the last eight years has been, on average, a full four percentage points lower than that in Wellington and Canterbury.
To be clear, this is a not a comment on the employment rates of recent immigrants (which may well be quite – even very – high). The HLFS simply doesn’t have that sort of data. It is an estimate based on the Auckland economy as a whole. And quite what explains it, I’m not quite sure. For anyone wondering if the ethnic composition of Auckland’s population is part (cause or consequence) of the story – whatever factors result in lower Maori and Pacific participation rates – here are the average participation rates for the last decade by ethnicity for Auckland and the rest of the country.
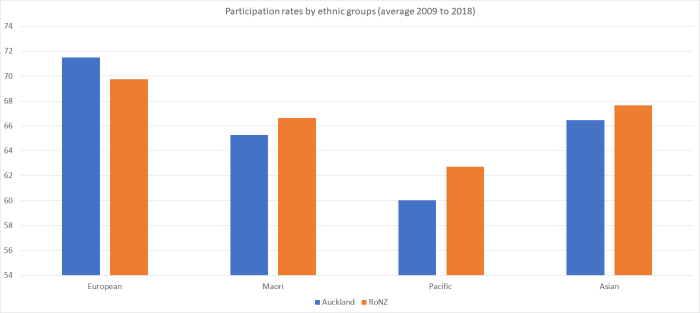
European participation rates have actually been higher in Auckland than in the rest of the country. But Maori and – especially – Pacific participation rates average materially lower.
Whatever the explanation, it isn’t obviously a story in which one of the largest non-citizen immigration programmes anywhere in the world, over decades, has produced an Auckland labour market that seems to be functioning in a way that might suggest economic gains across the board. Unemployment rates are no lower than in the country as a whole, employment rates are materially lower once one allows for the much smaller number of old people in Auckland, and there might be straws in the wind (that final chart) suggesting that the ethnic groups that typically do most poorly in New Zealand anyway are even less likely to be engaged in the labour market in Auckland than in the rest of the country.
Throw in the data I mentioned the other day – average GDP per capita in Auckland lower relative to that in the rest of the country than it was at the turn of the century, and the internal migration data suggesting that (in modest numbers) New Zealanders (net) are leaving Auckland – and it should leave the champions of current immigration policy very much on the defensive. Unwilling or unable to fix the housing/land market, and with no obvious productivity or labour market gains to show for their Auckland-focused strategy, it increasingly looks like a Think Big disaster of a severity and pervasive effect (including on many of our most disadvantaged) that makes the 1980s version (the shockingly uneconomic energy projects) look like a mere bagatelle.
But, remarkably, no political party – major or minor – seems bothered.
(And before anyone pops up to remind me that I often point out that employment is an input not an outcome – not, in itself, a measure of economic success – that is, of course, true. Nonetheless, there aren’t particularly good reasons to suppose that working age Aucklanders have stronger leisure preferences than otherwise similar people in the rest of the country – faced with, eg, the same tax rates – and some reason to suppose it might be the other way round (eg the sheer cost of purchasing a house).)
