The badly dysfunctional New Zealand housing supply market

This chart has had a bit of coverage in the last few days.  It was produced by Statistics New Zealand, and was included in a useful release last week bringing together dwelling consent and population data over the last 50 years or so.

snz picture

As SNZ noted, there is a bit in the chart for everyone.

The number of new homes consented per capita has doubled over the past five years, but is only half the level seen at the peak of the 1970s building boom, Statistics New Zealand said today.

One sees these sorts of per capita charts from time to time, but I’ve never been sure they were very enlightening.  After all, the existing population typically doesn’t need many new houses built –  it is already housed, and the modest associated flow of new building permits will result mostly from changes in tastes, changes in occupancy patterns (eg more marriage breakups will probably increase the number of dwellings required for any given total population) or perhaps even the age composition of the population.  Even quite big differences in  the number of new dwelling permits per capita don’t, in isolation, tell you much: Marlborough and Gisborne have very similar populations, but over the 21 years for which SNZ provides the data, there were almost three times as many houses built in Marlborough as in Gisborne.

Mostly (at least in countries like this one), new houses are needed for increases in the population.  Marlborough’s population was growing over that period, and Gisborne’s wasn’t.

So we might be more interested in the growth of the housing stock relative to the growth of the population.   Growth in the housing stock is typically more interesting than building permits, because if two old villas are demolished to build six townhouses, it is the net addition to the number of dwellings that is typically more interesting, than the number of new units consented.  In recent New Zealand context, if lots of houses are destroyed by an earthquake, the gross number of new consents won’t offer much insight on the supply/demand balance.

SNZ produces some housing stock estimates.  I’m not sure quite how they do them, but they suggest that each year typically about 2000 existing dwellings are destroyed, a tiny proportion of the (current) stock of around 1.8 million dwellings.  If New Zealand’s overall population was static, there would still be a small amount of replacement activity and –  if the Gisborne numbers are roughly indicative –  perhaps 11000 new dwelling consents a year for the country as a whole would be fine.   Gisborne house prices, for anyone interested, are still lower than they were a decade ago.

Here is the nationwide picture since 1991.  This shows the increase in the number of dwellings per increase in the population  (thus, 0.4 means one new dwelling added for each additional 2.5 people).

housing stock

So, far from  the situation improving in the last few years –  as the SNZ chart above might have suggested (and as SNZ themselves suggested) –  things were worse than ever in the year to June 2016.  The population is estimated to have increased by 97300, and yet the housing stock is estimated to have increased by only 23800.  Talk about dysfunction, and no wonder house prices have been rising strongly.  In 1999, 2000 and 2001, by contrast, the population increased by only around 21000 per annum.

SNZ doesn’t have (or not that I can find) annual housing stock estimates back to the 1960s, but we can still look at the new building permit numbers relative to the change in the population.   Here is the chart showing new dwelling permits per person increase in the population.

housing 60sWhat happened?   Well, in the late 1970s the large scale outflow of New Zealanders got underway, and the number of non-citizen immigrants had also been scaled right back.  In the years to June 1979 and June 1980, the population is actually estimated to have fallen slightly, and yet 18000 and 15000 new dwelling consents were granted in each of those two years.  For the three June years from 1978 to  1980 there was no population growth at all, and yet there were more than 50000 new dwellings consented.  No wonder that over the late 1970s and through to around early 1981, New Zealand experienced the largest fall in real house prices (around 40 per cent) in modern history.

Nothing in the data suggests that the New Zealand housing and land supply market is now even remotely capable of coping with population increases of 2 per cent per annum.  Of course in some sense it should, and could, be fixed.  But there is little or no sign of it happening –  are there any reports of peripheral land prices in Auckland collapsing since the Unitary Plan was adopted? – which makes the continued active pursuit of rapid population growth look even more irresponsible (than it would already be, given the absence of evidence of other real economic gains to New Zealanders from such a, now decades-old, strategy)

The social democrats at the Productivity Commission

A short time ago, a press release from the Productivity Commission dropped into my in-box, announcing the release this morning of the Commission’s draft report on better urban planning.    The Government asked the Commission to take a first principles, or “blue skies” approach to the issue.

I’ve been increasingly skeptical of the work of the Productivity Commission.  They often provide some interesting background analysis and research, and yet they increasingly seem to be well described by the old line “when your only tool is a hammer, it is tempting to see every problem as a nail”.  The Productivity Commission is mostly made-up of, and run by, (able) long-term public servants.  Public servants design and help implement the instrument of state –  government attempts to remedy problems, typically with government-based tools.  There is a self-selection bias problem –  people who are inclined believe in the importance/viability of government solutions are more likely to work for government than those who don’t –  and a greater reluctance than usual to ask hard questions about one’s own capabilities, since government agencies typically face few market tests and weak accountability.  The Productivity Commission –  like the OECD –  tends towards smarter better government, not to asking hard questions about whether we couldn’t just get government out of the way in many more areas, as prone too often to being the source of problems rather than the solution.

The Productivity Commission’s report runs to over 400 pages, and since it was released at 5am this morning, I assume no one has read it all.  I was, however, struck by the fact that in a 600 word press release there is no mention of property rights and a single mention of markets (and that not positively).  There is a 10 page overview of the entire report, and a word search suggests that “rights” does not appear at all and “markets” only once.

My unease was heightened when I read this line in the press release

Planning is where individual interests bump up against their neighbours’ interests, and where community and private objectives meet. It is inherently contested and difficult trade-offs sometimes have to be made. These decisions are best made through the political process not the courts.

Again, no mention of rights.  And the prioritisation of the amorphous “community interests”.   The suggestion of increased reliance on the political process rather than the courts hardly seems like a recipe for a clear, stable, predictable (and non-corrupt) regime for managing potential conflicts between the property rights of various individuals and groups.

Perhaps this draft report will recommend some  useful steps in the right direction.  Time will tell.  But on the face of it –  the shop window, of the press release and summary – it seems to fall quite a long way short of a first principles approach in a free society.

Norway and the kitchen sink

In their weekly commentary yesterday, the ANZ economics team offered some thoughts on monetary policy and inflation targeting as conducted in New Zealand.   Among their comments was a reaction to my post the other day about Norway’s success in keeping inflation (and inflation expectations) up.

We noted some comparing the inflation performance of New Zealand and Norway last week, with the latter managing to achieve its inflation target. The argument was that other central banks had achieved it through looser monetary policy so the RBNZ could too. It certainly may be possible to get inflation up by throwing the kitchen sink at it. But household debt in Norway has risen to nearly 230% of disposable income (and is one of the highest in the OECD); that’s an accident waiting to happen. Is the economic cost of CPI inflation being 0.4% versus an arbitrary magical 2% that dire an outcome when one considers the possible side effects of this ‘kitchen sink’ style approach?

As a reminder, here are the policy rates for Norway and New Zealand.

policy int rates nz and norway

I don’t want to put too much weight on Norway, but:

Norway’s approach doesn’t look like ‘the kitchen sink” to me.  It looks like what many/most other central banks have done.   As inflation pressures around the world proved much weaker than most had expected, Norway had more leeway than most (their policy interest rate still hasn’t got to zero, let alone the extreme lows of Switzerland (-0.75 per cent) or Sweden (-0.5 per cent).  They used that leeway, and it seems to have delivered results (inflation fluctuating around target).   By contrast, our Reserve Bank has been constantly reluctant to cut –  having only realized quite late in the piece that they really shouldn’t have been tightening.  As I noted the other day, had the Reserve Bank done nothing more than hold the OCR at 2.5 per cent for the whole time since Graeme Wheeler took office, it is likely that today New Zealand’s inflation rate would be nearer target, and there would be less reason to worry about inflation expectations.  Had they set the OCR at its current level –  2 per cent –  even a year ago, things would look less problematic on the inflation front than they are now.  I don’t accept the characterization that even cutting the OCR to 1 per cent now would be an over the top reaction.  After all, even at that level our nominal policy interest rate would still be materially higher than those in most of the rest of the advanced world (with the important exception of Australia, but then Australia has a higher inflation target than most countries do and so –  all else equal –  should really have slightly higher nominal interest rates).  And many of the advanced economies would have been grateful to have had any additional policy leeway they could have found.  They didn’t have it.  We do.

Am I wholly comfortable with the idea of policy rates at 1 per cent or less, here or in other countries?  No, I’m not.  There is a variety of factors that help explain why policy rates, and long bond rates, are so low –  notably changing demographics and deteriorating productivity growth, both of which weaken the demand for investment –  but I don’t think anyone fully has the answer.  And if you ask whether, over the next 30 years I expect real interest rates to be higher than they are now, I’d answer yes to that.  But that just isn’t (or shouldn’t be) the basis for setting policy rates now –  apart from anything else, we just don’t know much of this stuff with any confidence/certainty.

When central banks set policy rates they should be, more or less, responding to market forces (savings supply, investment demand) –  attempting to mimic what the market would do if governments had not given central banks the right to issue our money.  In the immediate wake of the 2008/09 recession, it was plausible to argue that central banks were holding short-term interest rates down.  Implied future long-term interest rates (freely traded in the market) didn’t come down much at all.  These days that argument no longer holds. In fact, yesterday 10 year government bond rates in New Zealand were actually below 90 day bank bill rates.

yield gap

If anything, on this measure, monetary policy has been tightening not loosening (not inconsistent with my earlier chart showing that the real OCR remains above where it was for most of the post-recession period, even as inflation continues to undershoot).  The last time this measure got above zero was in early 2015, just before the succession of OCR cuts began.

But ANZ appears to believe that the best argument against following Norway in doing what it takes to get inflation back to around target is that Norway’s household debt is among the very highest in the OECD.  In both my posts on Norway, I have pointed out that Norway has had very large house price increases and high household debt.  The Norwegian government has responded to any associated financial stability concerns, by accepting the central bank’s recommendation to impose a “countercyclical capital buffer” on banks –  a relatively non-distortionary measure that requires banks to temporarily hold a larger margin of capital, just in case.

But the Norwegian story is much less alarming than ANZ makes out.   First, while house prices in Norway are very high, here is house price inflation in Norway for the last decade or so.

norway house price inflation

Not great, but much lower than what we’ve been experiencing recently in New Zealand.

And what about household debt?  I presume the ANZ economics team have read Chris Hunt’s Reserve Bank Bulletin article explaining some of the many pitfalls in comparing household debt to disposable income ratios (this piece looking across Nordic countries is also useful)?

That partly reflects challenges in comparing the level of debt across countries.  There are several types of issues.  For example, many countries include the debt associated with unincorporated business activities (small business owners, owner operated farms and some lending associated with rental property) in household sector accounts, since getting good breakdowns can be difficult.  In New Zealand, farm lending and non–mortgage lending to small businesses is not part of household debt, while mortgage lending that finances small business should also be excluded. However, much of New Zealand’s rental property is held by small investors, and lending that finances (the business) of renting out residential property generally is included in the New Zealand measure of household debt.

The other important difference is the way that institutional differences, such as those in the tax system can affect the gross assets and liabilities on a household’s balance sheet across countries, even if the net wealth is the same for two households.  In the Netherlands, for example, interest deductibility for mortgages on owner occupied houses encourages borrowers to have interest only mortgages on the liability side of their balance sheet and, for example, tax-preferred insurance policies on the other side.  At some point, the asset is used to extinguish the liability, but for households with the same amount of wealth and income, both financial assets and financial liabilities will be higher in the Dutch system than they would in the New Zealand system.

In Norway, for example, interest on mortgages is tax-deductible, which is not the case (for owner-occupied houses) in New Zealand.  A country with a stronger tradition of occupation pension schemes, for example, will –  all else equal –  tend to see higher outstanding levels of household debt, and higher levels of pension assets on the other side of a household’s balance sheet.  And a country in which the government levies high rates of tax on individuals and returns the proceeds in high levels of public services (consumed by households) will, all else equal, have a much higher ratio of household debt to disposable income –  for no greater threat to financial stability –  than a country with a lower average tax rate and a lower flow of public services to households.  Last year, on OECD numbers, Norway’s government receipts were 55 per cent of GDP, while New Zealand’s were 42 per cent.    It makes a real difference: if we look instead at the ratio of household debt to GDP, Norway (currently 95 per cent) is actually slightly below New Zealand (currently 99 per cent).

In short, comparisons across time in individual countries are generally meaningful (since the institutional and tax features typically change only slowly), but comparisons across countries at any one period in time are fraught.  The Reserve Bank article rightly focuses on the former.

The Reserve Bank publishes household debt data back to 1990.  In 1990, household debt in New Zealand was 28 per cent of GDP.  That ratio is now 99 per cent of GDP.    Here is a long-term time series chart I found for Norway

norway-households-debt-to-gdp

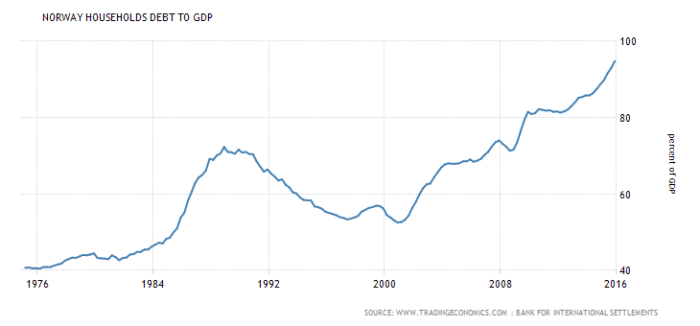
Household debt to GDP in Norway was already around 70 per cent in 1990, and hasn’t been as low as 28 per cent any time in the 40 year history of this series.  If one looks just at, say, the years since 2007, Norway has had more of an increase than New Zealand has, but over a longer-run of time household debt here has increased by (materially) more than what they’ve experienced in Norway.

Of course, perhaps ANZ would like to now reverse the argument and suggest that we need to be even more cautious since we’ve run up much more debt (in change terms) than Norway.  But then they’d have to confront the stress tests (in New Zealand) and the judgements of the respective supervisors that both countries’ banking systems are sound.  Recall those New Zealand stress test results –  and the ANZ is the largest bank in New Zealand –  in which a 55 per cent fall in Auckland house prices and an increase in unemployment to 13 per cent wasn’t enough to severely impair the position of New Zealand banks.  If ANZ thinks that conclusion misrepresented their risks, a phone call to the Reserve Bank’s supervisors might be in order.

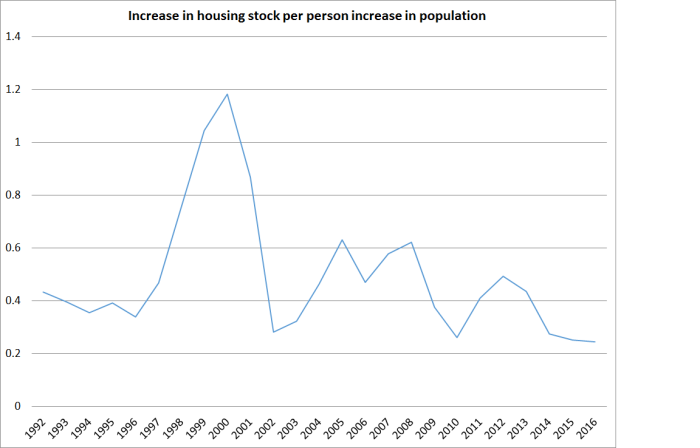
Arguing against doing what it takes to get inflation back to fluctuating around 2 per cent on the basis of household debt numbers just isn’t very compelling. And as I’ve noted before, most of the increase in household debt is in any case a reluctant endogenous response to higher house prices, themselves the outcome of land use restrictions colliding with immigration-driven population pressures.

And that is before considering the other side effects of the current (“reluctant cutter”) policy approach the ANZ seems to be endorsing.  We’ll get another read on the unemployment rate tomorrow, but for now the unemployment rate of 5.2 per cent is well above any estimate of the NAIRU (including Treasury’s of around 4 per cent).  The unemployment rate has been above the NAIRU for seven years now, and almost by definition that gap is one that monetary policy could have done something about had the Reserve Bank chosen to.  There are well-documented long-term adverse implications for the individuals concerned if they are out of employment for long.  That is a rather more concrete cost –  seven years –  than the sort of ill-defined, but quite well protected against, risk around the level of household debt that ANZ worries about.  The Swedes ran policy for several years worrying about household debt risks, before they finally realized that Lars Svensson was right after all and began to cut rates aggressively.

There are distributional implications too. The “reluctant cutter” approach has left our (real and nominal) exchange rate higher than it needed to be –  consistent with meeting the inflation target. In the longer-term countries get and stay rich by finding products they can sell successfully to the rest of the world –  that is, after all, where most of the potential consumers are.  As a reminder, here is our export performance.

exports to gdp by govt

Another 100 basis points off the OCR wouldn’t transform this picture –  the long-term challenges are more about structural policy –  but in the last few years the trend has been in the wrong direction, and a misjudged stance of monetary policy has reinforced that.

There are some other things in the ANZ commentary that I agree with. I strongly endorse their call for a monthly CPI (a properly done one), and I was pleased to see their skepticism as to whether the large scale immigration programme is producing per capita income gains for New Zealanders. I might return to some of the questions about the best design of the monetary policy regime another day.

In the meantime,  for all of the ANZ’s economics team unease about the risks of housing debt, there is no sign of ANZ having published its submission on the Reserve Bank’s proposed new LVR controls.  So we still have no way of knowing whether their CEO was serious is his call for the LVR limits to be set even tighter than what the Reserve Bank is proposing.

The Reserve Bank wants most property investors around the country to have 40 percent deposits in future. We think they should go harder and ask for 60 percent.

I don’t suppose he was, but it would be interesting to see the economic arguments and evidence for such a proposal.
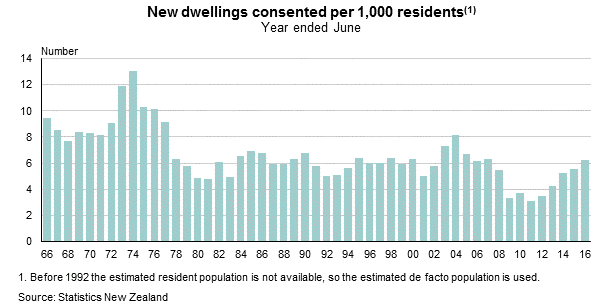
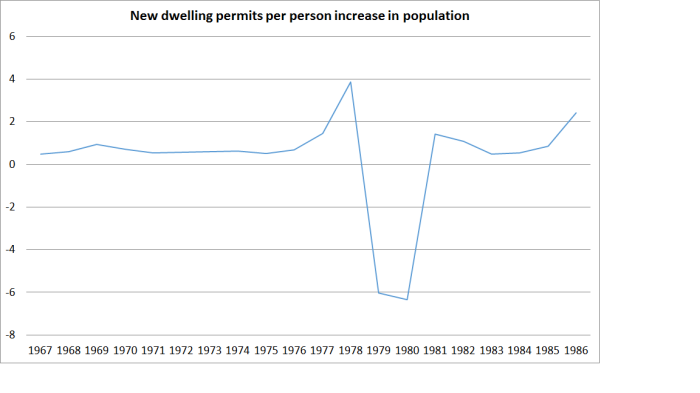
A submission to the Reserve Bank’s faux consultation

A bit under three weeks ago the Reserve Bank announced a proposal for a further, substantial, extension of its LVR controls on banks’ mortgage lending  It is formally a proposal, subject to a consultative process, but it is all done in such a mad rush that it is difficult for anyone to take the “consultation” process seriously.  Late last year, the Bank announced that it would be allowing substantial consultative periods, and on this occasion they have offered no argument or evidence for why it is so urgent that such a short time is allowed for consultation and the preparation of submissions.  Presumably it is just the impatience –  backed by very little analysis – of the Governor –  much the same impatience that means this is now the third attempt in three years to get LVR controls “right”.  What was worse was the instruction to banks to simply fall into line now.  We live in a country supposedly governed by the rule of law, not the whims of men.  And until the proper consultative process has been completed, and the Governor has had regard to all the submissions, what he is proposing (a) is not law, and (b) cannot be counted on as ever being so.  But just to write that is to explain why it is hard to take the consultative process seriously.

I have  written and lodged a submission.  It was a fairly rushed job, but I’m out of commission for the next couple of days and needed to get it in this evening.

Submission to RBNZ consultation on further extension of LVR limits Aug 2016

This is the heart of the conclusion of my submission

In substance, the proposal if adopted will further undermine the efficiency of the financial system, while doing little or nothing to reduce any threats to financial stability (risks which, on your own stress tests are already very low). Indeed, there is a risk that such direct controls could increase, albeit modestly, the risk of serious financial system stresses because it will reduce the volume of capital held against bank mortgage books.    Over time, the growing use of direct controls risks progressively undermining the willingness and ability of banks to do their credit risk assessments, and to compete with each other in doing so,  rewarding going along with the Bank’s assessment of risks, while gaming the rules at the margin wherever possible. 

Since the Bank offers us no reason to think that its own assessment of credit risks –  in the aggregate or at a more disaggregated level –  is superior to that of the market, and since our banks actually came through a much larger housing and credit boom largely unscathed, there is little basis for us to prefer the Bank’s judgement.  And it has offered nothing to suggest how much its planned intervention might affect the probability or severity of any crisis. 

Over-reliance on a very slender base of international evidence, and a failure to think hard about the distinctiveness of New Zealand (from, say, the Irish or US experience) or to make the attempt to gather and analyse New Zealand loss experiences should give citizens little reason to have any confidence in what the Bank is proposing,   Even if investor loans were to prove slightly riskier, all else equal, than owner-occupier loans, the scale of the differentiation in the rules for the two types of lending suggests the Bank is driven at least as much by tilting the playing field against investors and in favour of first-home buyers as by its statutory responsibilities to use its powers in the interests of financial system soundness and efficiency.  If so –  and I hope there is nothing to that suspicion –  it would have involved the Bank stepping well beyond its responsibilities (with little ability for citizens to hold it to account if it did so).

There isn’t much to like in the consultative document.  The empirical evidence they now rely on is two studies undertaken by a central bank (the Irish one) which had already decided to have a regulatory distinction between investor loans and owner-occupier loans.  One of those studies is claimed to examine the UK experience –  in fact, it looks as the loan books in the UK of the three (failed) Irish banks, not necessarily a representative sample of UK experience.  I’m open to the possibility that investor loans are slightly riskier than owner-occupier ones, but have simply not yet been presented with any compelling evidence.  And the Bank has still made no effort to look at the experience in New Zealand, where the post-2008 reductions in house prices in some regions were not dissimilar to the UK experience, where unemployment rates lingered high, and where in some cities nominal house prices stayed well below previous peaks for a prolonged period. Obviously, New Zealand data reflecting New Zealand banking practice, New Zealand law, and New Zealand cultural norms would be more persuasive than the experience of the Irish banks (and even those research papers have some real problems).

The proposed controls differentiate between investor loans and owner-occupier ones to a huge extent.  Implicit in these proposed new rules is the view that loans to an owner-occupier with an 80 per cent LVR are less risky – not just as risky –  as loans to investors with a 60 per cent LVR.   Nothing in the data they’ve presented warrants that sort of differentiation, and it looks like a bit of covert redistributive policy: regardless of the riskiness of the respective loans, make things harder for investors and help out the first home buyers (even though those young buyers might be getting in right near a peak).  That simply isn’t the Bank’s job.  It is charged with financial system soundness and efficiency: it pays lip service at best to the efficiency issues (and the way its controls will progressively undermine competitive credit allocation decisions) and its own stress tests say that the financial stability risks are slight.  And why should regulatory policy be prohibiting a young person in, say, Wanganui getting into the rental property market with an LVR above 60 per cent.  Direct controls lead to arbitrary boundaries, absurd outcomes, and/or ever-increasing regulatory complexity.  That was part of the reason why we deregulated markets, and relied more extensively on indirect instruments, in the 1980s. it remains a good model –  and served New Zealand well through the boom and bust of the last decade, when our banks came through largely unscathed.

A key feature missing from the consultative document is any recognition that to the extent that the controls reduce high LVR lending, they will also reduce the amount of capital banks need to hold against their mortgage books. The Bank argues that the proposals will reduce the risk of financial crisis, but they show no sign of having thought much about the implications of the reduction in required capital.  If the capital requirements for high LVR loans were too low in the first place, that might be one thing. But our risk weights on housing loans are among the highest anywhere, and the Bank went through a consultative process not that long ago to increase those risk weights on high LVR lending.  And as part of what the controls will do is push a pile of lending to just below the respective ceilings –  there will be a lot of 59.9 per cent investor loans , even though a 59.9 per cent loan is little less risky than, say, a 60.1 per cent loan.  Capital requirements are likely to fall further as a result, even if the underlying risks haven’t changed much.   It would be unfortunate if measures ostensibly designed to reduce financial system risk actually modestly increased those risks, by reducing the capital buffers banks have to hold.

I don’t suppose submissions will make any difference to the Bank, but time (not much time, if they plan to have the restrictions in effect from 1 September) will tell.

Readers will recall that a couple of weeks ago the ANZ’s local head, David Hisco, called for the controls to be much more constraining than what the Bank is proposing. As I noted, there was nothing to stop ANZ restraining its lending accordingly.  But I do hope the ANZ will now pro-actively release its submission to the consultation so that we can see if Hisco’s submission on regulatory policy aligned at all with the rhetoric in his newspaper article.

I have lodged an Official Information Act request for all the submissions the Bank receives.  If past practice prevails they will eventually release those of entities other than banks, while claiming that the Reserve Bank Act prohibits the release of the bank submissions. I discussed this curious interpretation of section 105 of the Act the other day.  It cries out for a short amendment to the Reserve Bank Act to make it clear that all submissions on new regulatory proposals of this sort are covered by the Official Information Act.  That, of course, would be just a start on the sort of extensive reforms of the governance of the Reserve Bank that are needed.


Perhaps there is an example after all

I’m pretty pessimistic about the prospects of sorting out the housing supply/land use regulatory mess that, in conjunction with population pressures, has given us –  Auckland in particular –  extremely high house prices (and price to income ratios).  There are no great technical barriers to getting the market working again, with housing as affordable as it used to be.  But I have repeatedly noted here that I’m not aware of any country/region/locality that had once got into such a mess and had found its way back again, unwinding the morass of regulation (tell me again how many pages there are in the draft Unitary Plan).  Each time I make the point, I really hope someone is going to tell me about a compelling counter-example, demonstrating that what it technically possible has also proved politically feasible.

But reading Tyler Cowen’s Marginal Revolution blog just now I found a really encouraging piece headed Laissez-faire in Toyko Land , which in turn draws on a fascinating Financial Times article Why Tokyo is the land of rising home construction but not prices .  I hadn’t paid much attention to Japanese house prices, implicitly ascribing the lack of house price inflation to (a) the aftermath of the 1980s boom, and (b) the flat and now falling population.    But here is the key chart in the FT article

tokyo

Over the last 20 years, Tokyo itself has had about the same rate of population increase as London.  A nice locality apparently relatively near the centre has had faster population growth than San Francisco.  And yet look at the differences in the rates of house price increases.   Sure, the chart flatters Japan because Japan has had general consumer price deflation, while the US and the UK have had general inflation –  but even in real terms, the differences would be large.

Anyway, I’d encourage people to read the blog piece and the underlying article itself.  It isn’t a totally laissez-faire story, but the flexibility that seems to have been introduced to the system following the 1980s boom looks impressive.  I’m not expert – no doubt there are other perspectives on the Tokyo experience –  and perhaps the changes that were put through in Japan could never be done in Anglo countries.  But they were done in Japan. That in itself is encouraging.

UPDATE: I had been continuing to mull this FT material.  It focuses on the change in prices over the last 20 years as a whole, and not at all on the levels.  This 2014 link from one of the FT blogs confirms that the bulk of the 1980s boom in Tokyo prices had been reversed by 1995.  However, it also includes a chart showing price to income ratios for new Tokyo apartments (in the greater Tokyo area) which –  while pretty stable over the last 20 years –  still seem strikingly high, especially once one takes account of the “famously diminutive” size of Tokyo apartments.

And here is an interesting post with a more extensive discussion of Japanese zoning procedures and rules.

Wellington…still growing sluggishly

There was an annoying story on the front page of the Dominion-Post this morning.  The online version of the story is headed “The big squeeze: Wellington’s population could almost double in the next 30 years”, a proposition which appears to be based on nothing more than compounding last year’s estimated population growth for the Wellington city area.  I suppose anything could happen.  The annual immigration target could be doubled or trebled, central government could go on a massive expansion path, or the private sector could discover hitherto untapped opportunities in Wellington.

But if Wellington has outstripped Dunedin over the years, it has hardly managed strong growth.  I went back to my 1913 New Zealand Official Yearbook.  Back then, greater Wellington made up 17 per cent of the total population of the 14 large urban areas (a group made up of the places that were largest then, and those which are largest now –  eg in 1913 Hamilton and Tauranga barely figured, while Gisborne and Timaru did).  Today, the population of greater Wellington (including Kapiti) is about 14 per cent of the population of those 14 urban areas.

population shares wgtn

More recently, SNZ reports estimated data for urban area populations from 1996 to 2015.  Over that period, even Wellington city’s population growth has only slightly exceeded population growth for the country as a whole  –  and been ever so slightly slower than population growth in Nelson.  Take the greater Wellington area and population growth has been slower than that in greater Christchurch, despite the massive disruption from the earthquakes.

population growth since 1996

I’m not sure that this should greatly surprise anyone.  Wellington has been helped by the growth of government (the regulatory state needs staff and it keeps growing, even if the tax share in GDP doesn’t) and by happening to have industries which it remains fashionable to subsidise (the film industry).  On the other hand, it has a somewhat bracing climate –  albeit one staunchly defended by some true Wellingtonians.    There have been some good market-driven businesses built here, but not many choose (and find it optimal) to stay in the longer-term.

Average GDP per capita in Wellington is higher than that in New Zealand as a whole –  no doubt reflecting some combination of the huge number of professional government and government-dependent roles, and the fact that Wellington tends to be attractive to young people not old ones (it is windy and not very warm).  The labour force participation rate in Wellington averages higher than those in, say, Auckland and Christchurch.  But over the 15 years for which we have regional GDP data, average per capita GDP in Wellington has been growing more slowly than that in the rest of the country (a similar story to Auckland).

wgtn regional GDP

So I don’t really see much chance that the population of Wellington – even just that of Wellington city –  is going to double over 30 years.   Even the Wellington City Council’s “chief city planner” (shouldn’t anyone from outside the old eastern-bloc be embarrassed to hold such a title?) acknowledges it is unlikely.

But the focus of the Stuff article was on the Wellington housing market.    Of course, since it is an article about local authorities perhaps it isn’t too surprising that the word “market” does not appear at all –  not once in a reasonably substantial article.  The Council’s British chief bureaucrat, Kevin Lavery, is quoted instead as saying

Lavery said the 15 people who find themselves sitting around the Wellington City Council table after October’s election will have some big decisions to make on the supply, quality and diversity of housing in the capital.

Which really sums up all that is wrong with our system of local government.  Councils and their officials simply should not be in the business of making decisions on the “supply, quality, or diversity” of housing in the city.  That is what we have –  or should have –  markets for.  They are the mechanisms through which private tastes and preferences are reflected and private businesses respond to that (actual and anticipated) demand.  We need local authorities to do things like pave the streets, manage the water and sewerage, provide parks, and perhaps even run libraries.  We don’t need them deciding what sort of houses people are living in and where   The problems –  including the affordability problems – mostly arise when officials and councillors get in the way.  Now if Mr Lavery had simply been noting that no one can really predict what future population growth rates will be, or where people and businesses will prefer to operate, and that Council rules need to be sufficiently minimalistic and flexible to enable housing supply to easily respond to emerging demand, I’d have applauded him.  But no, he doesn’t see a dominant role for the market, but for 15 elected individuals, with neither the expertise nor the incentives to get those decisions right –  and that is no criticism of them individually, no one has that knowledge.

But the “chief city planner” is worried.

The danger was that developers would concentrate more on packing people in than on good design. “We’re not out to generate developments and profit margins for developers. We’re building communities.”

Council bureaucrats are “building communities”?  The mindset is really quite starkly on display.  In market economies, profit margins are part of what makes people willing to take risks, and build businesses –  even develop new subdivisions or apartment blocks –  taking the risk that things might actually go badly wrong.  But “profit margins” seem anathema to the chief planner.  And “good design” seems mostly to be a mantra to impose the tastes of some on everyone, and raise costs of housing.  Again, why is it a matter for local government?

It isn’t just the bureaucrats. Here is our Mayor, presumably somewhat torn between her Green Party credentials (supposedly sceptical of population growth) and her local authority boosterism.

Wellington Mayor Celia Wade-Brown said she believed her council had done plenty during her six years in charge to set the city up for a population boom.

It had signed off on a number of special housing areas with the Government, and was actively consulting communities in several suburbs on potential medium-density housing rules.

Establishing an Urban Development Agency this year would also help increase the city’s housing stock and keep prices in check, she said. The agency will be able to buy and assemble land parcels, and partner with developers.

It is all about bureaucrats and politicians, not at all about empowering markets.  Nothing about respecting property rights or promoting market solutions –  just put your trust in the Mayor and Council staff.  I’m wryly amused by her references to SHAs. There are a few not far from here.  One –  on the site of an old church –  now has a few townhouses almost completed. A much larger one, not 200 metres from where I sit, remains as overgrown, dark, brooding, and undeveloped as ever.  I’m keen to see it developed – though I know many locals aren’t –  but there is simply no sign of any progress.

I guess the election is coming up and the incumbent isn’t well-positioned but when she can end with the observation that

“When our average house price is $560,000 and the Government considers $600,000 to be affordable in Auckland, then I think our city is looking pretty good.”

it is as if very small ambitions indeed have triumphed.

One only has to fly over Wellington to realise just how much land there is in both Wellington city, and the greater Wellington area.  No doubt, the development costs are higher than those for flat cities such as Hamilton, Palmerston North or Hastings.   But there is little excuse for average house prices of $560000 –  responsibility  for that mostly rests with the mayor, councillors and their legion of planners, aided and abetted by central governments that have allowed councils to have such powers.

The Productivity Commission’s draft report on a new urban land use policy framework is apparently due out next month.  They had a mandate to be ambitious in their proposals.  The Commission has so far shown a disconcerting enthusiasm for giving more powers to councils and governments, not fewer (they are bureaucrats themselves, so perhaps even if disappointing it shouldn’t be so surprising). I hope they take seriously the possibility of largely withdrawing the state (central and local) from the urban planning business.  There was a nice piece the other day from a US commentator, Justin Fox, marking the 100th anniversary of zoning in New York.

It also appears to have been the first set of land-use rules in the U.S. that (1) covered an entire city and (2) used the word “zone.”

That was 100 years ago Monday. So happy birthday, zoning! OK if we kill you now — or at least maim you?

There’s a thought. Put markets, and private contracts, back in the driver’s seat, and let local authorities respond to private sector developments, efficiently delivering the limited range of services we really need councils to provide.  Don’t “plan communities”, but provide services to ones that develop.  (And that doesn’t include airport runways.)

A couple of cartoons

I mentioned this morning that talk of slow and controlled adjustment down in house prices reminded me of a cartoon from the 1980s, contrasting the Douglas and Anderton approaches to economic reform.    Having dug around in my garage, here is the cartoon.

douglas

There are no totally easy or fail-safe ways to unwind the disaster that the New Zealand –  especially Auckland –  housing market has become.  But this is a clear example where the sooner it happens the better.  If house prices rose sharply one day and were reversed the next, almost no one suffers.  If prices rise sharply for six months and then fully reverse, a few people will have difficulty –  but the losses will be isolated and limited, posing no sort of systemic threat.  But if real house prices stay at current levels for the next 20 years, most of the housing stock will have been purchased (and borrowed against to finance) at today’s incredibly high prices.  There will have been a massive real wealth transfer to this generation of sellers (sellers, not owners).  And that transfer itself simply can’t be unwound no matter what happens to house prices.  If house prices were to fall now, there has still been quite a redistribution, but four years of turnover is quite different from 20 years of turnover.

In the Douglas-Anderton debates illustrated in the cartoon there were some real and legitimate choices about timing.  If one is stripping away industry protection, or substantially restructuring government agencies, there are some reasonable questions about how much notice one gives people to reorient their lives, and businesses, and find new options.  The protected industries were mostly pretty static, and a signal that protection would be stripped away over five years would call a halt to most new investment anyway.   The house price situation is different.  Even if prices go no higher from here –  the sort of the thing the government and Labour Party seem to want –  more and more people are getting caught in the web of paying (and borrowing) too much for houses with every passing month, just through normal housing turnover.  For each new borrowing family, that choice will affect their consumption options for the rest of their lives.

But lets take a deliberately extreme contrast: on the one hand, house prices fall 50 per cent tomorrow, and in the alternative scenario they fall 50 per cent steadily over the next five years.   Who would gain from the gradual adjustment?  There is no obvious gains to banks –  the debt is what it is, and at least conceptually they’d want to mark down the value of the collateral straightaway.  There is no obvious gain to existing owner-occupiers.  There is no  obvious gain to the economy as a whole –  indeed, arguably a climate of expected continuing falls in house prices might be worse for activity than a single sharp adjustment. Of course, there would be some winners and some losers –  the losers would be the people who for some reason simply had to buy a house in the next few years (they’d pay more than in the sudden adjustment scenario) and the winners are the few smart or lucky people who manage to offload their properties before the full adjustment occurred.  In fact, what we would see is turnover in the housing market dry up for several years, which would also make it more difficult for those who simply had to transact to do so.  Again, not an obvious social gain.

Sadly, it isn’t going to happen, but given the mess successive governments have created a 50 per cent fall in house prices tomorrow as a result of land use liberalisation would be one of the single best things that could happen –  and much better than the false promise of some sort of controlled gradual fall (such things just don’t happen). Sure, it wouldn’t be easy for some, but the number of people who will be adversely affected if the housing problems are ever really resolved grows by the day.

Changing tack, on the front cover of my cartoon collection I have this cartoon from early 1991.

richardson

For some years, I had it pinned to the wall in my office –  the sad procession of successive Ministers of Finance who for decades (this cartoon implies back to the 1950s) had promised that New Zealand’s decline would be reversed (made worse in this case in that Ruth Richardson must have said something along these lines in February 1991, just as the severe recession of that year was taking hold).      Since then, we’ve had Bill Birch, Winston Peters, Bill English, Michael Cullen, and Bill English again, and although we’ve had plenty of cyclical ups and downs, never at any time have we looked like successfully or sustainably reversing our relative economic decline.   It saddens me every time I look at this cartoon –  so many decades, so much failure.

Kudos to the Greens

I’m not usually much inclined to support the Green Party on anything –  their interest in reforming the governance of the Reserve Bank being an admirable exception.  And political courage on doing something about house prices –  and being honest about what making house and urban land more affordable means  – had seemed to be in really short supply from all across the political spectrum.  I’m not sure even the current ACT leader has been willing to openly suggest that if prices in Auckland fell 70 per cent it would only bring them into line with the price to income ratio of around 3 that has been a typical benchmark of affordability (happy to be corrected if I’m wrong on that).

And so I can only commend the Green Party for being willing to say it: house prices should fall, especially those in Auckland, and the fall needs to be large.

On Wednesday Turei, the Greens co-leader, put her neck out politically calling for house prices to be slashed, particularly in Auckland, where the average is knocking on $1 million.

She’s considering policy that house prices drop to about three to four times the median household income.

As the Stuff story puts it

Her party’s approach is not dissimilar from former Reserve Bank chief economist Arthur Grimes and former National and ACT leader Don Brash, who are calling for a 40 per cent drop and as much as a 60 per cent fall respectively.


Don Brash would probably describe himself as being on the right of New Zealand politics, while Grimes has always struck me as being (non-partisan but) a denizen of the mild centre-left.  This isn’t an ideological issue (at least on any traditional left-right spectrum) –  but one about facing facts, and prioritizing people who currently have little hope of ever being able to afford a house.  There is simply no excuse for that sort of systematic exclusion.

Turei says she’s doing work around what a policy would look like but she’s taking a lead from initiatives, such as Auckland Council chief economist Chris Parker’s report picked up by the council to aim for house prices five times the household income by 2030.
“We are saying it like it is. Most people believe house prices are far too high, most people believe house prices need to come down.”
The sad thing is the light that Turei’s comments shed on the leaders of our two largest parties.  We already know that the Prime Minister has dismissed the Grimes call as “crazy” –  not demanding, not uncomfortable for some, just crazy.   And as for the Labour Party.
But Little says the solution is stabilising house prices by cracking down on speculators, building more houses and lifting wages – not crashing the market.
So house prices should stay at these levels and in 40 or 50 years time wages might have caught up –  and our grandchildren might perhaps finally be again able to purchase a house at reasonable multiples to income?
No doubt both sides have been polling furiously on these sorts of issues –  trying to detect whether there is a tipping point in public opinion approaching.  As I’ve said before there is no doubt that sharp falls in prices could be uncomfortable for some.  But the potential unpleasantness is typically much overstated –  at least if a correction were to happen soon.  Most people haven’t entered the house market in the last  four or five years, and many of those who have will have envisaged paying off a mortgage over their working lives.  Our banking system is robust, and there is no chance of some repeat of the US 2008 financial crisis here.  But for some highly-leveraged investor purchasers, a sharp fall could mean a business failure.  That wouldn’t be pleasant for them, but it is in the nature of a market economy –  people take risks, many are rewarded, and others fail.  It is also in  the nature of unwinding distortionary controls that have skewed markets against ordinary people –  whether that is land use restrictions or in years past farm subsidies, import quotas or whatever.
The main point of this post is to praise the Greens.  But having done so, I would add that I’m much less convinced that they have the answers as to how to get prices down again
Turei says addressing the issue involves a capital gains tax, a state house building programme, both state houses being built and a state programme for building houses for sale, the unitary plan and supply.
And I’ve been puzzled for some time as to why a party that is concerned about the impact of people on the environment is so opposed to adjustments in immigration policy being part of the mix.
I also part company from them on timing

Any approach to bringing down house prices needs to be done in a controlled way and over a long period of time, she said.

I think that is exactly the wrong approach –  and the idea of “controlling” the pace of adjustment seems far-fetched.  Turei’s comments remind me of a cartoon –  which I might track down later in the day –  from the 1980s contrasting the Roger Douglas and Jim Anderton approaches to economic reform.  Dressed as surgeons, confronting a gangrenous limb, one advocates lopping off the entire limb in a single blow, while the other advocates removing tissue just a slither at a time.

The sooner house prices come down the easier the adjustment will be –  politically and economically.  The longer the current disaster goes on the larger the proportion of people who will have borrowed and entered the market on the basis of current high prices, and harder it will be, on both political and economic grounds, to secure the support for the necessary adjustments –  the more there will simply be a push to wait out the problems and leave affordable housing as a dream for a couple of generations hence.  That really would be a national failure (well, National and Labour).

A journalist asked me the other day for some comments on the housing market.  They don’t seem to have been used, so I’ll reproduce them here

Do you think the Auckland housing bubble will burst and why/ why not?
 
The best way to think about Auckland house prices is that they have reached their current outrageous levels because of the interaction of rapid population growth (mostly on account of immigration) and tight land use restrictions.   Whether prices, or price to income ratios, ever fall back very sharply mostly depends on what, if anything, governments do about alleviating those pressures.  Net immigration does ebb and flow, but around a very high annual target for the inflow of non-citizens.  There doesn’t seem to be much political appetite to change that target, and there also seems to be only limited appetite for really freeing up land use restrictions.  Allow any land within 100 kilometres of downtown Auckland to have even two storey houses built on it, and the price of urban land would quickly fall a very long way –  owners of land on the margins of the city will be keen to utilize the land as soon as possible, not as slowly as possible.  But far-reaching reform like that doesn’t seem that likely.  So, sadly, while we might see house prices fall back 10 or even 20 per cent in the next recession –  whenever that is –  it is difficult to be optimistic that price to income ratios will drop back to around 3 (where they should be) any decade soon.
If yes – any idea about when?
Forecasting is a mug’s game.  All that can really be said is “please, as soon as possible”.  The longer the eventual adjustment is delayed the more people –  owner-occupiers and investors –  who will caught having borrowed hugely to pay today’s massively distorted prices.  The longer prices stay at these, or even higher levels, the more difficult the economics and politics of ever making Auckland housing affordable again.
To all of which I’d add that I also have no problem with greater intensification, but these things should be decided by landowners, not by councillors, or hearings panels.  Assign property rights in the existing plan provisions to groups of homeowners –  say 500 house groups –  and let them trade changes in those rights.  Use collective action clauses – as are often used in modern bond contracts –  so that a vote of say 80 per cent of land owners in a neighbourhood would be enough to agree changes for that neighbourhood.  It might sound messy, but compared to the current situation it sounds like a path that would actually generate change –  and ensure that affected parties sort these things out in the market, without anguished arguments on Checkpoint about bureaucrats and judges deciding the fates of Panmure, Mission Bay, or wherever.


There is just so much wrong with this sentence

The latest version of the proposed Auckland Unitary Plan –  itself a phrase that leaves me slightly queasy each time I read it –  is apparently due out at 1:30.

Reading an article on it in today’s Herald I found this sentence:

“it will decide where and how Aucklanders will live, work, and play for the next 30 years”

Actually, I doubt even the most fervent advocates will claim all of that for it –  and almost certainly it won’t be what actually happens – but it is a sad reflection of where we have got to, in respect of freedom, property rights, individual choice (add in the sheer unknowability of the future) that a journalist can write a sentence like that and probably not even see anything unusual or controversial about his statement.

In a free society, Aucklanders would make those choices themselves, and Councils (as providers of basic infrastructure and public services) would fit themselves to those private choices exercised in a free market in land, and the ability of private landowners to contract with each other, to respect each others’ interests and property rights

Allow any land within 100 kilometres of downtown Auckland to be built on to a height of two storeys and we’d pretty soon see house and land prices a lot lower, and the market –  private preferences, private opportunities –  would sort out just where the new houses were built.


A good feature of our tax system

Yesterday I commented regretfully on the absence of any sign of much in-depth thinking from the Labour Party about reversing New Zealand’s ongoing relative economic decline.  I noted then that they had plenty of company in that failure.  As one illustration, I saw a piece on The Treasury’s website this morning outlining Treasury’s work programme, which is apparently organized around seven “strategic intentions”.  Each of them is probably fine in their own way, but none bears directly on reversing New Zealand’s decades of relative economic decline.  The standards of the modern Treasury seem to be  reflected in this quote from a related document, trying to recruit a new Chief Economic Adviser:

we are facing up to the challenge that economic actors operate in complex ways and not according to straightforward and predictable scientific models.  Moreover the days when improvements in living standards were measured exclusively by the increase in total production – GDP – are on their way out.

I just shook my head in weary despair.    I no longer have my Stage 1 economics textbook, but I doubt that even there anyone assumed that “economic actors” (people?) are other than complex.  No Treasury in my 30 years of working alongside them ever did.  And perhaps the Treasury could point us to cases where anyone ever thought that “improvements in living standards were measured exclusively by the increase in total production –  GDP”.  We conscripted labour in World War Two –  forced people to work even when they didn’t want or need to, and forced them to work longer hours than they preferred.  That provided a big boost to GDP, but no one thought it boosted living standards – it was a means to an end, defeating our enemies.   If they are really reduced to arguing against such straw men, it would be a very brave, or slightly deluded, person who took on that Treasury role.

But this post is, in part, about praising the Labour Party (and on this one, I suspect Treasury probably agrees with them).  The Herald has an article this morning on turnover taxes on real estate transactions.  They draw on this piece from a UK accountancy firm which looked at turnover taxes (on US$1m houses) in 26 countries.  New Zealand has no turnover taxes on property taxes and so ranks top of the table –  just marginally ahead of Russia, which levies a fee of US$30.45 on such a transaction.  Belgium, by contrast, which has always been known for its high turnover taxes charges US$113131 on a purchase of a $1m house.

The Herald found a local economist, Shamubeel Eaqub, who (in the sub-editors’ words) “frets on tax ranking” and who thinks, in his own words, “it would be a very good thing for New Zealand to tax property purchases”.  To his credit, Labour’s housing spokesman Phil Twyford disagrees noting that “stamp duty is a relatively inefficient tax” and stating that Labour did not advocate stamp duty –   no if, no buts, no suggestions of referring it to a working group.  Stamp duties on property purchases are just bad policy.  In some places (eg Australian states) they have been used when revenue options aren’t available to that particularly authority, but from either tax policy or housing policy perspective, let alone fiscal or labour market considerations, they have almost no other redeeming features and we should be grateful that we are free of such taxes.

The UK accountancy firm that wrote the piece fretted that high turnover taxes might make it hard to recruit overseas senior executives or rich foreign investors.  I’m not sure that the latter concern in particular will really have much resonance among electorates anywhere.  We should worry much more about what turnover taxes mean for the functioning of the market for ordinary people.  Moving cities is expensive enough as it is, without slapping an additional heavy tax on people whose job opportunities mean it is necessary for them to move.  Stamp duties on property transactions bear no relationship to ability to pay or any of the other usual desirable features of a tax system.  At the margin, they impede labour mobility, undermining the effectiveness of the labour market.  And, almost certainly, they reduce housing turnover.  Some might see that as a good thing, since high housing turnover is often associated with rising prices –  but it isn’t the turnover that generates the higher prices, it is the underlying boost to demand that lifts turnover and prices together.   Structurally reducing the level of housing turnover would simply reduce the choices people face when they do come to the market.  And where it might make good practical sense, on account of changing family circumstances, to move house, such taxes will simply encourage more people to alter and extend an existing house instead.  There is no obvious welfare gain from that.

And, of course, there is no sign that the presence or absence of a turnover tax plays any part in explaining cross-country variation in house prices, or price to income ratios.  Belgium’s houses certainly aren’t cheap, Australia and the UK both have quite material turnover taxes and house price problems as severe as ours, and in the US places fast-growing places with very affordable housing co-exist with highly unaffordable cities all in a regime with very low property turnover taxes

I’m also very uneasy about property taxes tied to turnover – whether stamp duties, or realisations-based capital gains taxes (which all real world CGTs) are –  because of the fiscal risks they create.  When times are good property turnover is higher than usual –  often quite a lot higher than usual.  Tax revenue floods in –  not just 10 per cent higher than GDP when GDP is 10 per cent higher, but multiplicatively so (housing turnover per capita might double or treble from bust to boom),  If the boom runs for several years, the fiscal authorities –  officials and politicians –  come to treat the higher level of revenue as normal, and perhaps even sustainable.  Even if some boffins in Treasury keep sounding the alarm, politicians have elections to win and abundant revenue encourages even-more abundant spending.  This is a problem even when tax systems draw almost entirely on income and consumption –  our own Treasury finally caved in in 2008 and conceded that the higher levels of revenue built up during the boom of the previous few years was sustainable,  just before the severe recession blew to pieces all those assumptions. It was much m0re of a problem in Ireland, where property-based revenue had hugely flattered the fiscal picture in the years leading up to the crisis.  It is fine to talk about clever schemes to limit these risks –  fiscal rules or separate funds –  but they rarely work well.  And there is no good tax policy or housing policy case for turnover taxes in the first place.

I’m not so keen on the rest of Labour’s housing tax policy –  extending the quasi capital gains tax for investment properties, or “axing” so-called negative gearing –  but credit to them for having no truck with pure turnover taxes.

(UPDATE: I noticed that Treasury recently released some material on the – rather limited –  work they had been doing on the possibility of a stamp duty –   turnover tax –  for residential property).