Before the election I ran several posts here trying to look at New Zealand’s fiscal position – deficits and debt – by comparison with other advanced countries. The problem with doing so was that the IMF and OECD only come out with their comparable numbers/tables every six months, although the IMF Article IV report released in September did have some updated New Zealand numbers in IMF format.
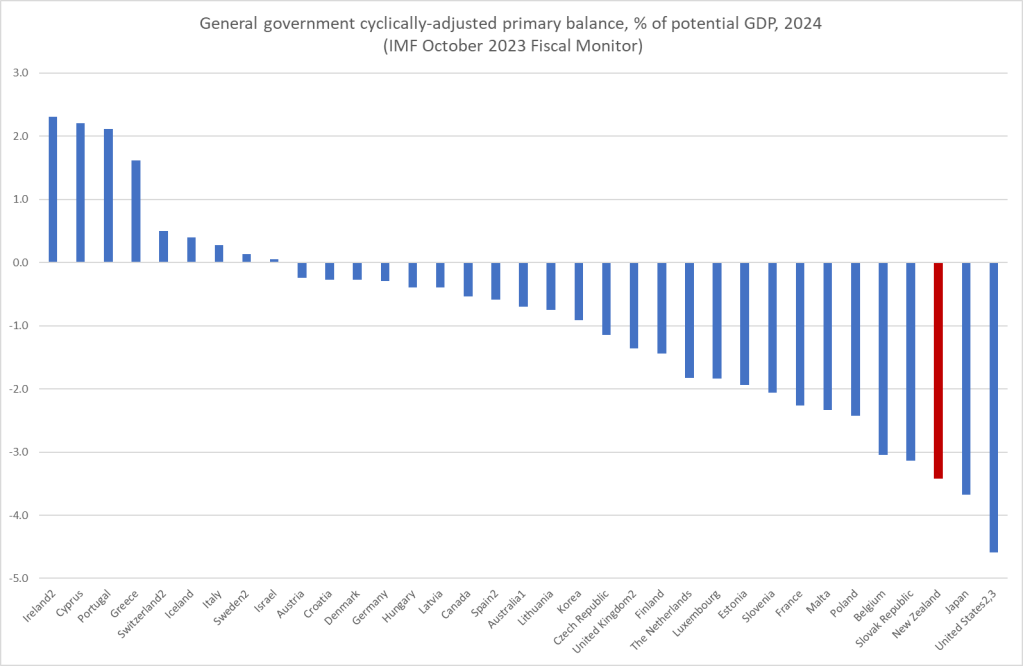
The IMF Fiscal Monitor came out in early October and I did a quick post the day before the election using those numbers across the full set of advanced economies. Those comparisons, using cyclically-adjusted primary balance estimates, showed New Zealand in a pretty poor light.
The OECD published its latest Economic Outlook a day or two ago, and with it a full database. Nothing much fiscally will have happened in New Zealand between when the IMF and OECD numbers were finalised (the new government’s policy programme released last Friday won’t have been incorporated), so these are probably the last read on fiscal policy and fiscal imbalances based on the Labour government’s policies.
(Unfortunately, the Treasury HYEFU may yet be something of a mixed bag in what it tells us, as it isn’t clear how much of the new government’s policies will have reached a point where estimated effects can be included in the Treasury numbers, which might well being finalised in a week or so from now.)
I downloaded several series. My preference has been to focus on the general government primary balance, as a per cent of GDP, whether headline or cyclically-adjusted numbers (the latter are generally preferred in principle but……a lot turns on output gap estimates).
Here is the headline primary balance series, shown by comparison with that for the median OECD country
We (a) used to run primary surpluses and no longer do, and (b) used to have a more favourable fiscal balance than the median OECD country, but no longer do. Things were heading in that direction even before Covid, and the picture still holds now and (in the projections for the next year or two) now that Covid fiscal pressures are a thing of the past. But….the gap between us and the median OECD country isn’t very large.
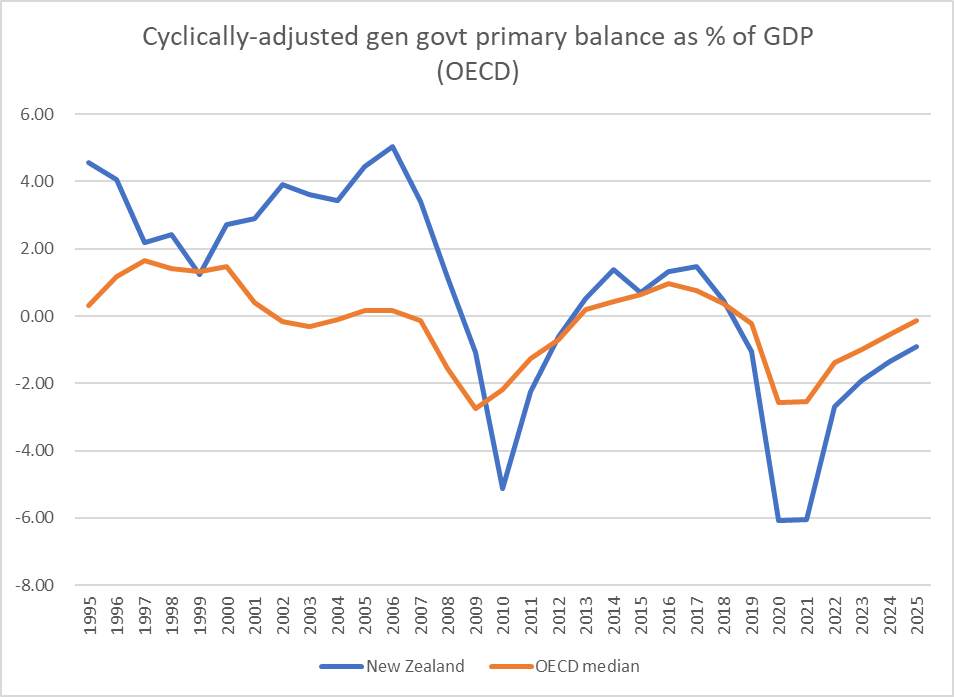
Here are the same two series on a cyclically-adjusted basis, where the gap – NZ worse than the median OECD country – is larger (and where the median OECD country has much the same balance as the average of the previous 20 years).
As something of a memo item, here is another fiscal balance measure. Net lending is a measure of the gap between government saving and government investment flows. The picture isn’t too different from the first chart above.
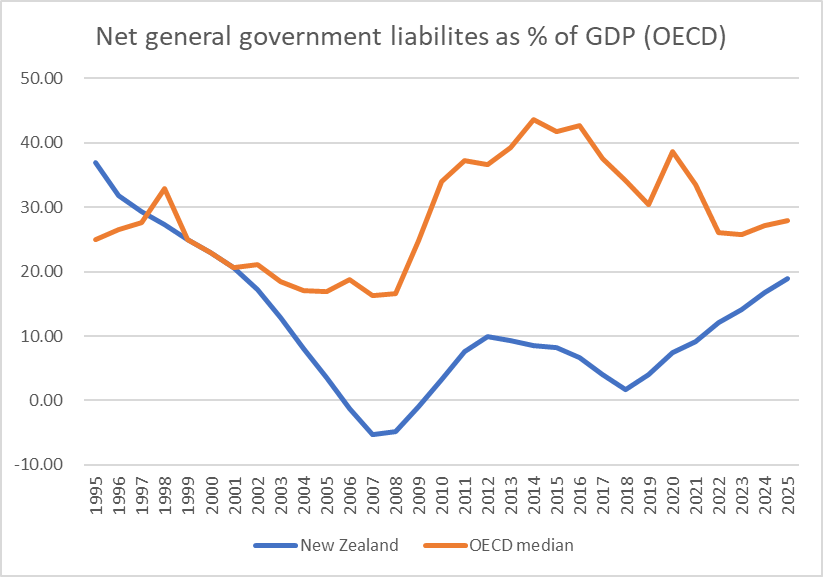
What about debt? The OECD measure is (general government) net financial liabilities
We used to have a lot less net debt than the median OECD country but that gap has closed considerably in the last five years, and on pre-election policies was on track to close quite a bit more in the next couple of years. Note (a point clear in earlier posts) that the median other advanced economy has not increased debt as a per cent of GDP since just prior to Covid. That is a stark difference to New Zealand.
(Incidentally It isn’t true of the OECD wastrel big countries. Here is the feel-better comparison between them and New Zealand
I set out to do this post mostly for completeness, but in doing so it also became clear how different the IMF and OECD numbers are for New Zealand’s cyclically-adjusted deficit measures. I highlighted pre-election that on the IMF’s numbers our cyclically-adjusted primary deficit for 2024 was the third largest in the group of advanced economies. As you can see from the second chart above, the OECD thinks our deficit this year and next, on current policies, will be larger than that of the median OECD country. But we aren’t anything like third worst. perhaps 10th worst (out of 30 or so countries). That isn’t great, but it is rather less headline-grabbing than the IMF numbers had suggested.
What accounts for the difference? Fiscal policy hasn’t changed.
But there are quite different views how much any headline fiscal deficit needs to be adjusted to account simply for the state of the cycle. In other words, the two international agencies have widely divergent views on the output gap (calender year numbers)
Taking last year (2022) as a starting point both the IMF and the Reserve Bank see the New Zealand economy as having been hugely overheated, with positive output gaps of almost 3 per cent of GDP. By contrast, the OECD’s 1 per cent output gap represents only a modest degree of overheating. For this year, the OECD thinks that across the year as a whole there has been no excess demand, whereas the IMF thinks the economy has still been badly overheated (the Reserve Bank is somewhere in the middle, and I’d noted the contrast between their view and the IMF’s in a post a month or so ago).
For next year – all essentially on current policy as the Reserve Bank’s endogenous monetary policy projections don’t have the OCR changing materially – the differences are equally large, but this time the OECD number is between those of the IMF and the Reserve Bank. The IMF reckoned the economy would still on average be moderately overheated next year, while both the Bank and the OECD see a lot of disinflationary pressure.
What is interesting is that the three agencies have almost identical unemployment rate numbers. Last year’s numbers are, of course, already hard, but when the IMF did this year’s numbers it had only the June quarter outcomes, and all the 2024 numbers are simply forecasts (calendar year averages)
If I had to punt, my sense would be that “truth” about excess demand/capacity rests somewhere between the OECD and RBNZ numbers for this year, with a lot more uncertainty about next year. Whatever the correct answer our deficits are projected to be worse than those of the median OECD country – and a lot worse than they used to be – but quite how much worse depends on just how stretched the economy has really been. (If it is still materially overstretched the Crown will be pulling in a lot of revenue that simply won’t be sustained when things normalise).
In one of my pre-election posts, I lamented the fact that Treasury does not provide their own fiscal numbers, and own cyclically-adjusted balance estimates, in a format that allows their numbers for New Zealand to be compared to those the international agencies are producing for other countries. Failure to do so makes timely international comparisons hard, and if at times that suited the politicians, one would hope that Treasury itself had a stronger commitment to enabling effective cross-country comparisons (New Zealand data on its own really only allows comparisons across time in New Zealand, a relevant metric but far from being the only one).
In both monetary policy and policing there is a case for a considerable degree of operational independence from politicians. The case is (by far) strongest in respect of the Police, where it would be just egregiously unacceptable to have a system in which politicians got to decide who was and wasn’t arrested or charged. It isn’t a foolproof system, because Police Commissioners can have their own biases and preferences, and if there are some (eventual) protections against them arresting people for things that aren’t crimes or on allegations that have no real foundations, or against them simply making up evidence, there are no real protections against them just choosing not to enforce the laws Parliament has written. But constabulary independence is better than the alternative.
The case in respect of monetary policy is technocratic, and views have come and gone on the strength of that case. Operational independence has been the fashion of the last few decades, although in many countries (including New Zealand) there has always been scope for political overrides.
But, whatever your views on the case, in a free society operational independence has to be matched by effective accountability. If you wield great power you must be accountable for its use, and “accountability” here cannot just mean something as feeble as having to publish an Annual Report or front up once in a while at a select committee. The standard form of accountability – really in any job, but certainly in public life – is the threat of losing your job. That is, after all, what happens to politicians: when enough of us disapprove enough of their performance they lose the election, and office.
Both the Police Commissioner and the Reserve Bank Governor can be dismissed, but it is interesting to compare and contrast the statutory provisions.
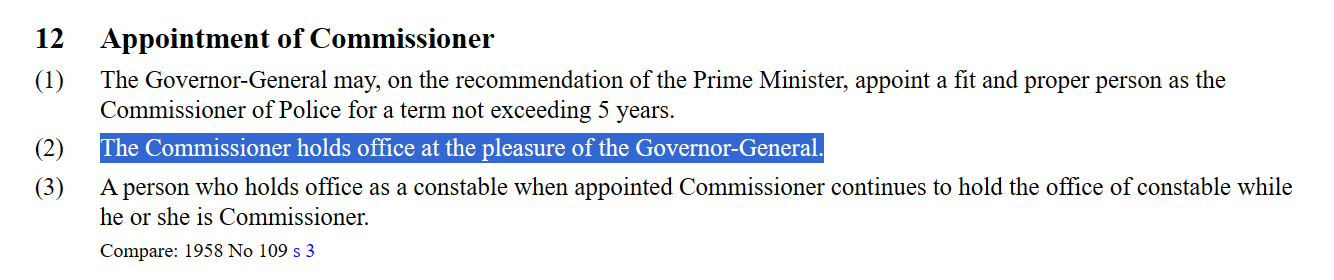
First, from the Policing Act 2008
I hadn’t known until yesterday (when stories were around as to whether the new Minister of Police would or would not express confidence in the current Commissioner) that the Police Commissioner could be dismissed at will. It isn’t old legislation, and there don’t seem to be any process etc requirements in the Act around potential dismissal. All it seems to take is the signature of the Governor-General acting on advice.
My family used to be keen watchers of the New York police show Blue Bloods and I was always struck then by the fact that the mayor could dismiss the police commissioner at will, a point both (fictional) parties noted fairly often. It had the feel then of something open to abuse (and like all these things, in practice conventions and ex post scrutiny act as restraints) but I guess it recognises that ultimately the law and the enforcement of the law – the coercive powers of the state – are political matters.
To be honest, dismissal at will (with no compensation) seems a rather dangerous provision when it comes to the Commissioner of Police. It might be quite reasonable for a new government to want a different style of policing, and thus a different sort of person to run the Police, but if so they should be prepared to (and required to) state their reasons, and offer some compensation for loss of office. But what we shouldn’t want is a Commissioner of Police pandering to the minister behind the scenes to save his or her job, whether the pander involved things nearer to policy or things nearer to protection for some mate of a government (the latter might seem low risk, but we build institutions against tough times and risks of attempts to pervert the system).
I’m not overly interested in Police or the current Commissioner, and don’t have any strong views on his fate (although it probably isn’t irrelevant that his term only has 16 months to run) but I am interested in the Reserve Bank, and particularly the contrast between the dismissal provisions for the Police Commissioner and those who exercise official power at the Bank, notably the Governor. The statutory provisions in the Reserve Bank legislation are a little more complex.
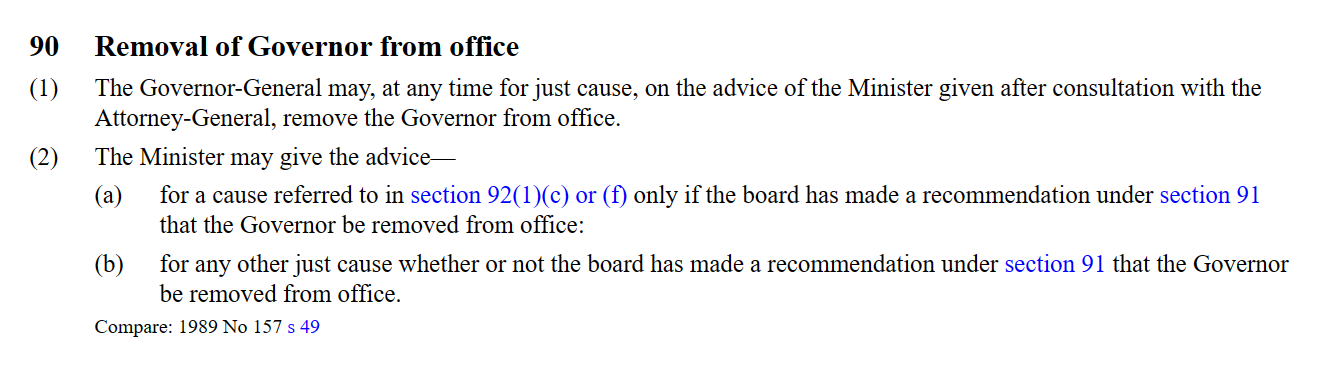
Take the Governor first
The Governor can be dismissed at any time, but only “for just cause”. That immediately makes it much harder to dismiss a Governor, because it injects the potential for the courts to become involved in reviewing whether any cause cited by a Minister of Finance in dismissing the Governor was a just one. That makes dismissal almost inconceivable as a practical option, except perhaps in a truly egregious case of public disgrace (eg Governor charged with a serious criminal offence), or physical or mental incapability, because with so much power resting in the Bank we could not reasonably have months of market uncertainty while a court process, and appeals, were worked through.
What might constitute a just cause? You’ll notice in section 90(2) there are two sub-clauses. The first (2a) allows the Minister to seek to dismiss the Governor if (and only if) the Bank’s Board has made a recommendation to dismiss (for the current situation, remember that the entire Board was appointed in one go by the previous Labour government, and signed off on the Governor’s reappointment only last year). That particular provision is narrow – relating specifically to relations between the Governor and the Board.
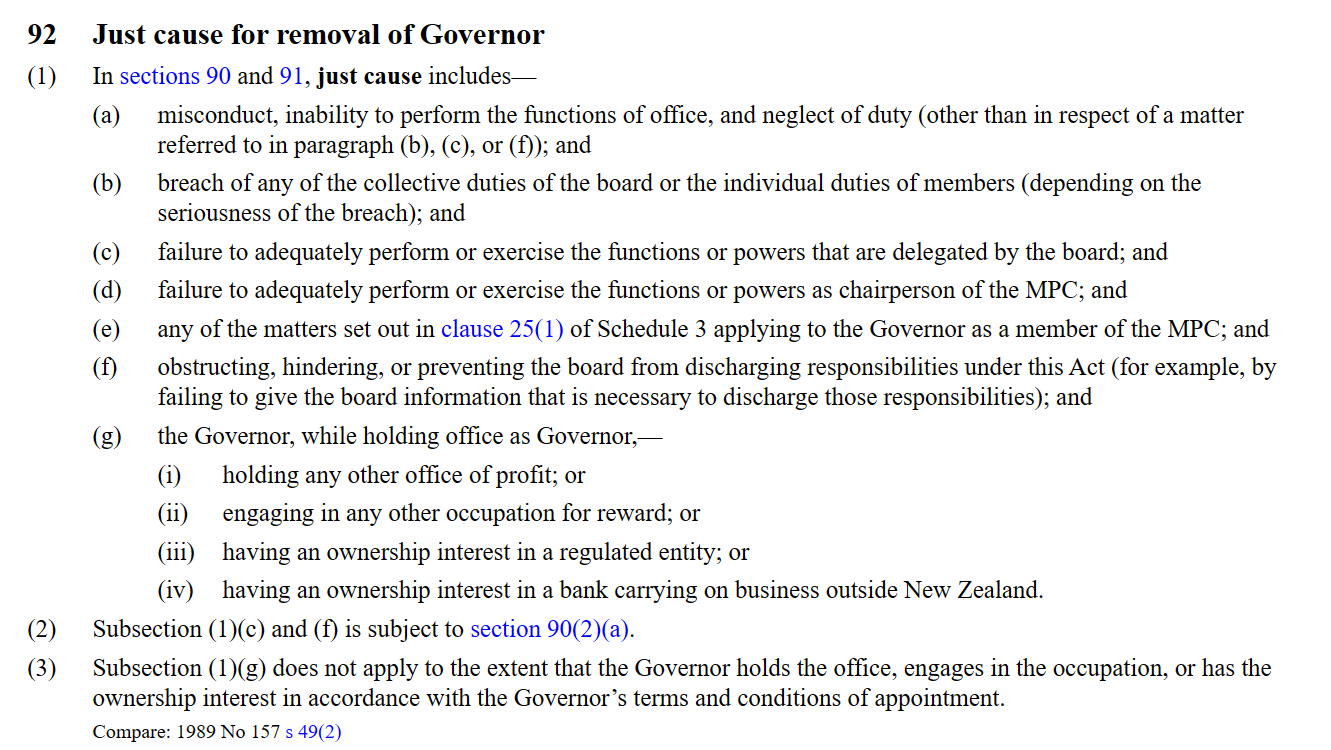
The more general case is 2b, where the Minister can seek to dismiss whether or not the Board agrees. And what does the Act say counts as “just cause”?
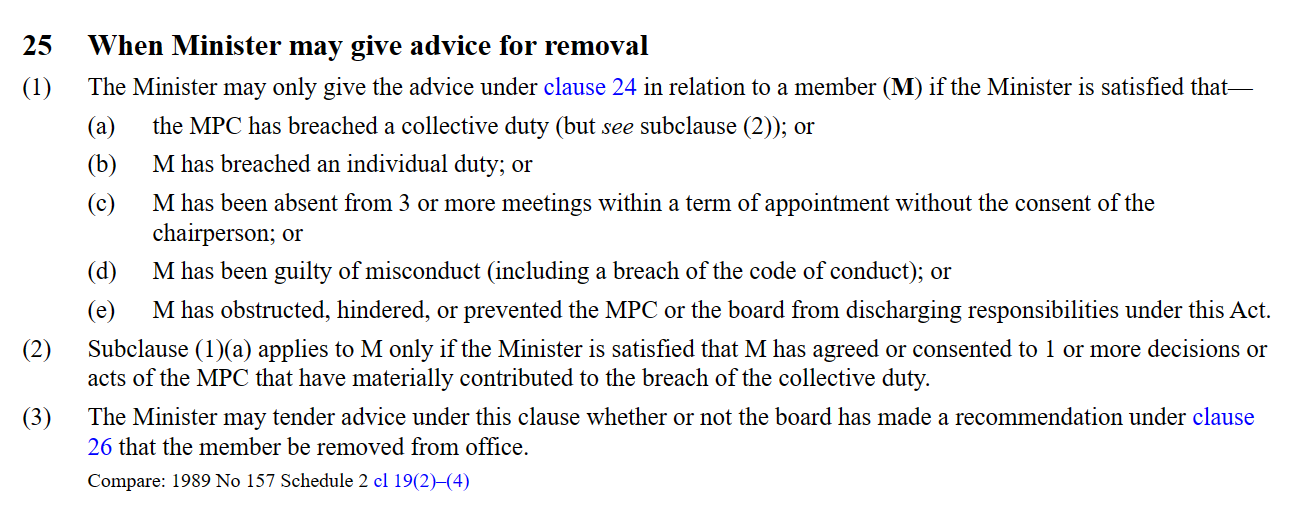
It needs to be read together with this, which applies also to other MPC members
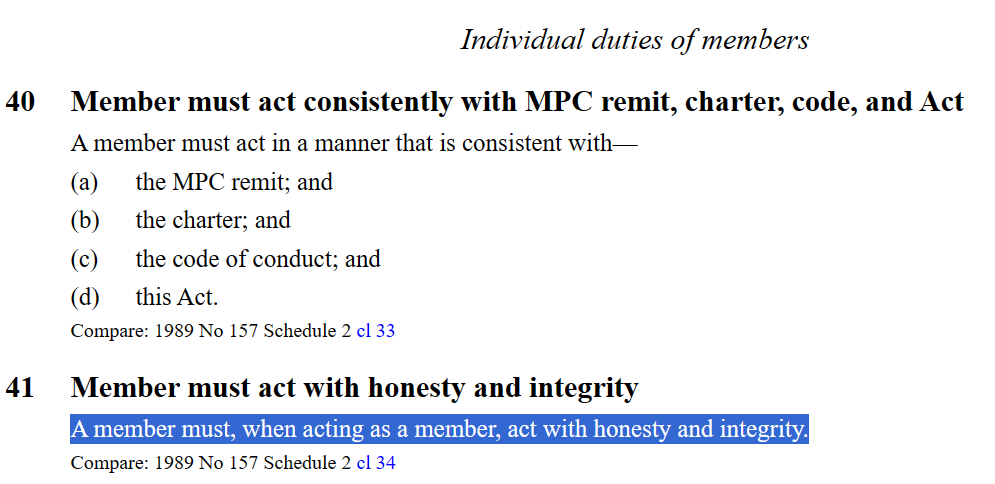
It is a long list, but it is really quite restrictive. Against the backdrop of Adrian Orr’s performance, probably only 92(1a) and 25(1a) are likely to be relevant. And, although the lawyers may have a different view, I’ve take these provisions as applying only to things done (or at least apparent) in the Governor’s current term of office. It isn’t obvious that he could be dismissed for the failures (of which there were many) in his first term, which expired in March this year, even if those failures were captured by these specific grounds for dismissal.
What of 92(1a)? I doubt anyone could mount a seriously credible argument that Orr was unable to perform the duties of his office or that he had neglected his duties (his focus on many other things not his responsibility notwithstanding). What of “misconduct”? I reckon actively misleading (or worse) the Finance and Expenditure Committee this year should count – it is a clear breach of Parliament’s own rules – but…..it is probably a stretch against the wording of this particular piece of legislation.
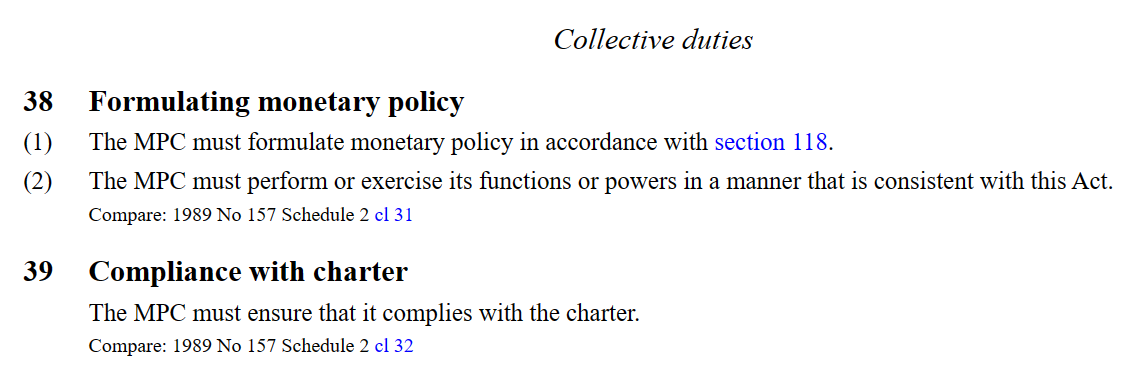
And so that brings us to section 25 in the schedule covering MPC members, including the Governor. On paper, 25(1)(a) sounds most promising. But what are the ‘collective duties’ of the MPC?
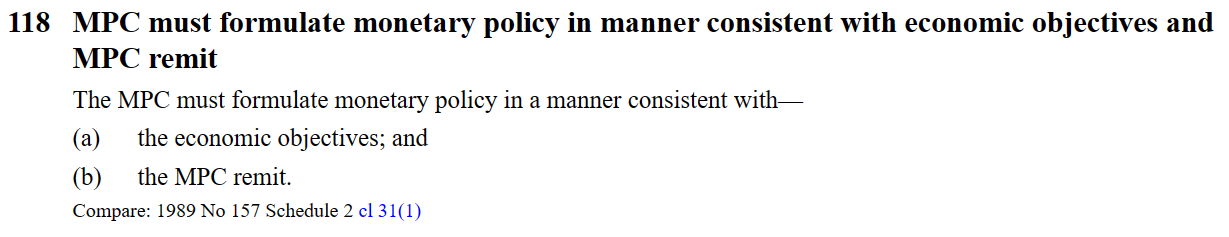
The MPC, under the lead of the dominant Governor, may have burned through $12 billion of taxpayers’ money, delivered inflation well above target for three years in a row, failed to deliver much in the way of speeches or serious supporting analysis……..all things that seem like clear marks of failure in the job, but it is simply impossible to envisage a court accepting that policy was not formulated (at the time) in a manner consistent with the Remit. It clearly was. It was just done very very badly, with not a sign of any contrition since from any of them. The sort of thing that should mean you could lose your job. But not, it appears, when you are the Governor or MPC member. Could continuing to run a big open punt on the bond market now (years on from Covid) count? I doubt it, as I doubt it would be considered now as “formulating monetary policy”, and it clearly had the support of the Board and the previous Minister of Finance.
The final possibility might be
I don’t think actively attempting to mislead FEC, in his role as Governor and MPC member, is acting “with honesty and integrity”…..but it seems a stretch.
Were Orr operating under Police Commissioner rules (law) he – and his fellow MPC members (especially the externals) – could be dismissed at will. It is not a choice that should ever be made lightly (and the terms of two externals in any case expire shortly), but when you (individually and collectively) have done as badly as Orr and his colleagues have in recent years it should be an option open to an incoming Minister. After all, the new government can impose a new Remit – against which the MPC has to operate – pretty much at will (doesn’t require legislation, at least within quite wide bounds) so why shouldn’t it be able to dismiss the key individuals and ensure that those holding these powerful offices genuinely enjoy the confidence of ministers?
If I could wave a wand I’d make it easier to dismiss Governors and MPC members and a bit harder to dismiss the Police Commissioner. As it is, it reminds me of an article I wrote perhaps 15 years ago – which the the Bank’s Board weren’t too comfortable with and insisted on changes – suggesting that in practice accountability for the Governor mostly existed at the point of reappointment. And since then governments have amended the legislation to make it a bit harder to dismiss the Governor, while limiting to two the number of terms any Governor can serve. Over the objection of the Opposition parties, Robertson chose to reappoint Orr last year, and since he is now on his second term (as are all the external MPC members) and can’t be reappointed again we are in this unacceptable position of someone exercising enormous power (doing it poorly, and having done a particularly poor job in recent years) and facing no effective accountability at all.
Of course, there are always options of seeking to buy out the Governor – whether directly or through the offer of another public role – but that would be to reward failure and poor performance, not punish it.
Were the Governor an honourable man he would already have resigned. But were he an honourable man he would at some point have expressed some serious contrition in recent years. Instead, he wields the power and we – and the incoming government – are left with massive financial losses, a huge inflation shock, and a poorly performing institution.
First, the ministerial list with its 28 ministers and 2 under secretaries, in a Parliament that at standard size has only 120 MPs. Yes, it is one fewer undersecretary than Ardern had in 2017 (meeting the ambitions of three parties as well) but…..this was supposed to be the government of busting public sector bloat, not simply matching previous excess (Luxon was quoted yesterday defending his numbers by reference to Ardern). Supporters of the government will pop up on Twitter suggesting there is a big agenda and they may all be very able people, but……it is far from obvious why (for example) we need an undersecretary to the Minister for Media and Communications, the entire job of one NZ First appointee (this parallels a 2017 appointment when one Labour person had the entire job of being undersecretary to the Minister of Ethnic Communities, a portfolio itself barely a job in the first place). The reforming governments of 1984 and 1990 didn’t seem to need executives of 30 or 31 people to get their jobs done.
And then there are all the portfolios: 76 of them by my count (up by five, I think, from the previous government, and 68 in the first Ardern ministry). If I read the table on Wikipedia correctly, the 1984 governments had only about 45 portfolios. It seems to have become a cheap form of pandering (pure portfolio labels themselves don’t cost much, but over time portfolio labels probably tend to beget activities and expenditure) to almost conceivable sector and population group.
It is almost as if your existence isn’t validated until the government has created a ministerial portfolio that covers you. (It is not as if none of these portfolios has any useful substantive content but…..why do we need a minister “for” manufacturing, or “for” hunting and fishing” or “for” hospitality, let alone for something as basic and individual as “recreation? I’ll go further – taking for granting that the Racing portfolio is absurd – and suggest there is no need for a Minister for Tourism either, even if we have had one for more than a hundred years. And that is before starting on the plethora of population ministries, for not one of which one could really mount a serious case for (notwithstanding there may be bits and bobs of real needed stuff in places like Maori Development). None of it speaks of a government that is serious about shrinking the public sector and back-office bloat. The amounts involved of course aren’t individually large, but the pennies add up, and people look to actions at least as much as words.
What of the coalition agreements. The preambles made interesting reading (basically the same, but here I’ve used the ACT one) for what the parties wanted us to believe they were about.
I was struck by the two highlighted bits. First, I wasn’t sure – even though all parties talk it up – why “social cohesion” was thought to be a good thing (seemed to be talked about eg by people wanting “hate speech” laws or the dodgy Disinformation Project people). There are real and deep divides among people, and values differ very deeply – I (for example) regard most of the parties of the further left as repugnant (on multiple grounds) and am not any keener on David Seymour’s moral vision. Much of the country now, on the other hand, regards orthodox Christianity as repugnant (governments even legislating to outlaw some of it). We all have to rub along in some form or another living in a common space, but that is about it surely? And second, that bit about being a “world economic and social leader”. It was bit puzzling for two reasons: first, there is no way what is in these agreements is at all consistent with that stated ambition (and, to be fair, National in particular never suggested otherwise in the campaign) and second, when New Zealand was regarded as a “world economic and social leader” wasn’t that primarily under the pre-war Liberal governments that were relentlessly extending the role of the state? As for “export powerhouse”, well I suppose it sounded good when they wrote it down.
For those who haven’t dug into the coalition agreement documents themselves you might not have seen mention of the “Ongoing Decision-Making Principles”. These are them
I take them with something of a pinch of salt, but I was pleased to “rigorous cost-benefit analysis” in there twice. Let us hope so. It would certainly make a change, and not just from the most recent previous government.
Consistent with the pinch of salt approach, there was a telling item in the ACT agreement. It starts “when evaluating government expenditure it should be assessed on the extent to which it is delivering public goods [here I’m going “tick”], social insurance [another “tick”, perhaps a little less enthusiastic], regulating market failure [“tick”, I suppose, although “being cognisant of government failure” would go nicely with that] and [………..wait for it] political choice”.
You have to wonder why they bothered. It was going quite well with that list, until the “and anything else we happen to want to spend money on at the time” was added. It is realistic I guess, but not exactly inspiring or even very aspirational.
The bigger question across all these documents (which incorporate, when not specifically excluded, the things in National’s 100 day plan, their 100 point economic plan, and their fiscal and tax plans (“plan” in some cases being a generous description)), is to what extent the new government’s programme mostly unwinds some of the bad stuff the previous government did and to what extent it genuinely sets a pathway to a much better future. Whatever you think of the state of things when National left office in 2017 – and at least there wasn’t a fiscal deficit – our average productivity performance was then as poor as ever, business investment lagged that in most OECD countries, and no real progress was being made towards abundant and easily affordable housing. And, for example, the Wellington City Council still wasn’t well-run and was still prioritising ideological vanity projects over basics (water, most notably).
There is a long list of stuff in the documents outlining the new government’s programme that I like. But it is long on things (small and large) undoing the last government’s agenda, most of which I put big ticks next to.
But it seems (and I’d like to believe I was misreading it, but I don’t think I am) short on making for a much better future relative to 2017.
Take the business side of things. National has long talked about encouraging foreign investment, but…..there was never much in their campaign, and the ill-conceived attempt to ease the foreign buyers housing ban proved stillborn. There seems to be a commitment to make it easier for overseas investors to engage in build-to-rent housing projects which sounds positive. But there isn’t much beyond that. The one item I spotted was this
which sounds as though it should be positive, but also seems quite limited. Presumably all the screening requirements and other current restrictions remain in place.
New Zealand has one of the highest company tax rates in the OECD, and not only is there nothing in the agreements to lower that rate – which bears most on foreign investors – but they are proceeding with the same distortionary policy Labour also proposed to remove tax-depreciation provisions for buildings (offices, factories etc). It is a step in the wrong direction.
There are some positives, including provisions around consenting for renewable energy projects and infrastructure projects, ending the oil and gas ban, encouraging minerals development and exploration, and to the extent that they are followed through on and work a focus on better schooling should produce some economic payoffs a decade or more hence (which isn’t a criticism just a reality). I’m all for school choice, but it is mostly about choice (good in its own right), and it isn’t yet clear how far the parties will be willing to go. The talk of a new RMA sounds good on paper, but with minimal detail, and huge uncertainty about specifics and then how courts might interpret things, who really knows how much it will amount to.
Could the new Ministry of Regulation end up being a positive? Quite possibly (although we once hoped for that from the Productivity Commission), but conducting reviews – worthy as they may be – is different from getting a three-party Cabinet to agree on substantial material regulatory and legislative changes, and National in particular did not campaign for a mandate of major change. And it isn’t clear either that the parties have a clear idea as to what it would take to once-again be a world-matching economic performer, or that they are going to supported by an officialdom with the intellectual leadership etc to produce top-quality advice equal to the challenges.
As for housing, the parties have committed to keep in place the outgoing government’s “highly productive” land restrictions, which functionally have the effect of making it harder to get the sort of competition in land around cities that really could drive down house prices. On the positive side, “automatic approval for appropriately certified building materials from the US, Europe, the UK, and Australia”.
Some are lamenting the agreement to make the Medium Density Residential Standards voluntary. I’m not – as on their own they were never going to materially contribute to lowering house prices, and represented something of a central government overreach that never dealt at all with real externalities, even if some of those involved had good intentions (others – like too many councils – just had a vision of urban form they wanted to impose). I am sorry that the government did not pick up the idea of allowing easy localised (ie own group of properties only) opt-outs from the new rules, and is not doing anything about a presumptive right to build. Overall, in combination, and in combination with an immigration policy which seems to be even more “big NZ” than late Labour, it is a recipe for house prices in New Zealand to continue to be ruinously unaffordable for huge proportions of the population.
Oh, and National’s (very weak) NZS policy has been kicked for touch, so that there is not even a pretence of beginning to face the fiscal implications of the continually ageing population and growing life expectancy (themselves both good things), all of which might seem a trifle less bad if we were starting with fiscal surplus and very low debt, rather than with big fiscal deficits and debt levels rapidly converging on OECD medians.
Time will tell. But for now I’m not much more optimistic than I was before the election. There is a reasonably encouraging list of things to unwind (although many more things could have been added), but having done the unwinds little in the agreements suggests any sort of full-throated seriousness about actually reversing decades of economic failure or the scandal that is house prices in land-abundant New Zealand. I doubt we will even hear again that stuff about once again being a world economic leader: with such an unambitious forward agenda, and weak policy capability, the gap between rhetoric and reality would quickly just be too sad, inviting head-shaking and some derision.
But first a correction. As I noted on Twitter and very briefly on the post itself on Saturday, it seems that the gist of my post on Friday was wrong. The repeal of Labour’s tobacco de-nicotinisation legislation – whatever motivated the parties that championed the change – will leave the flow of tobacco excise revenue largely as it was, providing the government an extra flow of revenue – relative to what was allowed for in PREFU – that will, if anything, more than compensate for what National had told us they expected the foreign buyers’ tax would have raised. With the various other bits in the various coalition agreements they are probably back to being in roughly the – very demanding – fiscal situation National thought it would be facing before the election: large deficits, very demanding indicative operating allowances, and an aversion to cutting programmes/”entitlements”,
As for the impact of fiscal policy on aggregate demand, and thus the pressure on monetary policy, they’ve ended up – without really consciously trying, or so it seems, with a somewhat helpful policy switch; dumping the foreign buyers’ tax which was supposed to raise money from wealthy foreigners who mostly would not have been earning or otherwise spending that money in New Zealand (which revenue therefore would not have dampened demand) and replacing it with the reinstatement of the tobacco tax revenue scheme, mostly raising money from relatively low income New Zealanders who will, on average, have a very high marginal propensity to consume in New Zealand. Whatever the substantive merits (or otherwise) of either policy, all else equal the switch is slightly helpful for monetary policy.
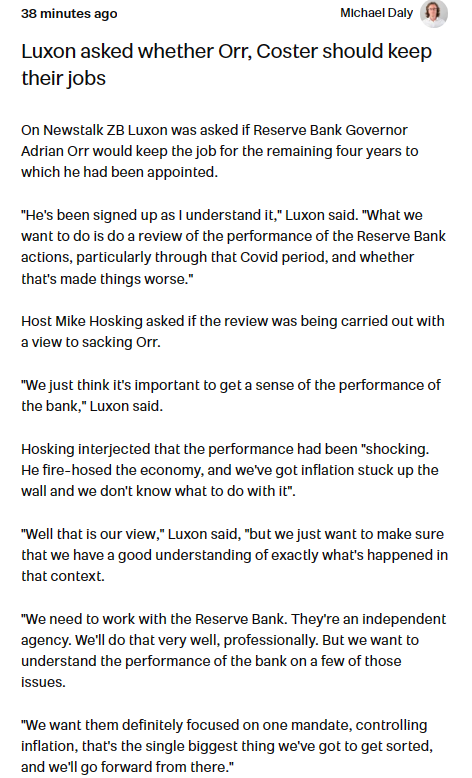
A few days after the election I wrote a post “What should be done about the Reserve Bank?” itself if (as I put it in that post) a new government is at all serious about a much better, and better governed and run, institution in future. Perhaps unsurprisingly I stand by all the points in that post, around both individuals (Orr, Quigley, external MPC members, and so on) and the institution.
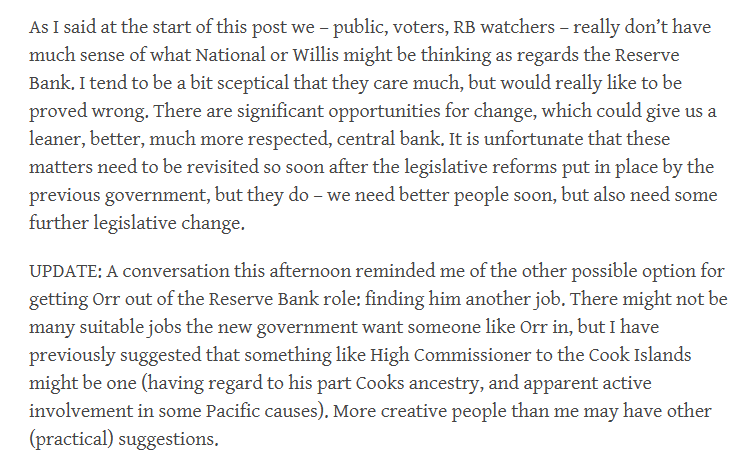
That post ended this way
That final paragraph was about the fact that unless he leaves more or less voluntarily it would be hard to get rid of Orr (judicial review risks etc and attendant market uncertainty) and yet it would be highly beneficial were he to be replaced well before March 2028.
Anyway, with the release on Friday of the two coalition agreements we know a little more re the options for the monetary policy functions of the Bank.
At a high level, both agreements commit the parties to make decisions that are “focused” to “drive meaningful improvements in core areas including
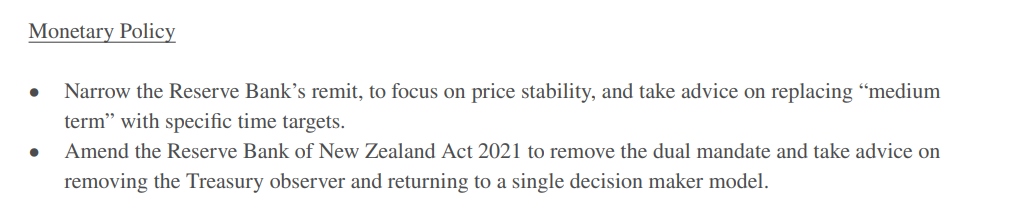
One might have briefly hoped that this might have resulted in the government lowering the inflation target to something actually consistent with price stability – eg, allowing for index biases, 0 to 2 per cent annual inflation – but it probably only means the abolition of the so-called dual mandate (something both National and ACT had campaigned). The specific material on monetary policy is from the ACT agreement
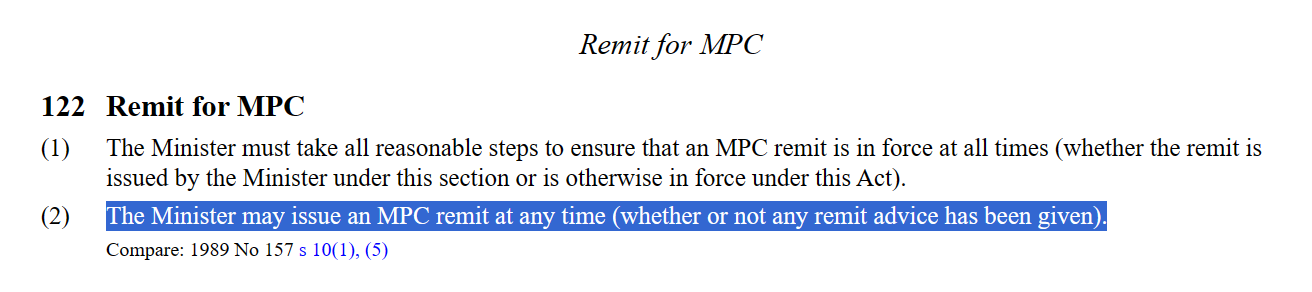
In National’s own 100 day plan the legislation to amend the statutory goal of monetary policy was to have been introduced – not passed – within the first 100 days, but in the coalition agreement there is no indication of the legislative priority. However, the Act makes it clear that the Minister of Finance could issue a new Remit – the actual targets the MPC is supposed to work to – at any time
It would be a simple matter of deleting one short paragraph from the Remit, which would then also have the appeal (to the government) of being clear that the MPC was working to this government’s Remit not the last government’s one. That doesn’t need to await the other advice, it could be done today or tomorrow (perhaps after the first Cabinet of the new government), and before the MPS on Wednesday. If the Minister moved that fast it would no doubt prompt specific questions at the MPS press conference, but…..they are going to be asked anyway. (UPDATE: The Minister is required to consult (but not necessarily have regard to the views of) the MPC before issuing a new Remit, so the next day or two probably isn’t an option, but it need not be an elongated process when the government has a clear electoral mandate for change.)
(To be clear, I am not a big fan of this change. I largely supported the 2018 legislative change. But……from the then-government’s perspective the change then was mostly about political product differentiation (essentially cosmetic) and so will the reversal be. Few serious observers think either change has made, or will make, any material difference to monetary policy decisions (and the Governor has repeatedly stated that it has not done so to now), but the change is – I guess – a way of signalling that the government recognises the public’s visceral distaste of high inflation and that it expects the Reserve Bank MPC to do so too (for the last two years there has been no sign of that).)
What about those other points on which advice is to be sought (presumably things ACT championed that National refused to agree to upfront, and may be disinclined to support at all)?
There are three of them:
replacing the “over the medium-term” time horizon for meeting the inflation target with some specific time targets (eg “over a rolling 18-24 month horizon” or somesuch),
removing the Secretary to the Treasury as an non-voting member of the MPC, and
returning to a single decisionmaker model for model (given the heading and context, presumably only for monetary policy, but perhaps more broadly).
I would not favour any of those changes.
The most marginal call – which wouldn’t excite me if it went the other way – is the position of the Secretary to the Treasury. I favoured the non-voting member provision in 2018 (it is a not-uncommon arrangement in other countries, and in Australia the Secretary to the Treasury is still a voting member), but there is no evidence from the four years of the MPC’s existence that the Secretary to the Treasury (or her alternate) has added any value (most often one of her deputies attends), whether around substance or process. The evidence we have also suggests a risk that the Bank and the Treasury are too close to each other, undermining the likelihood that the Treasury does its job – as the Minister’s adviser monitoring and holding to account the Bank – at all rigorously or well. How likely was it, for example, that there would be any serious accountability around the LSAP losses when the Secretary to the Treasury sat through all the meetings and there is no record of any ex ante concern being expressed? We also now know – from a recent OIA – that Treasury did nothing at all about the way they were lied to by the Reserve Bank Board chair as regards the earlier blackball on experts serving as external MPC members.
(More generally, if the new government is serious about a much better public sector they should be looking to replace the Secretary when her term expires next year, but this post is about the RB not the Treasury per se.)
I would not favour specific time targets for monetary policy. These were used in the early days of inflation targeting (when the first target was 0 to 2 per cent inflation by 1992), but once the target was achieved things reverted (sensibly in my view) to a model in which it was expected that inflation should (a) be kept within the target range, and (b) if there were deviations (headline or core), the Bank was expected to explain the deviation and explain how quickly it expected to get inflation back to target (either inside the band, or the target midpoint the MPC has been required to focus on since 2012).
It would not be advisable to put ex ante specific imposed timeframes on the MPC, mostly because shocks and deviations from target will differ. They may include, on the one hand, essentially mechanical things like GST changes (or other indirect tax or subsidy changes) which will appear in annual CPI inflation and, all else equal, automatically drop out 12 months later. But they will also include things like big – and perhaps sustained – supply shocks. You could think of a sequence of years in which – unexpectedly – the price of oil kept moving sharply higher (this happened in the 00s). A surge in petrol prices might take inflation above target. It is fine to require the MPC to bring inflation back 12 or 18 months hence, but if there is another surge six months on, you’ll end up with another overlapping target (the first having been deemed essentially redundant). And nine months later there might be a third surge.
Or we could – although let us fervently hope not – have a repeat of the last few years in which most everyone – RB, Treasury, outside forecasters – misunderstand and misjudges the severity of the pressures giving rise to the inflation, and thus the seriousness of the inflation problem. Back in November 2021 the Reserve Bank’s best professional opinion (presumably) reflected in their published forecasts was that inflation would have been back within the target range by March 2023 (a mere 18 months), with the OCR never having gone above about 2.5 per cent. Given a target to get inflation back in 12-18 months they’d have thought they were on course. That was wrong, of course, but the addition of a time-bound target wouldn’t have helped greatly with what was mainly a forecasting/understanding problem by then.
I do think there is reason to amend the remit. At present it does not really deal with mistakes like the last few years at all, stating just
which tends to treat all deviations are much like those resulting from GST or indirect tax changes, and never really envisages the need to correct serious policy failures (of the sort we’ve seen in the last few years). A provision that read something like “when the inflation rate moves outside the target range, or persistently well away from the target midpoint, the MPC shall explain (a) the reasons for these actual/forecasts deviations, and (b) the timeframe over which they expect inflation to return to around the target midpoint, and the reasons for that timeframe.” would be a useful addition. If the government was unwise to go down the “specific set time targets” path it would then need to allow for resetting/renegotiating such time targets when, as is inevitable, sustained shocks/mistakes happen. It was a model used in the very first (low-trust) Policy Targets Agreement, and was sensibly dropped a few months later in favour of the emphasis on transparent accounting.
The case for moving to a Monetary Policy Committee has been pretty compelling for decades (at least since Lars Svensson first recommended the shift in his 2001 review commissioned by the then-new Labour government) and it is to the credit of the 2017 to 2020 government that they finally made a change to a committee system. Not only is there no other area of public life (or politics) in New Zealand in which we delegate so much power – without appeal or review scope – to a single individual (Luxon himself can be ousted by his caucus with no notice), but hardly any other central bank anywhere operates a single decisionmaker system (the Bank of Canada is an exception in law – a legacy of old legislation – but they are at pains to stress that their senior management Governing Council functions as a collective decisionmaking body for monetary policy).
The right path now is not to strengthen the hand of the Governor – perhaps especially the current one if they are stuck with him – but to strengthen the Committee around whoever is Governor. It was quite disquieting to see ACT pushing for a return to the pre-2019 system. The old arguments about “we can sack one person not a whole board or committee” not only aren’t right generally (look at council, hospital boards, boards of trustees who’ve been replaced) but aren’t right in the specific context of monetary policy, and not only because in the face of the biggest monetary policy failure in decades no one lost their job, not even the person who was clearly most responsible (for the outcomes and the spin and misrepresentations around them). In practical terms, even if Orr could be removed shortly, it would be quite a punt in the dark to return to a single decisionmaker model, the more so when there is no single ideal candidate around whom people have united as “the” person to replace Orr.
Much better to focus on (a) replacing Orr as and when you can, b) reopening urgently the application process for the appointment of external MPC members to ensure that really strong candidates are appointed early next year (not those who got through the Robertson/Orr/Quigley RB winnowing process, selecting for people who won’t rock the boat, and have not rocked the boat in the last 3-4 years when things went so badly wrong at the Reserve Bank), and (c) amend the MPC charter etc to (a) require individual MPC members to record votes at each meeting, b) to require those votes to be published, c) to encourage external MPC members to give speeches/interviews, and d) to require FEC hearings for all MPC members before they take up their appointments. None of that requires statutory changes. It could usefully be backed
(There is course no guarantee that a better more-open MPC would have produced a less-bad set of inflation and LSAP outcomes this time – many other countries with better central banks have done pretty much as badly – but that is not a reason to simply settle for an inadequate status quo, one in which we never hear from most of these powerful officials, there seems to be no effective accountability, all supported by little or no serious research, analysis or insight.)
UPDATE: I meant to include this (from Stuff this morning), and now include it mostly for the record. As I said in my earlier post, there is no great harm in the independent review (of monetary policy under Covid) that they are talking of, but it also isn’t clear what is to be gained (and much will depend on who is appointed to do it). The failings of the RB in recent years are pretty well-understood, and the institution commands little respect now. If change is to be made, just get on and start now.
You’ll remember during the election campaign how National (Willis and Luxon) repeatedly told us that their fiscal plans (notably the Back Pocket Boost giveaway plan) was fully funded. Whenever doubts were raised about the foreign buyers’ tax revenue estimates National (a) asserted full confidence in their numbers, and b) reiterated that their plan was…..fully funded. The pretty clear implication – one might even be able to find specific quotes – was that if by some chance the revenue from that tax fell short they’d make it up elsewhere.
National’s fiscal plan – with the foreign buyer tax – was already some mix of ambitious and unambitious. Unambitious in that by 2027/28 (beyond the next election) National envisaged net debt at 0.7 percentage points lower than Labour’s plan, which had been captured in the PREFU numbers. The operating balance, having been in deficit for years (with no good economic basis for deficits) also wasn’t to return to surplus until 2026/27. “Ambitious” in the sense that National promised to do all this – closing a large structural fiscal deficit – without cutting any specific programmes, but with promises that fat would be squeezed out of the public sector. Like Labour’s fiscal plan there was a considerable element about it of “we’ll draw a line on a chart, and then just ask you to trust us that we might deliver”. Alternatively, as the target date for a surplus drew closer it might be pushed out further, as Labour in government has now done a couple of times.
You will recall that Labour has left a large fiscal deficit. On the New Zealand operating balance measure, a deficit this year of 2.7 per cent of GDP (in an economy more or less fully employed), while on the IMF’s internationally comparable metrics, a deficit among the very largest among advanced economies (all having nothing to do with the pandemic, the heavy spending on which was in 2020 and 2021).
Today we got the two coalition agreements. There aren’t any specific fiscal numbers in those documents, but there are policy commitments that all three parties are pledged to support.
To no one’s great surprise, once it was clear NZ First was going to be in the mix, the foreign buyers’ tax is not proceeding (and so unless some researcher with IDI access gets curious – about the detailed pattern of foreign purchases pre-ban) we may never know whether National’s revenue numbers were ever plausible), and with it $750m per annum of promised revenue has gone.
In my post last week I speculated that perhaps National might look to cover this by delaying a few of their promised giveaways a bit, and at least kicking the shortfall a year down the road. Instead, promises of fully funding the giveaways were scrapped along with the proposed foreign buyers tax.
In fact, not only did they not delay any of their giveaways but the restoration of interest deductibility (a good policy) is being done a little faster than National had promised, costing a bit more over the four years than National had allowed for. Not mentioned was the point some critics made pre-election that the deductibility costings had been done in a climate of low interest rates, such that at least over the next few years the cost of restoring deductibility will be a bit more than the National costings had allowed for.
Oh, and the agreement with NZ First allows for an extra $1.2 billion of regional development capital expenditure. That won’t count against the operating balance – at least until depreciation cuts in – but it is all debt, and NZ First last term didn’t have a great track record for high quality regional development spending. It is likely to be much more akin to extra public consumption (one reason why those IMF and OECD fiscal balance measures don’t use an operating balance concept – when governments are spending the money the distinction between operating expenditure and capex often tends to be hazy).
If one wants to look on the bright side of things, there is agreement to shift the tertiary fees-free policy from first year fees to third year fees. That seems pretty daft in terms of any substantive case for the policy – presumably about helping encourage people into tertiary education (which it hasn’t done) – but it does have the one-off fiscal advantage that it should mean no outlays in 2025 and 2026 before normal service resumes in the 2027 academic year. The optimist in me wonders if having operated for two years with no outlays, Cabinet in 2026 might decide to just scrap fees-free altogether but….that will be the election year budget. [UPDATE: paying fees-free for the third year will be cheaper, on account of students who don’t complete, but that just highlights the absurdity of the policy – rewarding those on the cusp of the higher incomes qualifications usually bring.]
A point I’ve made all along is that none of these sorts of things individually amount to much macroeconomically. The foreign buyers tax, for example, was supposed to raise less than 0.2% of GDP in annual tax revenue, but that comes on top of an already large structural deficit for which the parties had no clear or explicit plans for closing. A 2.7 per cent deficit becomes a 2.9 per cent deficit. A large fiscal hole bequeathed by Labour is dug a bit deeper by today’s announcement, making climbing out of that hole all the more challenging (especially if programmes aren’t to be cut). There would seem to be now next to no hope of the fiscal drag tax bracket adjustments in 2026/27.
And it is not as if this is all the potential slippage.
I looked through the ACT agreement and found these items:
a promise to consider sharing a portion of GST collected on new residential builds with councils. The same revenue can’t be spent twice, and
“explore further options to increase school choice and expand access to integrated and independent schools including reviewing the indepedent school funding formula to reflect student numbers”
And in the NZ First agreement:
Fund Gumboot Friday $6 million per annum
Look to increase funding of St John
Ensure Plunket is funded to do their job properly
Investigate the funding formula for new residential care beds
Look at asset thresholds for aged care
Work towards a bipartisan agreement on funding care and dementia beds
Upgrade the Super Gold Card
Some of those are more specific than others, and several may go nowhere. It also isn’t as if it could ever realistically have been expected that there would be no new spending initiatives even within the tight planned operating allowances. But, the pressures for nice shiny new stuff are going to be very real…..in a government that launched itself today by widening the structural fiscal deficit.
I was critical of National during the campaign for not making more of the fiscal deficits, a legacy of a succession of expansionary budgets by Labour even after the pandemic spending period had passed. But one might have hoped that they (Luxon/Willis) would at least hold the line on the starting point – to coalition parties if you insist on some revenue things not proceeding, additional savings need to be found, not in the never never land of successive budgets, but now.
But no.
Perhaps the deal is good politics – not for me to say – but it is unfortunate macroeconomic management policy, and is likely to further dent Willis’s reputation before she has even formally taken office. Robertson gathered a reputation as a Minister of Finance who was reluctant to say no. We really don’t need a successor like that.
It all puts a heightened pressure on Willis in her micro-budget before Christmas to start laying out some credible specifics as to how the large deficits are to be closed. There are limits to what she will be able to do in 3-4 weeks, but simply drawing lines on a graph again shouldn’t cut it (remember those Treasury cautions on even Labour’s numbers, and the task has just gotten bigger today). ACT had talked up the abolition of various government agencies, but it seems the coalition deals ruled that out – the Productivity Commission goes but the money just goes to fund a new public sector agency (whose effectiveness we can only guess at, but have to hope lasts longer than that of the PC), and the Maori Health Authority goes (as National always promised) but the cost of that just gets transferred into the main health votes. Willis and her leader in particular should face serious scrutiny about just how serious they are about sustained fiscal discipline.
It was always one of the worst things of Labour’s voluntary lurch to large deficits in the last year or two. Once the commitment to a firm focus on balanced budgets was sacrificed by one main party – voluntarily running larger deficits when times (revenue-wise) are good – it provides cover for the other lot. What’s another year they will each ask themselves.
Defenders of National will no doubt say “that’s MMP”, but I think it is fairer to say something like “that is what you get when the putative next PM and Minister of Finance don’t campaign hard on the unacceptable starting point of some of the largest deficits in the advanced world”. If they aren’t too bothered, why would their coalition partners be?
UPDATE (Sat): Realised that the discussion above does not allow for the fiscal effects of the change in tobacco policy. Those changes look as though they will avoid the large drop in tobacco excise revenue that was otherwise expected (and which was allowed for both in PREFU and by implication in National’s fiscal plan). The amounts involved are large and may well cover the gap opened by the absence of the foreign buyers tax.
Opening The Post on Monday morning it was as if the 2026 election campaign had gotten underway already, even as we sit waiting for the new government to form.
Under the headline “An answer to National’s revenue gap” was a column by the CTU economist, and former Grant Robertson adviser, Craig Renney suggesting that National should scrap most everything it campaigned on and adopt instead a left-wing tax policy approach that was not acceptable even to the Hipkins Labour Party this year. But then we learned last week that Labour itself was putting all revenue options back on the table as it thinks about its own future. One media profile last year suggested that Renney is keen on getting into Parliament, and to be fair you’d have to acknowledge that he was a more high profile, perhaps even effective, campaigner this year than most Cabinet ministers.
Anyway, Renney’s idea is that we should look to the United Nations for guidance on tax policy (why?). Some United Nations report apparently mentions windfall profits taxes, and the number of them introduced in various European countries last year and this.
Renney quotes this UN report saying “several developed countries introduced taxes aimed at ensuring a fair distribution of profits in industries that have experienced significant gains because of the pandemic and financing recovery programmes, or subsidies for energy consumers”.
And then he leaps into claiming the relevance of this to New Zealand. Where does he start? With, of all companies, Air New Zealand (“Last year, Air New Zealand’s profit was up 180%.”)
We are seriously supposed to believe that Air New Zealand experienced significant gains because of the pandemic? The company that only survived on government handouts and recapitalisations after its business dropped away very very sharply, through the mix of closed borders and individual reluctance to travel? The company that lost $454 million in the year to June 2020, lost $289 million in the year to June 2021, and lost $591 million in the year to June 2022, before recovering to make $412 milllion in the year to June 2023. Shareholders – the largest of which is the government itself – simply lost truckloads of money from owning an airline through a pandemic. As you might expect. But Renney apparently thinks them a serious candidate for a windfall profits tax….
Another extraordinary feature of his article is that as he talks up European governments imposing windfall profits taxes he never once mentions that the overwhelming bulk of such taxes were imposed on fuel companies in the wake of the sanctions the EU (and a bunch of other countries) put on Russian gas and oil exports after the invasion of Ukraine, which had the effect of driving European gas prices, and thus marginal wholesale power prices sky high. There is perhaps a certain logic in governments that make a product artificially scarce (in pursuit of admirable geopolitical ends) also taxing what might be genuinely windfall gains. One might haggle over how such taxes were imposed etc (there is good reason to think many were ill-designed if they were really supposed to be windfall taxes), but the basic idea isn’t prima facie absurd.
(If you want an accessible summary of what the Europeans have been doing, try this recent report.)
But……New Zealand wasn’t directly affected by those sky-high gas prices (one reason why headline here never went as high as it did in many European countries, including the UK). It doesn’t stop Renney of course (writing of New Zealand, “the top four energy companies made $2.7 billion in operating profits, or $7.4 milllion profit per day”, without any sense of context or scale (return on equity eg) or any sense at all of there being anything ‘windfall’ at all about those profits).
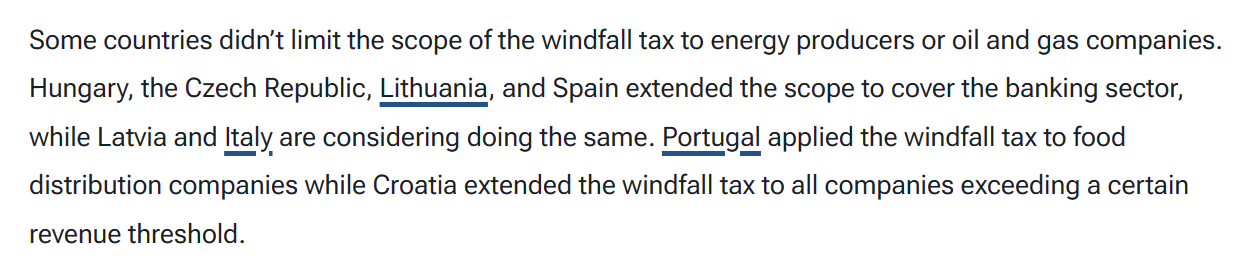
How wide-ranging are those European taxes?
Renney tries to tell us that “globally, these taxes were aimed at……markets where there is little competition (such as supermarkets)”, but in fact that seems to be a sample of one country with a tax on supermarket-type entities (itself done in a distortionary manner to apply only to big companies), in one of Europe’s less-than-stellar economies. As that clip above says, Croatia introduced one (not really focused on true “windfalls” at all), imposed for a single year on all big companies (200 or so). Much of the focus of these measures was to pay for big consumer energy subsidies, in the face of that same energy price shock induced by the sanctions. None of which has any relevance to New Zealand, or to any sort of medium-term revenue strategy. And we know people think New Zealand supermarkets make “too much” money, but whatever the merits of that argument it has nothing to do with any serious analysis of a case for windfall profits taxes. (As it happens, I thought there might have been an arguable in-principle case in respect of the profits supermarkets were given by the government when it forced almost all other food retailers to close during lockdowns, channelling all business to the supermarkets………but I guess that rather arbitrary distortion was done on Renney’s own watch as adviser to the Minister of Finance.)
Ah, but then there are the banks, bete noire of the New Zealand left (whether they really dislike the banks or simply find them a convenient populist whipping boy is never quite clear). As that clip above noted, a handful of European countries had imposed “windfall” profits taxes on banks (whatever Italy was first proposing was substantially watered down). I didn’t look up all those cases, but I had a look at Hungary – a government that of course the left usually looks utterly askance at – where the so-called windfall profits tax isn’t even based on profits, or any credible sense of identifiable windfall – it is just a crude tax grab based on revenue (not profits) and this year was sharply modified through further financial repression – banks could avoid much of the tax if only they bought more government bonds.
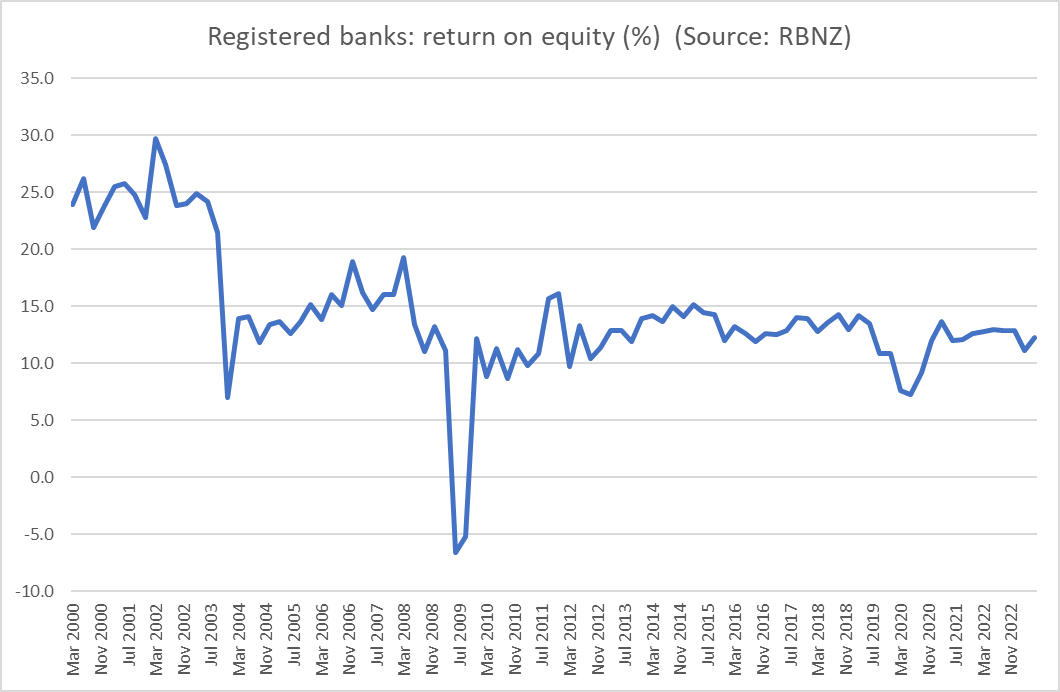
But what of New Zealand and the banks operating here? We know Renney’s old boss the (still) Minister of Finance got tantalised a year ago by the idea, before being eventually talked out of it.
And as for the data
there is simply no evidence of a pandemic or post-pandemic windfall for banks. If anything, return on equity has been trending downwards (as you’d expect in the face of higher capital ratios), and if you really think there are important barriers to entry etc, tackle those directly. Your party was, after all, the government for the last six years.
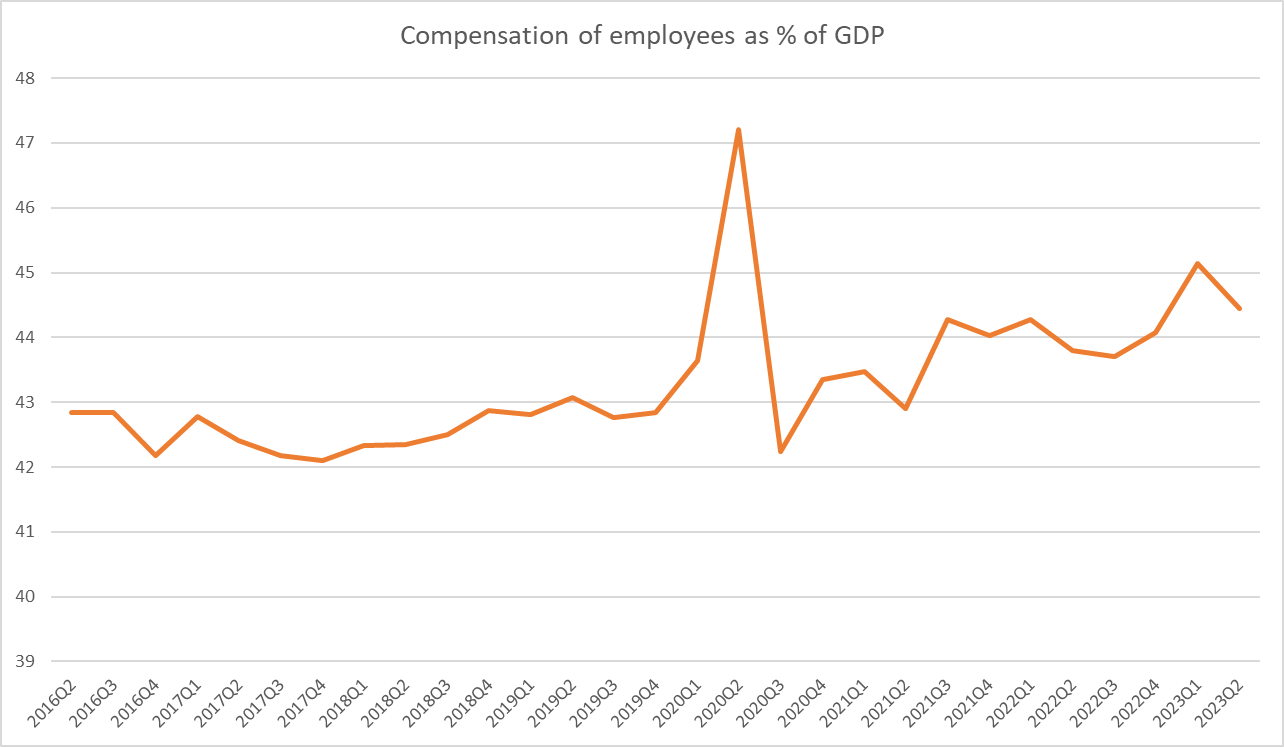
As for those rapacious businesses more generally……well, workers have had an increased share of GDP over the last couple of years (as you might expect in an badly overheated labour market).
Renney goes on to claim “perhaps the most compelling case for their use comes from the fact that many of the countries that have launched windfall taxes now have lower levels of inflation than New Zealand”. That isn’t even a serious attempt at economic or policy analysis (let alone something warranting “the most compelling case”, unless Renney is conceding that the actual substantive case is threadbare). Of course, if you use big direct subsidies to consumers you can lower headline inflation – Renney’s Labour government did that for a year with the petrol excise tax cut, without even suggesting a way to pay for that largesse – and many of these European so-called windfall taxes have been mostly about financing such subsidies. What matters macroeconomically is much more about measures of core inflation.
We could check out some of those countries that did more than just energy taxes, except that almost all of them are in the euro, where monetary policy is set for the region as a whole (Germany by far the biggest economy). And of the two that aren’t, Hungary had core inflation in the year to September of 12.8 per cent and the Czech Republic had 7.1 per cent core inflation in the same period.
In his final paragraph, Renney comes back to the banks – the honeypot the left keeps eyeing up. There he writes that “I’m confident that the current chairs of the big four banks wouldn’t mind a phone call from the incoming prime minister asking for their cash.” Perhaps that is supposed to be a dig at the overly close relationship between the incoming PM and the chair of the New Zealand ANZ subsidiary, but I think it is pretty safe to say that all the chairs (and the CEs) would tell the PM that they’d pay what the law demands, not a penny more or a penny less (the approach most of us take), and if somehow they were personally inclined to be more generous, they’d no doubt find their parent boards in Sydney and Melbourne, let alone shareholders around the world, not exactly impressed at scheme to give away shareholders’ money. Such a chair might not, and probably should not, last long.
What is quite extraordinary in the whole column is that there is not even a hint (and sure there are word limits, but you can squeeze in hints about things that might really matter) that we already have one of the highest company tax rates in the advanced world, and have historically had low rates of business investment. Arbitrary extra business taxes – with not a even a hint of symmetry (windfall refunds/handouts in tough times) – are not exactly a standard feature of prescriptions for prosperity. But then in six years in government (in three of which Renney was the key adviser to the Minister of Finance), Labour showed little or no interest in lifting productivity or longer term economic performance, just in redistributing the pie differently and channelling a larger share of GDP through the government’s book, often not even funded by tax revenue. Renney’s prescription boils down to the new National-led government doing more of the same. Low as my expectations of that government are, at least on Renney’s specific schemes (lots more business taxes, lots more subsidies) I don’t worry too much.
Every three months or so the hard copy Herald comes with a hefty supplement, the OneRoof Property Report. Yesterday was the latest such supplement. I skip straight to the detailed tables at the back which report, at suburb and district council level, the numbers from the OneRoof-Valocity House Value Index. It is a measure of average (not median) prices, draws on “a range of sources, including settled sales data” and is described as “based on a composite of statistical models and are fully stratified”. The numbers are up to the end of October.
What caught my eye when flicking through the tables was that they had not just percentage changes for the most recent quarter and year, but also enabled comparisons to pre-Covid levels and to the Covid-era peaks.
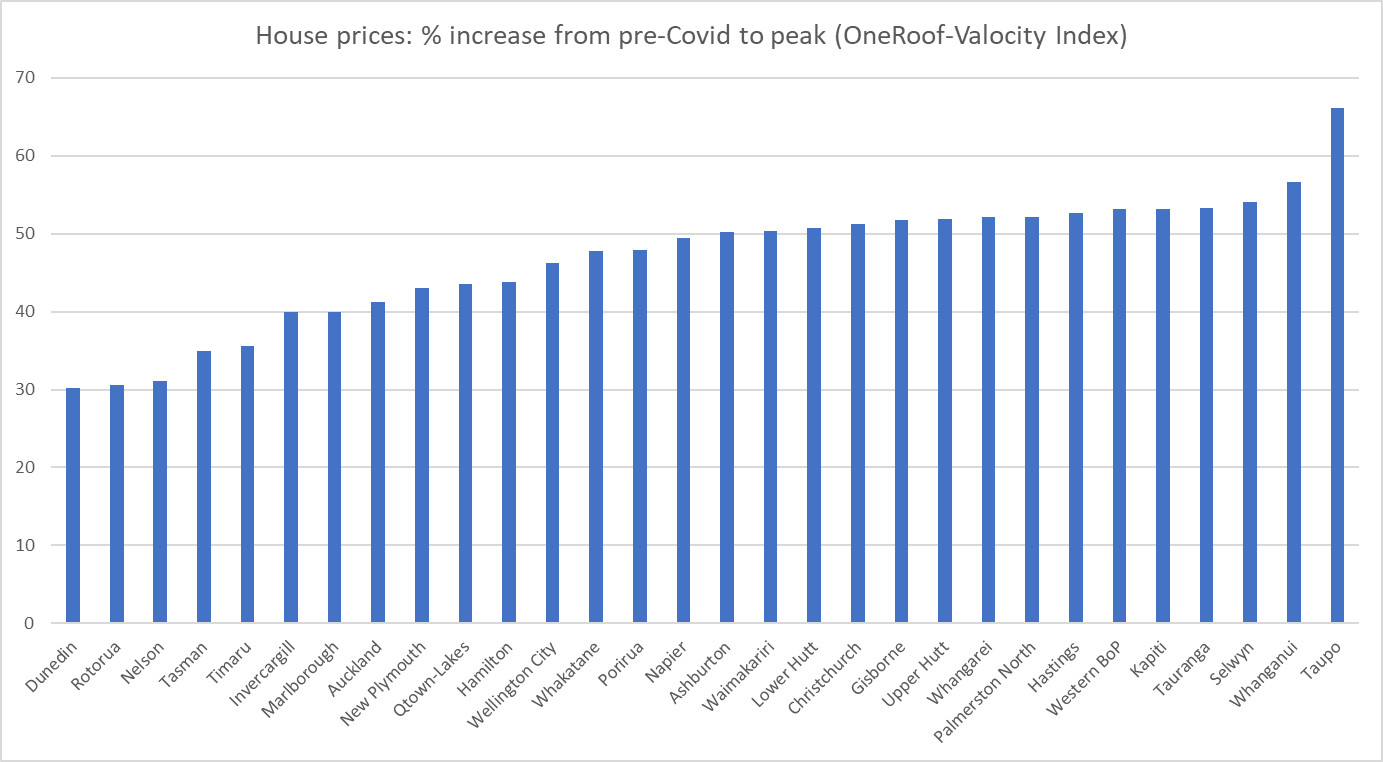
First, a reminder of that extraordinary period (mostly in late 2020 and 2021) when house prices rose sharply almost everywhere. Since I was having to do all these percentage changes manually I mostly only did the larger population places.
They really were staggering changes. There are a few surprises – I’m at a loss to know why the increase in average prices was materially larger in Taupo than anywhere else – but it is probably more striking just how consistently huge the price increases were, between 40 and 55 per cent, often in little more than a year.
Prices have generally fallen back from those peaks (except in Timaru where the latest observation is also the peak).
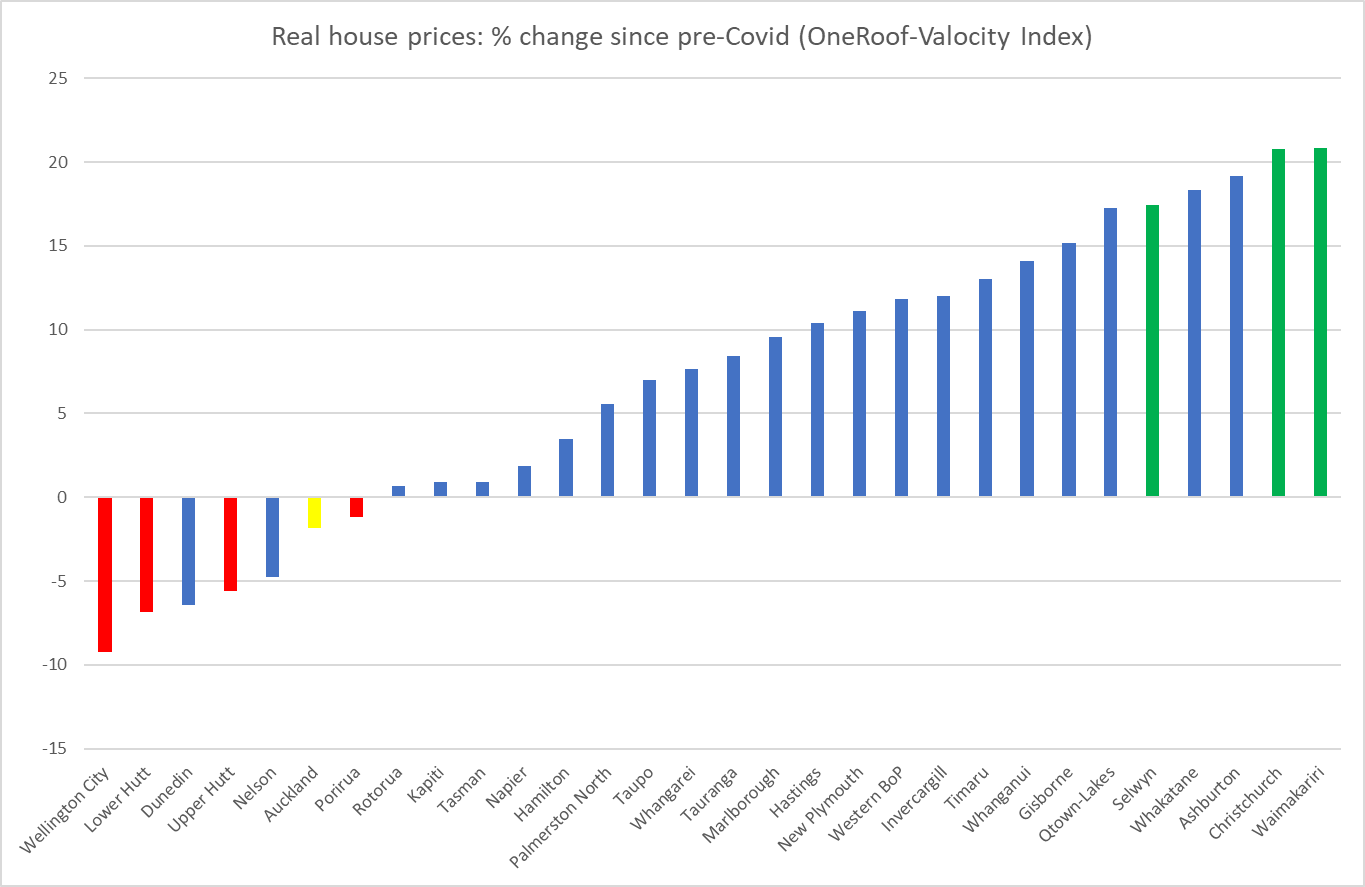
But what I was more interested in was where prices were now in real (inflation-adjusted) terms relative to those just prior to Covid. That’s this chart (with the Wellington districts highlighted in red, the Christchurch ones in green, and the mega-region Auckland shown in yellow).
There are really big differences across towns and cities in just a (bit under) four-year period, and no particular bunching around some typical rate of increase (decrease), even bearing in mind that a third of the population is in Auckland.
The dominant story of the 2020/21 increase in house prices seemed to be the toxic combination of extremely low interest rates in a fully-employed and overheating economy in the presence of supply constraints on bringing new residential land and houses to market (all despite an unexpected negative population shock). That story makes a lot of sense, including in the contrast to the 2008/09 recession when much larger cuts in interest rates went hand in hand with lower nominal house prices (there were big negative output and unemployment gaps opening up then).
But as we emerge through the other side of the entire Covid period, it is less clear what explains the divergent pattern of real house price changes over the full period. A non-trivial part of any story about the overall market must be interest rates – the OCR was 1 per cent just prior to Covid and is 5.5 per cent now (with implications for all the retail rates) – but we have an integrated financial market and thus the same interest rates (and tax rates for that matter) in Wellington as in Christchurch.
Supporters of the incoming government might note that Wellington house prices have fallen most in real terms and point out that the prospects of reduced public service numbers might be playing a part. Except that over most of four years public service numbers were rising, often quite strongly, and over the latest three months, when a victory for a National-led government came to seem much more certain, Wellington house prices haven’t done anything materially different than those in Auckland (both up a couple of per cent).
Models which emphasise the importance of supply constraints, land-use restrictions etc (models I champion) suggest that for any given state of economic activity and resource pressure, one should expect to see more responsiveness of house prices to interest rate changes the more binding the supply constraints are. It is an appealing story for Wellington (especially Wellington city) – interest rates have risen a long way- but whether it is really the main explanation would take much more systematic analysis (including trying to take account of the bipartisan limited land use reform legislative change in 2021, and expectations that a new government will alter those measures). But it is hardly as if Christchurch is some paragon of liberal land use.
Perhaps too there is some convergence at work. After all, even now Christchurch house prices are far below those in Auckland, and non-trivially lower than those in Wellington, and people are potentially mobile within New Zealand, especially when the labour market is buoyant.
I don’t purport to have a fully convincing story. The point of the post was mostly just to put the chart out there. And to note that despite the large and rapid increase in interest rates (nominal, but increasingly real too, going by any plausible measure of inflation expectations) real house prices in most of the country are at best basically unchanged from the end of 2019 (in Auckland’s case) or are materially higher than they were then.
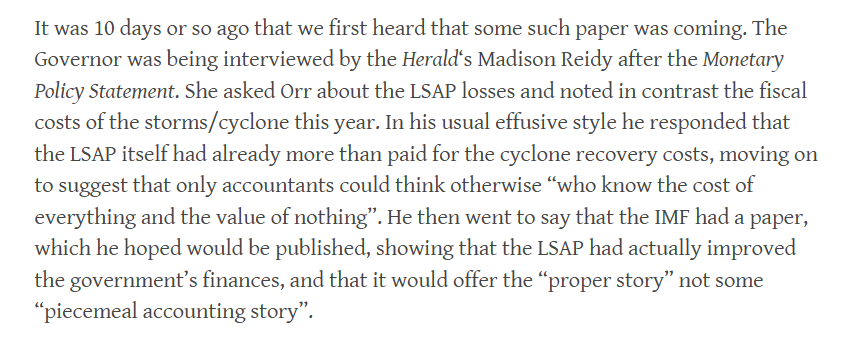
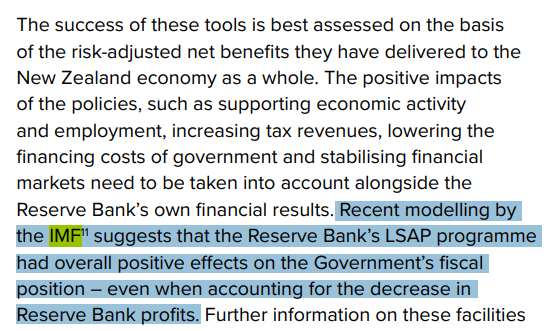
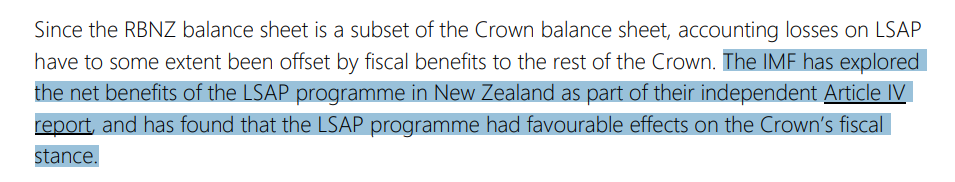
It was in mid-August that this particular bit of shameless Reserve Bank spin got going. From a post in late August
It proved to be nonsense of course. Once we had access to the short little IMF piece, published at the back of the Fund’s Article IV review, it was clear that it all amounted to a case of “if you assume big beneficial economic effects from the LSAP, then you get material tax revenue gains”, which might be set against the actual losses on the trade.
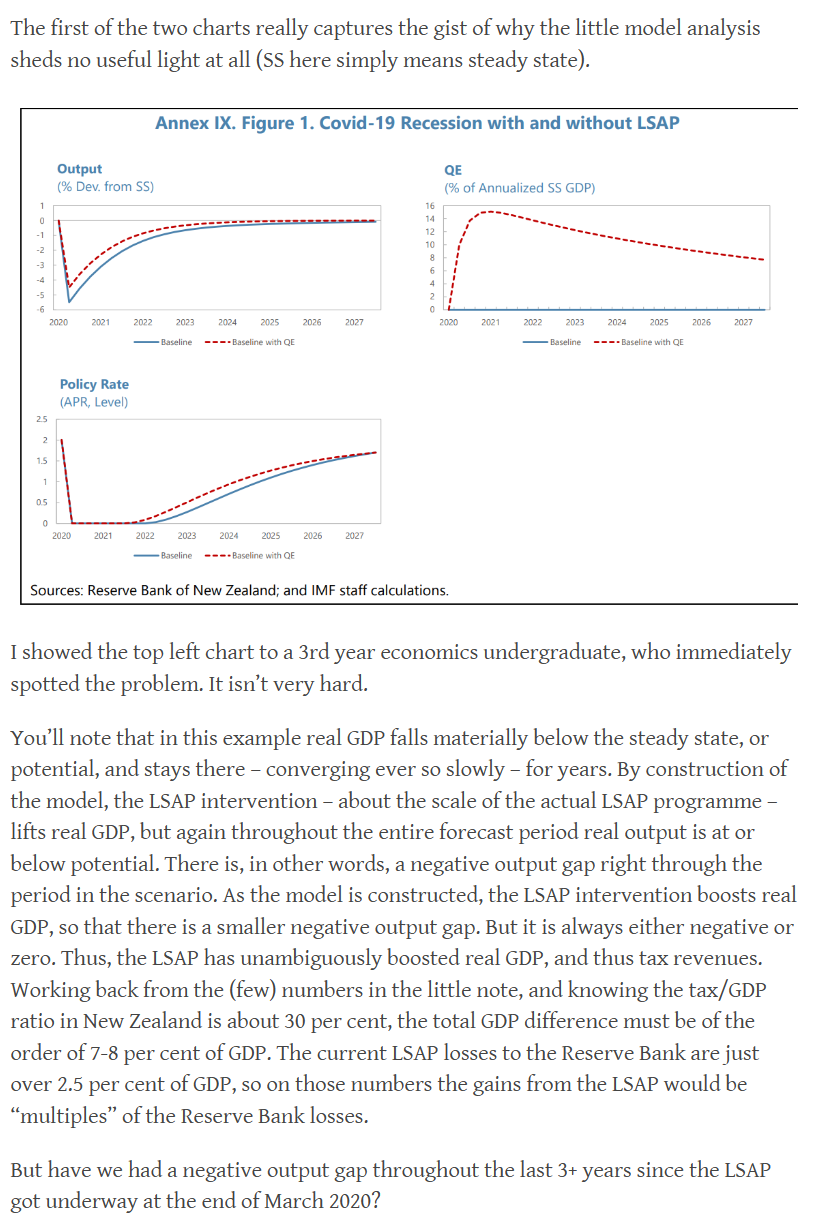
But the IMF’s picture bore not the slightest relationship to New Zealand reality through the LSAP period.
But none of that stops the Bank.
Here was their Annual Report, which will have been signed off by the Bank’s Board – the ones with little or no subject expertise.
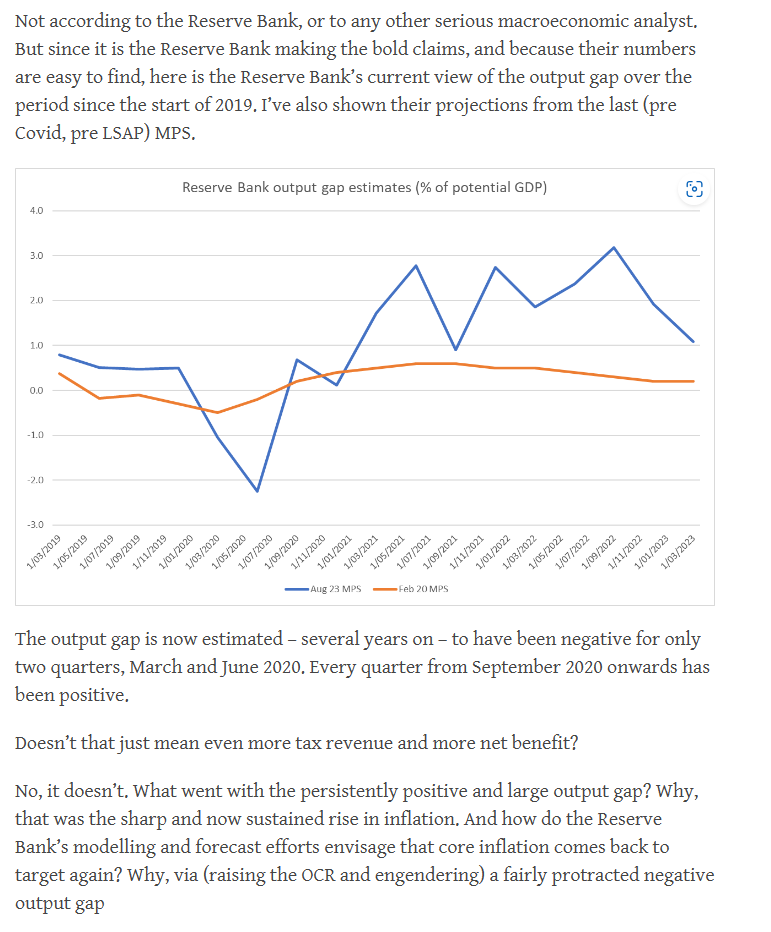
And then this week their deputy chief executive responsible for monetary policy and markets – the one with no subject expertise at all – was at it in a speech given to investors etc in Sydney.
Now I have not seen any analyst endorse that little IMF exercise. And you can sort of tell that even the Bank knows it is shonky (but convenient). Note that both in the Annual Report and Silk’s speech they are careful not themselves to claim that the LSAP was profitable for the taxpayer, just to report (what is factually accurate) that the IMF – or at least a couple of back office researchers, given a couple of hours to play with a toy model – said it was. Silk herself only claims that the losses (they aren’t just “accounting losses” but real ones for taxpayers) are offset “to some extent” by other fiscal benefits to the Crown (and there might be even some very slight extent to which that is so, but it is by no means guaranteed). And the Annual Report text takes a similar approach – citing the IMF, without actually endorsing its work, but leading the casual reader to assume they did. The Bank knows better and simply choose egregious spin – the sort of dishonesty we might have got used to from politicians, but shouldn’t have to put up with from independent technocrats.
But here we are dealing with Quigley and Orr, who know better but seem to have a tenuous relationship with truth and serious analysis whenever something otherwise suits. And Silk, who may know no better – but can surely read, if she were at all curious – who is the senior manager with overall responsibility for the Bank’s macro and monetary policy analysis.
None of them should be in their roles (Silk should simply never have been appointed to hers). But will the new government care enough to do anything about this situation, or will spin and dishonesty continue to characterise our central bank, while those with the power to do anything about the situation get on with simply holding office?
I did a couple of media interviews this morning on the fiscal challenges facing the new government if, as seems likely from other reports, the foreign buyers tax promised by National can’t be got across the line when the agreements with ACT and New Zealand First are reached. Preparing for those prompted me to refresh my memory of a few of the relevant numbers.
There are several relevant points:
if the work I was part of before the election was roughly right (and we may never know if the tax is indeed stillborn), the fiscal challenges with the tax would not have been a lot less than they will be without it. National’s costings assumed revenue of about $735m a year, and our work (and the experiences in places like Vancouver) suggested that something not much above $200m was more likely.
since total government revenue this year is forecast to be $134bn and GDP to be $417bn, the estimated annual revenue from the foreign buyers tax (on National’s own numbers) was always fairly modest in macroeconomic terms (under 0.2 per cent of GDP, when the fiscal deficit this year is forecast by The Treasury to be 2.7 per cent of GDP).
National, like Labour, has suggested it will deliver operating balance surpluses from 2026/27, without being at all specific as to how they would get from here to there (structural deficits do not simply fix themselves), and was inclined during the campaign to play down the severity of the deficit, in favour of an emphasis (like Labour’s) on new shiny baubles to lure in the voters. These two charts (using the recent IMF numbers for comparison) were from a post the day before the election.
All of which is to say that there were pressing fiscal challenges whether or not the foreign buyers tax went ahead, and the scale of those challenges isn’t much changed if it can’t be proceeded with. There might be a larger political challenge – remember the emphasis National put on everything being fully-costed and funded – but then again in MMP any pre-election programme is to some extent only an opening bid in post-election government-formation discussions.
This is the summary table from National’s fiscal plan document.
You’ll see that in the first full year (24/25) the plan envisaged being modestly net positive fiscally (that $537m in the bottom line), mostly because the promised interest deductibility changes would be phased in.
So the new government – or National more specifically- could just argue that for the first year anyway the loss of the foreign buyers tax still left their numbers for that year – the next year’s Budget – looking okay (lose $700m, but they already have a margin of $500m). And if they wanted to change tack and accept that argument I and others had made that the foreign buyers tax revenue wasn’t going to be disinflationary (since it was mostly coming from people outside the economy, so wasn’t reducing domestic private spending) they could even argue that scrapping it wouldn’t materially complicate the fight against inflation.
Or they could delay/rephase any of a number of the other specific items in that table. Delay the income tax cuts by a quarter and you save $500m in the first year, and push back the interest deductibility changes and childcare subsidies by a year and you save another $500m in the first year (perhaps a little more to the extent interest rates are a bit higher now than was allowed for in the costings). Rejigging the first year on the table – 24/25 – really isn’t a particular problem (at least if the foreign buyers tax were the only material change to National’s plan).
But it would further increase the challenges – which will already be severe – on both the 2024 and 2025 Budgets, which will mainly determine whether there is a serious chance that in election year 2026 the Minister of Finance will be able to produce a budget that year with a credible prospect of an operating surplus for 2026/27. It isn’t impossible that the extent of the increased pressure might be small – there are several more rounds of Treasury fiscal and economic forecasts to come (including one next month) and the outlook could be a little less unfavourable than it has been (although things could go the other way too) – but it wouldn’t be a promising start after the last few years of fiscal incontinence.
One way of covering any gap over time is, of course, fiscal drag. Recall that National was very non-committal on future adjustments to tax brackets for inflation.
The more government formation locks in fiscal pressures now the less likely any future band adjustments become.
My bottom line in all this is that on its own the loss of the foreign buyers tax isn’t critical or determinative, but it should simply sharpen the focus on the key questions that were there all along even just on National’s own programme: are they willing and able to make hard choices across successive budgets to get the government accounts back to surplus, and can they do it (as they promised, with all the options they ruled out) without cutting into programmes, or taking some of their own promises off the table. I’m somewhat sceptical – and there are some easy, low-value, programmes they should not have committed to keep (eg fees-free, winter energy payments, Kiwisaver subsidies) – but at present we really don’t have a lot to go on (eg all the attention has been on a possible NZ First win around the foreign buyers tax, and not at all on what ACT might succeed in securing). But National might have been on stronger ground had it spent more time in the campaign highlighting the fiscal mess Labour was leaving and less on shiny new baubles it was offering.
2.5 months ago, when National’s Back Pocket Boost plan was released I made a quick comment on Twitter that promising tax cuts in the current climate was almost a definition of fiscal irresponsibility. The deficits they’ve inherited aren’t National’s fault but they will very shortly be its responsibility (shared with partners, but National is the biggest party and Willis is to be the Minister of Finance), and the focus should have been first on closing those structural deficits, not on upfront tax cuts and vapourware commitments to surplus one day, but not yet.
In this morning’s edition The Post has a double-page article about what Nicola Willis might be like as Minister of Finance. Those of my comments that were included are here
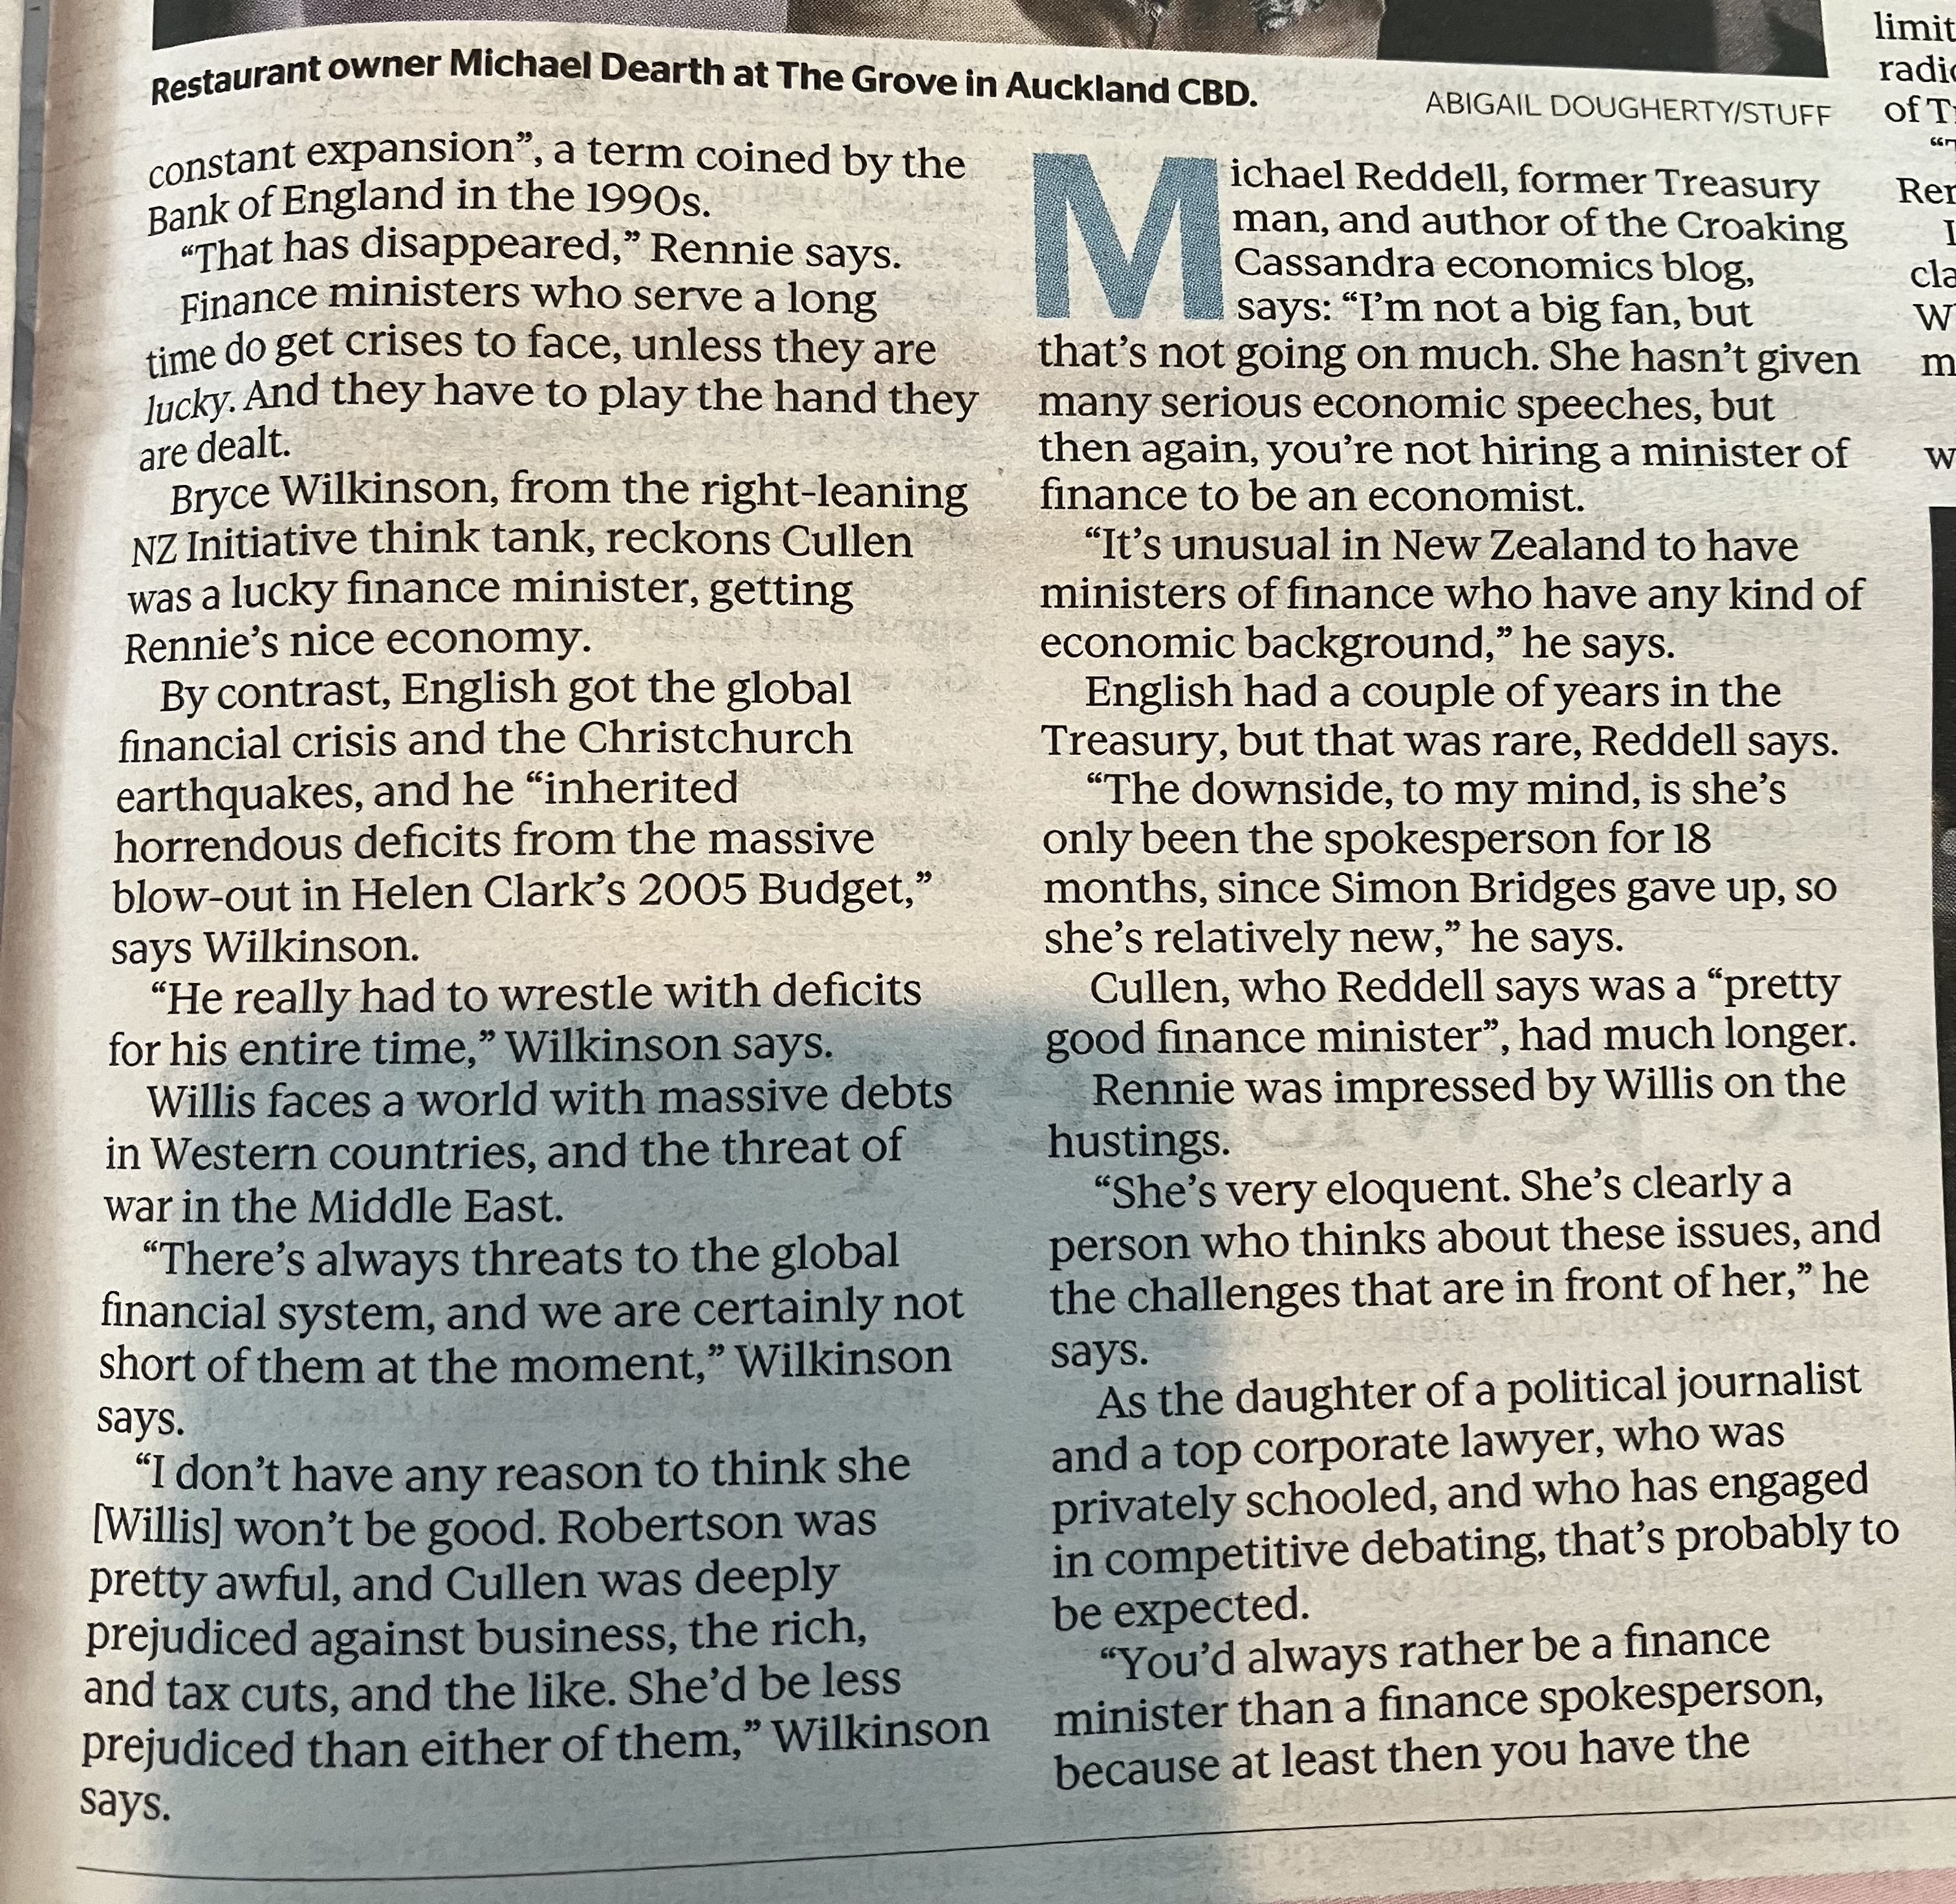
My bottom line was actually very similar to that of CTU economist, Labour champion, and former political adviser to Grant Robertson who was quoted as saying that only time will tell whether Willis makes a good finance minister, specifically “you don’t master these things overnight”. That said, I was a bit less impressed by the one campaign event I saw her at (the Stuff finance debate). I’m anything but a fan of Robertson – I think he ends up having been the worst Minister of Finance New Zealand has had in the post-liberalisation decades – but I thought Robertson had the better of her. Despite the government’s poor economic record and Willis’s apparent past debating prowess, perhaps 9 years’ experience as Labour’s finance person counted?
Willis comes to the job with relatively limited experience in the portfolio. Contrast her 18 months as the spokesperson with the 9 years Michael Cullen had before taking office (having sat in Cabinet for three years before that), or the similar background Bill English had had by 2008 (he hadn’t been spokesman for that long, but had briefly held a finance portfolio late in the previous National government). David Caygill and Steven Joyce both came to the job late in their respective governments’ terms, having served as senior economic ministers for years previously. Willis’s record is perhaps closest to that of Grant Robertson (neither had an economics background, and Robertson had had only 3 years as opposition finance spokesman). Neither has ever run anything much previously either, so again there isn’t a great deal to go on.
One might think of three aspects of the role of Minister of Finance:
senior political operator and parliamentary figure,
manager of the government’s finances,
lead figure in overall economic strategy.
The first of those isn’t really my territory. But it was probably where Robertson did best. He seemed to be a very effective figure in the House and a formidable debater etc. That isn’t nothing, especially when (as they will, for any government) things go badly at times. Perhaps Willis will be similarly effective (she was, like Robertson, primarily a political operative by background).
But beyond that it is very hard to know. One could mount an argument that at least in the first couple of years Robertson didn’t do a bad job at all managing the government’s finances (the left thought him far too disciplined), but he’d inherited a fairly easy position (budget surpluses, unemployment falling etc). The problems really became apparent once the worst of the Covid disruptions were over, and instead of insisting on steering a path back to surplus (in an overheated economy), Robertson presided over additionally expansionary budgets both last year and this, such that he bequeaths large deficits in a country that for 25 years had largely avoided them. There seemed to be an inability or unwillingness to say no (and that in a government with no pressures from coalition etc parties).
How will Willis do in that role? There really is no way of knowing at this point. No doubt officials in Treasury have been beavering away for weeks preparing advice for an incoming Minister of Finance, one who plans to bring down some sort of mini-Budget within what will be not much more than her first five weeks in office, and will quickly have to focus on next year’s Budget. But as to what hard calls she is willing to make, or to insist on (both her Prime Minister and the other parties will have different views on things) no one knows. There is no track record (or nor really can there be, especially when neither she nor Luxon has previously served as a minister).
I’m not overly optimistic, including because of the reluctance to put the seriousness of the fiscal situation front and centre during the campaign, preferring to run a campaign in which – like Labour’s – (faced with large deficits) it was more a contest of who had had the shiniest new baubles to bribe voters with, financed by proposed tax changes that – like Labour’s – had little no economic merit, and around which there were also serious questions about the revenue they might raise. As to the foreign buyers’ tax business, my unease was less about whether or not the revenue estimates are roughly right – in macro terms it was always second order – than about the way she and her leader handled the issue, refusing transparency, refusing to release any of the modelling, relying on “trust us” assertions when it wasn’t particularly obvious why – with the best will in the world – we would. Verification helps underpin trust, and there was none of the former.
Being Minister, backed by a phalanx of Treasury staff and analysis, is different than being opposition spokesperson in a campaign. But it isn’t Treasury that makes the hard political calls (and too often in the last few years Treasury itself seemed more inclined to favour bigger government over balanced budgets). There is clearly now some political mood for restraint – even Labour seemed to get it in the last few weeks – but how well, and for how long, will that shape Beehive decisionmaking when the pressures from the numerous vested interests (of all sorts) mount?
My own unease is greatest around that “lead figure in overall economic strategy” role. There will be other senior ministers no doubt, but a Minister of Finance who is deputy leader of the main governing party should be able to be looked to as the key player in this area. And it is where, in her time as finance spokesperson, there is little sign that she has any more credible a model – or any more substantive interest – than Grant Robertson had for (for example) reversing the decades of economywide productivity growth failure. We shouldn’t look to the (any) Minister of Finance as some sort of economic guru, but there is little or no sign that Willis is greatly interested or has made any effort to surround herself with advice, expertise, or even active debate about what might be needed. The risk is that holding office will be sufficient, rather than doing something much in it. There is, of course, the 100 point economic plan (which when I read it I probably agreed with a majority of the items in it) but a list that long really is a list rather than a strategy backed by a compelling narrative. And it isn’t as if The Treasury seems to have much to offer there either (as distinct from narrower expenditure control stuff).
Who knows. We’ll see before long I guess. If I’m “not a big fan” – and I’m not – it is a long time since I’ve had much confidence in any senior New Zealand political figure (or most of their top bureaucratic advisers – an issue for Willis since The Treasury is weakly led, and entities she will be responsible for like the Reserve Bank and Productivity Commissions are worse. What, if anything, she is prepared to do about the leadership of these three agencies will be an early test). It would be great to be pleasantly surprised.
(In the snippet above I included Bryce Wilkinson’s comments, partly because he runs a quite different line about Michael Cullen than the quote from me. The background to my own comment was the observation that one didn’t need to have an economics background to be an effective Minister of Finance. Cullen’s politics were very different to my own, but I have here several times defended his fiscal management, noting that he proved to have been very badly advised by Treasury, which told him that even in the face of expansionary budgets late in his term the Crown accounts would remain in operating surplus over the forecast period. That proved to be very wrong, but it is The Treasury that is paid to do the numbers and provide those reckonings. A couple of posts on that are here and here.
All that said, when I wrote about Cullen’s book I ended the post this way
Those last few lines are the sort of thing that could fairly be said of pretty much all our Ministers of Finance for decades.
It would be great if Nicola Willis were to be different. But there aren’t yet many positive straws in the wind.