In the end, of course, the bottom line of yesterday’s Reserve Bank announcement was unsurprising and perhaps inevitable – action deferred on account of Covid. It wasn’t as if they were on some statutory schedule, so they could easily have postponed the decision for a couple of weeks, but in the scheme of things the difference between that and waiting for the next scheduled review (6 October) isn’t great. It is clear from the Bank’s forecast numbers they had not been minded to raise the OCR by 50 basis points this time, so if need be they can always catch up by acting a bit more firmly in October.
There was even something to praise. The Bank had revamped the look of the document and – bad-wig new logo aside – it was a definite improvement, even if it is hard to be sure what (if anything) the front cover art might be supposed to represent. And there were, perhaps, a couple of more-interesting graphs than usual. Quite a bit of the media coverage seemed more focused on things the Bank isn’t responsible for – house prices – than on the things it is responsible for.
I guess I had two concerns about the document.
The first was about the analysis. Three months ago the Bank – with more macroeconomic resource than any other agency in the country – thought that well into next year the unemployment rate would be 4.7 per cent and seemed to see core inflation only converging very slowly on the target midpoint (from below). Instead, the unemployment rate is now 4 per cent and core inflation is above the target midpoint, but unless I missed something I saw hardly a mention of this forecasting error and no serious discussion or analysis of it.
Why does it matter? After all, the best of people make mistakes – even in recognising where the economy is at the time you were writing (the May forecasts weren’t finalised until 21 May, and both the CPI and HLFS are centred on the middle of each quarter (in this case 15 May). It isn’t so much the mistake itself I hold against them – although they should have done quite a bit better – but that if there is no analysis of how they made that mistake, and what the fact of the mistake has taught them about how the economy is working at present, how can we have any more confidence in the latest forecasts than in the last (wildly wrong) ones? And the MPS is supposedly an accountable document, not just an opportunity to brush the last set of numbers under the carpet and have another go at the dartboard to generate some new numbers. In particular, why when the momentum of the recovery in demand and activity (and inflation) took the Bank by (considerable) surprise do they think it has suddenly come to an end – implicit, for example, in unemployment rate projections that are 3.9 per cent for next March and 3.9 per cent for the following March (from 4 per cent at present). Or why, with core inflation having picked up quite strongly do they think it will settle as easily and quickly as implied in their numbers (bearing in mind that monetary policy has its greatest effect on inflation with a 12-18 month lag)? It was also a little surprising that there was no serious analysis of the role fiscal policy is, and is expected to, play in supporting (or dampening, as deficits are closed) demand and activity.
I am not running a strong alternative view here. They may prove to be right (and even by more than just chance, so for the right reasons) but there is no supporting analysis – no sign they understand the last 18 months or the last quarter – that should give anyone any more reason for confidence that in an amateur’s shot at a dartboard.
And, of course, if there is nothing in the body of the MPS, there are no speeches, no (searching) interviews, and the so-called minutes are as bland as ever, offering nothing even hinting at hard questioning, challenge, debate, or openness to alternative perspectives. No insight, no understanding, no challenge, no research, no scrutiny, all adds up to no authority. There is no sense that these people are any more than bureaucratic administrators.
The second concern was about policy, although perhaps in practice that boils down to absence of any serious analysis as well. The MPC has chosen to keep going with its jerry-built crisis funding programme, the Funding for Lending programme and to not do anything about reducing the stock of bonds it bought when it was trying to ease monetary conditions (ie until a few weeks ago, although mainly last year), decreeing that the OCR is its “preferred instrument”. Perhaps there is a case for leaving these crisis interventions on the books and jumping straight to the OCR, but if there is a serious case neither the Committee nor the Governor (as, supposedly, their spokesman) made it. Rather belatedly the Committee has now asked staff to prepare a paper on what to do about the LSAP, but why wasn’t that commissioned – and consulted on or published – months ago. When a journalist asked the Governor why MPC wasn’t acting first on the FFL and LSAP schemes, she was fobbed off with a spurious answer about the MPC preferring to operate with tools that were widely understood and which they themselves had a better, more precise, sense of how they would work.
Neither excuse seemed adequate. First, they are already having to factor into their forecasts now their views (implicit or explicit) on what impact the FFL and LSAP are having (and remember that most of the literature says that if there are material effects from schemes like the LSAP they are stock effects not flow effects). Second, the FFL is an explicit crisis intervention, when there is now no crisis, designed for an inability to use negative OCRs which no longer exists. Third, the FFL is explicitly discriminatory (only banks can access it). Fourth, you’ll recall how confident the Governor was last year about the power of the LSAP to influence monetary conditions – rhetoric that now seems to have disappeared completely. And fifth, there was no mention of the large losses (to the taxpayer) that the LSAP scheme has run up, and the substantial market risk the taxpayer is exposed to each day the scheme is left in place (by contrast conventional monetary policy instruments pose little or no financial risk to taxpayers ever).
Perhaps there is a case for their stance (although I doubt it) but it wasn’t made yesterday. The public should expect better from its highly-paid powerful officials.
And finally, two charts. I don’t have any confidence in the Bank’s analysis of house prices, or the new requirement the Minister foisted on them to talk about “sustainable prices”, but amid the breathless talk of the Bank picking a 5 per cent fall in house prices, it is perhaps useful just to focus on this MPS chart.

Their scenario C is one in which nominal house prices hold steady. Their actual projections (line B) are less hopeful than that. Is it perhaps telling that the MPC shows line A – further strong price growth – out indefinitely – but line D (modest falls) only for a couple of years. Whatever the immediate cyclical situation – and some fall in the next 12-18 momths doesn’t seem that unlikely to be – nothing the government has done even begins to fix the structural failure (which the truncated y-axis in the chart minimises) and all the RB activity in this area is simply papering over cracks and running defence for the government.
The other chart doesn’t show anything new, but it is just nice to see it from a government agency.
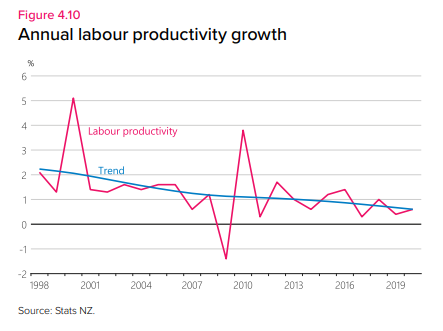
It is a dismal portrayal of the utter failure of successive governments (both National and Labour led). They simply use it as one part of a story as to why New Zealand neutral interest rates might have been falling – inadequate a story as it is, since our long-term real interest rates remain well above those elsewhere, even as productivity growth is worse than in most places. As it is, between things the government has little or no control over (Covid, abroad and here) and those things that are pure policy choice, it is more likely that the next few years will show even worse productivity growth outcomes than the last couple of a decades. The Bank itself – like a true believer – nonetheless projects that trend productivity growth in each of the next three years (ie including the one we are in) will be stronger than in any of the previous six years. That Tui ad springs to mind.

Can you please ask Dr Nana what his view is of the productivity graph fig 4.10 in your article.
Lazy workers reflect badly as does the people who fail to find work due to the high unemployment benefits.
There needs to be a serious change in what the Government wants from all able people in NZ.
LikeLiked by 2 people
In fairness to the Productivity Commission they do run charts like this, but so far have not offered credible proposals to reverse the decline. Not that standard measures use GDP per hour worked.
LikeLiked by 1 person
Reblogged this on Utopia, you are standing in it!.
LikeLiked by 1 person
So about 22 people out of 5 million can dictate financial stability in NZ?
A brief glance at the exchange rate shows the folly of this non-decision by the RB.
Enough is enough., the RB must attend to its job without fear or favour.
LikeLiked by 1 person