Back in the very early days of this blog, in a post about the gap between New Zealand interest rates and those in other advanced countries, I ran this chart constructed from OECD data.

There had been no sign of the large gap between our long-term interest rates and those abroad systematically narrowing. These were nominal interest rates, but as another chart in the same post illustrated the gap between our inflation rate and those in other advanced countries had also been quite stable, suggesting that the story held for real interest rates as well. Unless your economy is recording stellar productivity growth year after year, large positive gaps between your real interest rates and those in other countries are usually not thought to be “a good thing”.
In recent months all the focus locally has been on the low absolute level of interest rates. In fact, globally there were stories in just the last few days of some key international real interest rates reaching new long-term lows.
But what has been happening to the gap between our interest rates and those abroad?
The gap between our policy rate (the OCR) and those in other advanced countries has certainly narrowed – New Zealand is just a touch higher than policy rates in the US, UK, and Australia, and even among the countries with negative policy rates the gap to Switzerland (-0.75 per cent) is now only 100 basis points. When I wrote the 2015 post, our OCR was 300+ basis points higher than policy rates in most of these countries.
Of course, if you believe the market economists, those gaps are about to start widening again. New Zealand won’t be the first OECD country to raise policy rates (Iceland and Mexico have already done so this year) but most don’t seem likely to move for some time yet.
But what about longer-term interest rates, which typically embody expectations about future short-term rates?
In this chart, I’ve updated the red line from the previous chart (New Zealand 10 year rates relative to G7 ones) up to June
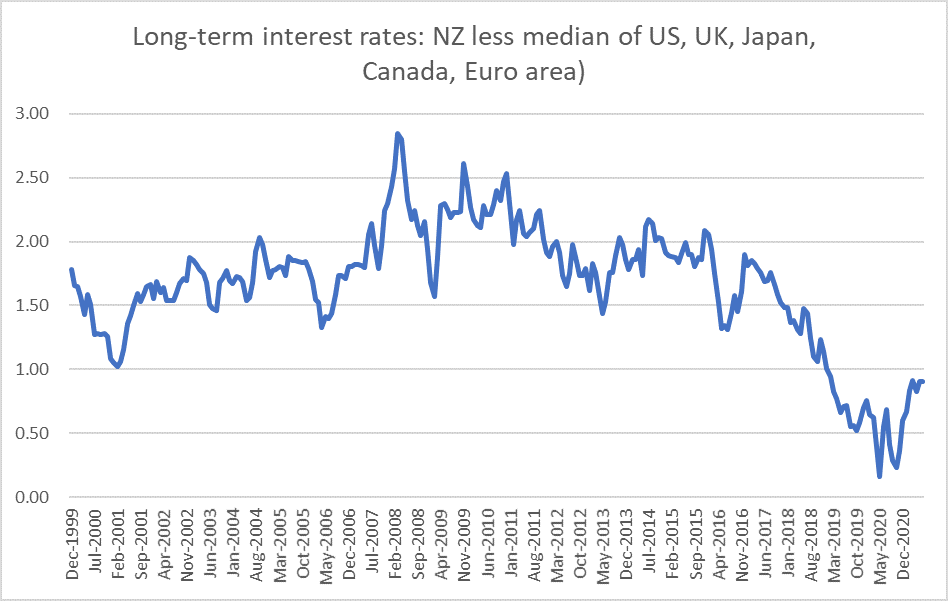
The gap is now a lot smaller than it was for most of this century (albeit quite a bit larger than it was at last year’s lows, when the OCR was expected to stay very low, or be taken lower, for quite a few years to come). At current levels, the gap is a bit higher than it was at the end of 2019 before anyone had heard of Covid.
But what are markets saying about the very long term, beyond Covid and the immediate economic challenges, and focusing on real yields from the inflation-indexed bond markets?
Without a Bloomberg terminal, time-series data aren’t readily available for lots of countries, but here are the yields for New Zealand and the United States (we have two specific bonds, while the US publishes a constant maturity 20 year series). The first chart shows the levels of respective rates, and the second the gap between the yield on the New Zealand 2040 bond and the US 20 year.
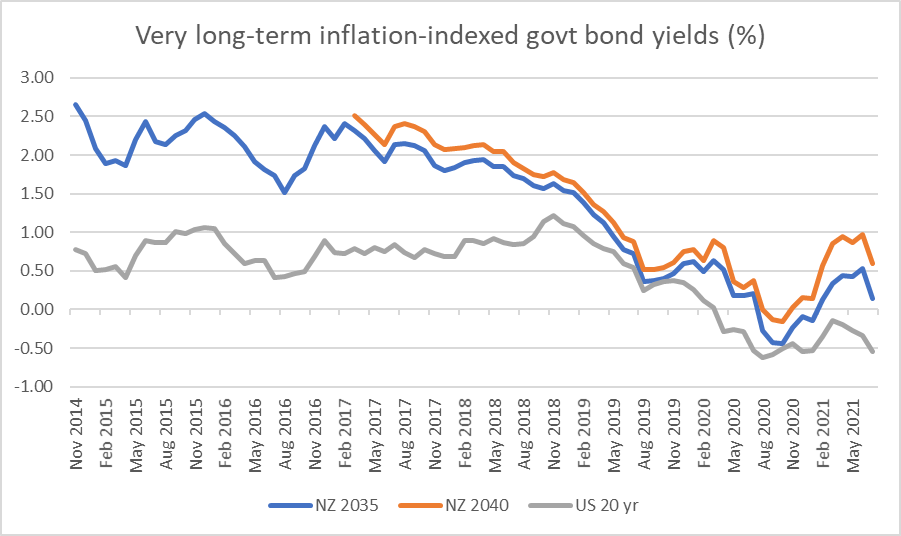
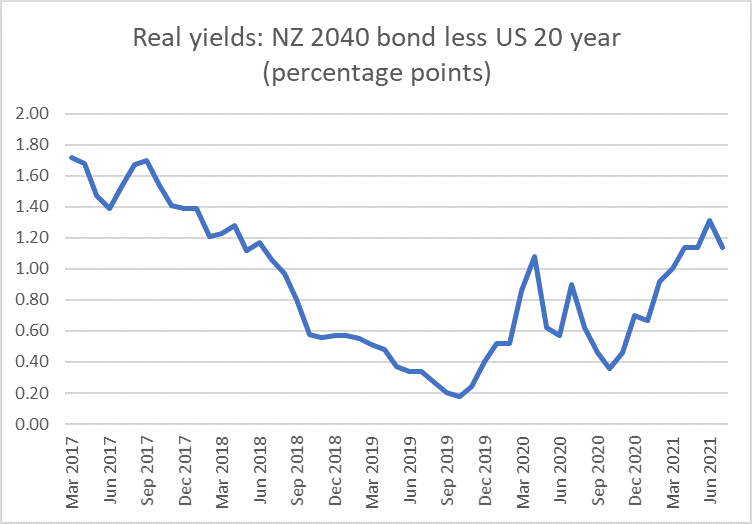
The absolute levels of all these rates are very low (in the US near record lows), but the gap between New Zealand and US long-term real rates has opened right back up again, and is now around where it was at the start of 2018.
That is just the US of course. But the thing is that, in OECD terms, the US these days is a relatively high interest rate country- highest 10 year bond rates of any of the G7 countries.
Here is a chart of the yields on the German government’s 2046 maturity inflation-indexed bond.

Even allowing for the fact that the New Zealand government bond matures in 2040 and the German one in 2046, there is gap in yields of something a bit over 200 basis points.
These are really big differences. And they have nothing to do with the policy stances for the time being of respective central banks – which can affect expected real interest rates over the first few years of an indexed bond. but are lost in the wash over 20 years (when people, institutional structures, and central bank mandates change anyway). These differences are about real economy phenomena.
There are, of course, conventional suspects. These are government bonds so what about the respective levels of government debt. But, of course, New Zealand has lower government debt (as a share of GDP) than most OECD countries, including both Germany and the United States. Most probably, we are expected to continue to keep government debt well in hand. If the market were pricing much sovereign credit risk across these economies, the real risk-free gap would be even larger than the numbers I’ve shown here.
Perhaps the real interest rate gaps are now a bit narrower than they were five or six years ago. Even then, however, we should be cautious about welcoming the change without understanding it better. It could, for example, represent (implicitly) a reduction in long-term expectations about relative economic growth and the demand for real resources that business investment gives rise to – and if so we might interpret differently an implicit reduction in expectations about relative productivity growth and an implicit reductions in expectations of relative population growth. As it is, it is simply too early to tell.
Markets tend not to leave free lunches on the table though. And if New Zealand government bonds are offering unusually high local currency yields for a stable low-debt country, the counterpoint is likely to be in the exchange rate. Economists have a model known as Uncovered Interest Parity (UIP) in which the difference in two countries’ risk-free interest rates is equal to the expected change in the exchange rate between those two countries over the period in question. It isn’t a proposition that actual exchange rates (ex post) reflect those initial interest rate differences – all sorts of shocks intervene almost every day – but something like an equilibrium condition ex ante.
If, for example, New Zealand real interest rates for a 20 year maturity are 150 basis points higher than those in other economies, that would be consistent with an implied expectation of a 35 per cent reduction in the real exchange rate over that 20 year period.
Of course, as I’ve shown here, New Zealand interest rates have averaged quite a lot higher than those abroad (even in real terms) for a long time, and although the exchange rate has at times been volatile (less so in the last decade than in the previous couple) we have not seen that sort of sustained fall in the real exchange rate, so there have (ex post) been windfall gains to those who bought and held New Zealand bonds. But that doesn’t change the indications that serious imbalances are still present in our economy (not just this year, not just about Covid, but something deeper and more persistent): persistently higher real interest rates than those abroad, a real exchange rate that has not adjusted structurally lower, weak business investment, low productivity growth, and feeble external trade performance (exports and imports flat or falling as a share of GDP.
(But, to anticipate comments, it has nothing whatever to do with house prices. Repeat after me, over the decades we have built fewer houses – and freed up much less land – than our population growth would have suggested was warranted. It is the commitment of real resources – physical building of houses, subdividisions etc, that (all else equal) puts pressure on real interest rates, not house price developments – lamentable outcomes of other policy choices that they are.)
