Some months ago, when all was coronavirus, Statistics New Zealand released their regional GDP data for the year to March 2019. I didn’t even open the spreadsheet at the time, but went looking for some data the other day and remembered I hadn’t written about the regional GDP numbers this year.
SNZ has been publishing the regional GDP data, by regional council area, for some time now. The first data are for the year to March 2000, meaning that we now have 20 annual observations.
Here is how per capita (nominal) GDP for each of the regions relative to national (nominal) GDP per capita has changed since 2000.
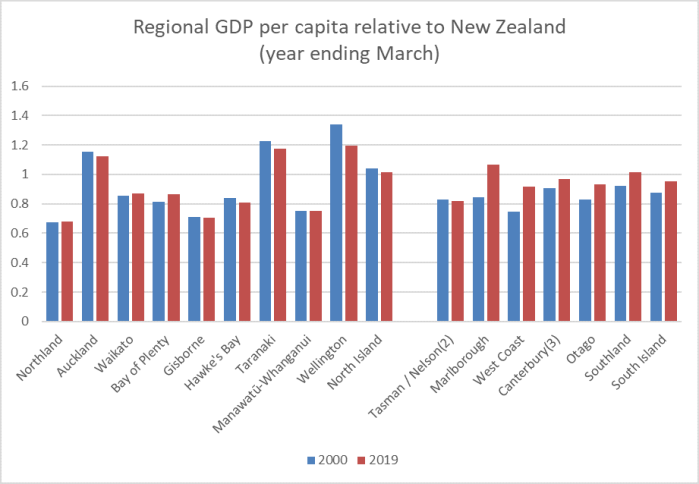
I suppose it is convergence of sorts. Even in the very poorest region – Northland – per capita GDP has increased very slightly relative to the national average, while the three highest GDP regions (Auckland, Taranaki, and Wellington) have all dropped back relative to the national average. The gap between the South Island and the North Island has more than halved and – if one is to believe the numbers – GDP per capita in Marlborough now isn’t much behind that in Auckland.
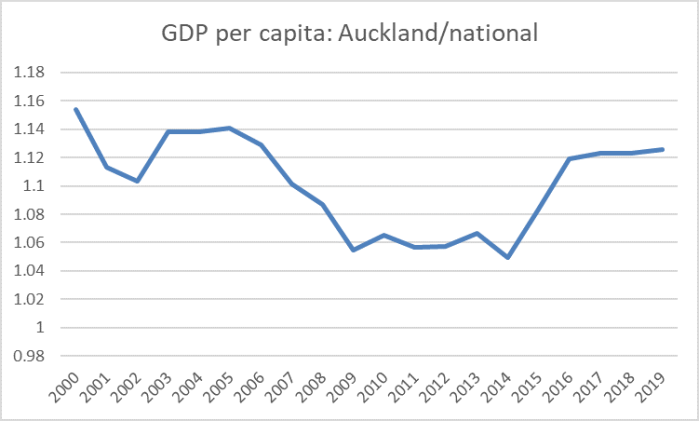
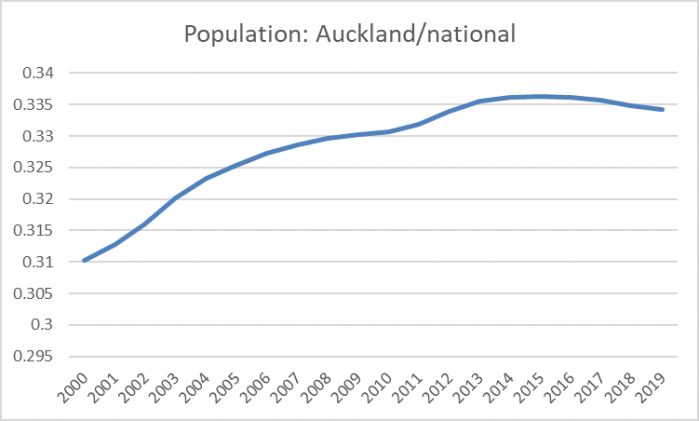
I’ve discussed previously the relative underperformance of Auckland. There aren’t many OECD economies where the biggest city has per capita GDP only about 12 per cent above the national average (let alone where that gap has narrowed this century). But it is only fair to note that Auckland had been staging something of a recovery. Here is the time series chart of Auckland’s per capita GDP relative to the national average.
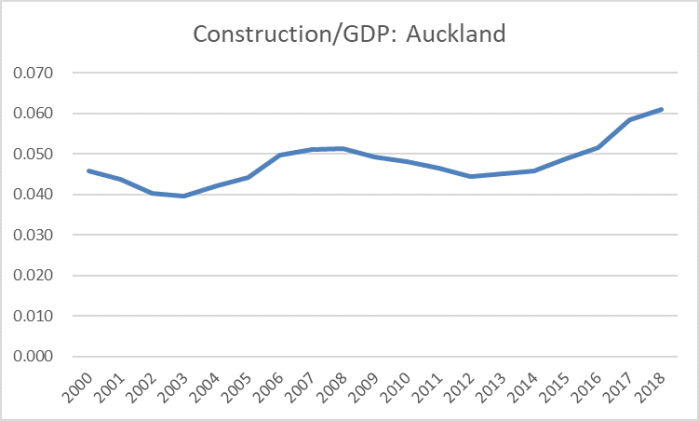
Population surges and associated building tend to be good for Auckland – but there is no sign of productivity leadership, when per capita incomes in Auckland are still a bit lower (relatively) than they were 20 years ago. I think it was the economist Andrew Coleman who suggested, only slightly tongue in cheek, that the business of Auckland was building Auckland. Here is construction as a share of GDP for Auckland (these data lag another year behind).
Having said that, I was a little surprised to stumble on this chart.
Of course, if the Auckland economic performance this century has been underwhelming – especially relative to the rhetoric and political capital invested in talk of our “one global city” (the one just a bit smaller than Columbus, Ohio) it is as nothing compared to the relative decline of Wellington, despite all the puffery from the Wellington City Council, its “economic development” agencies, and the like. Here is GDP per capita for the Wellington Regional Council area (largely greater Wellington).
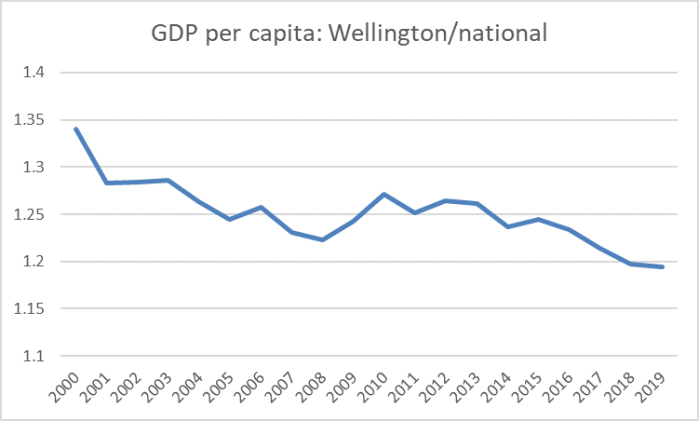
Recessions might be good for Wellington’s relative position – not many public servants get laid off in downturns (including the current one) – but otherwise it is a pretty stark and consistent decline. Wellington’s share of the national population has also been falling steadily – albeit perhaps more slowly than the decline in per capita GDP might suggest was warranted.
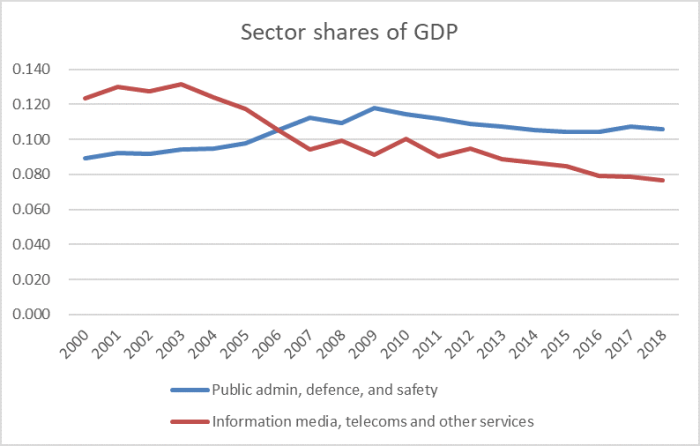
At least if you live in Wellington, one often hears talk of the Wellington IT sector and, of course, the heavily-subsidised Wellington film industry. The regional GDP breakdowns don’t show either directly, but the red line in this chart remains somewhat sobering.
Last year SNZ decided to discontinue its annual screen industry statistics – claiming (no doubt fairly) budgetary pressures, although it must have been convenient for the government (this one, like its predecessors) keen to talk about the alleged economic benefits of their massive subsidies to the film sector, even as what evidence there is rarely offers much support for their claims. The last such data came out a year ago for the 2017/18 year. Here is a snippet from the gross revenue table, by region.
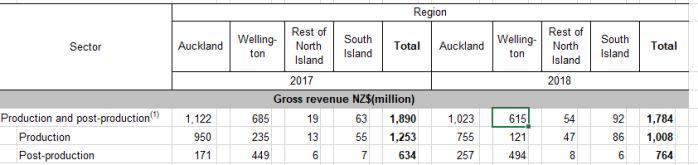
And here is the same snippet for 2012 and 2013.
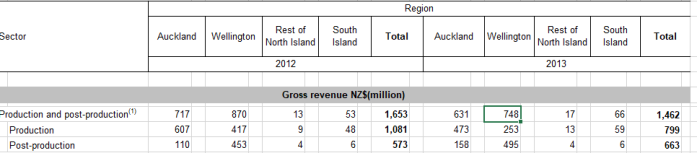
So gross revenues of Wellington production and post-production facilities/services – mostly feature films (unlike Auckland) in the most recent year were not even three-quarters of what they’d been in 2012.
(There is a longer series of earnings for jobs in the total production and post-production sector – including the domestic-oriented bits – of the screen industry: relative to GDP it was no higher at the end of the period than when the series started in 2005. And estimated number of jobs in the sector has gone from 20400 to 20300 over the same longer period. It looks like a classic infant industry – remaining infant and kept going by massive subsidies that keep the rest of us poorer.)
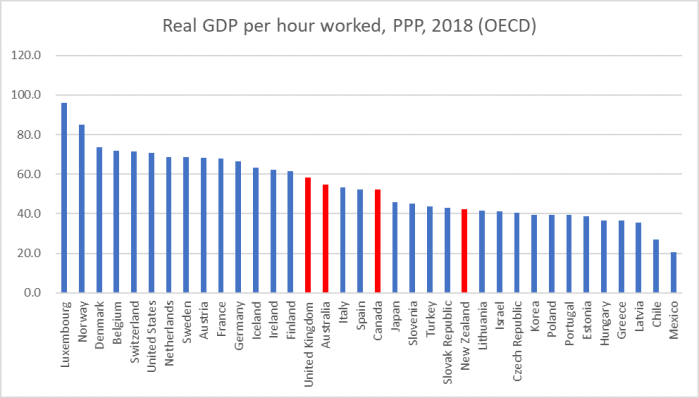
All this is, of course, against a backdrop in which national-level productivity growth remained very weak, and New Zealand continued to drift behind more and more countries that, not too long ago, we never even thought of as relevant comparators.