We mark today the official birthday of our head of state, Her Majesty, Queen Elizabeth II, queen of New Zealand and of her other realms and territories. Her actual birthday was 21 April 1926, when her grandfather George V was on the throne.
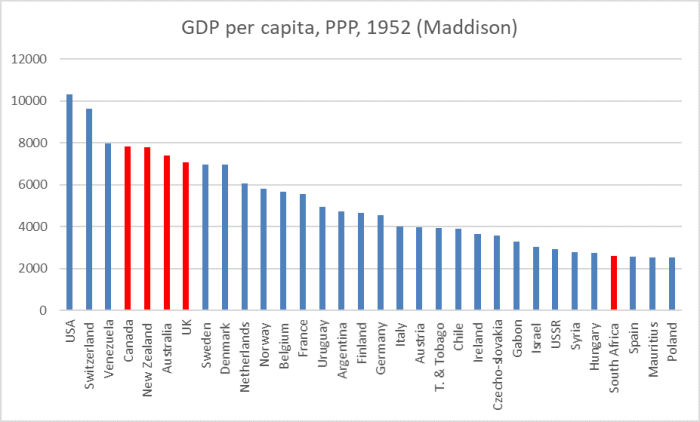
When she was born, the United Kingdom and the Dominions (as they were then called) were still among the most prosperous countries in the world. Using the Maddison compilation of real GDP estimates (and averaging across 1925-27, on account of some considerable year to year volatility in some of the series), here is how things looked at about the time the Queen was born.

At the time, Newfoundland was an independent dominion (for which there is no data, but presumably it was a bit poorer than Canada), and South Africa was also still a domininion. Maddison has no data for South Africa in the 1920s, but what data there is suggests real GDP per capita might have been about a third that in New Zealand.
But the core grouping – the UK, Australia, New Zealand and Canada – took out four of the top eight places.
The Queen ascended to the throne on 6 February 1952. By then, Ireland had become a republic, Newfoundland had been absorbed into Canada….and there was data for Sout Africa.
You get a sense of the growing importance of oil (Venezuela, Trinidad and Tobago – then still a British territiry – and Gabon), but the core group of Her Majesty’s realms still occupied four of the top eight places. There are all sorts of other ranks/comparisons in that chart that caught my eye, but today is Queen’s Birthday.
What about now? Here are the OECD country data (news to me today was that Colombia has just been admitted to the OECD)/
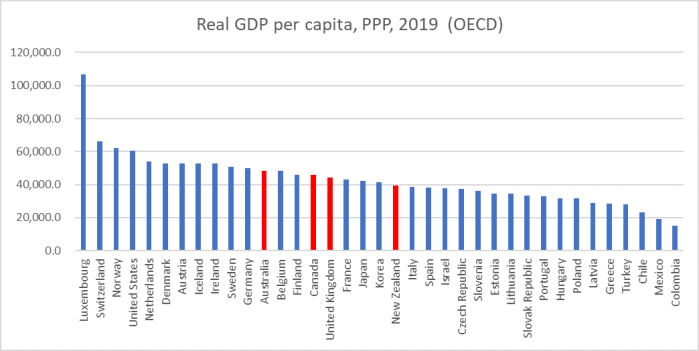
There is data for some more (very small) advanced countries. Then again, Singapore and Taiwan aren’t in the OECD, and they both have real GDP per capita now higher than any of that core group of the Queen’s realms. Use the IMF listing, which also adds in the oil-producing countries, and that core group rank 19, 20, 27, and 32 – a far cry from the position when Queen came to the throne.
(Of the former Dominions, Ireland – here shown, as the Irish do, using the modified GNI measure – ranks well, but not exceptionally so. As for South Africa, in 1952, its real GDP per capita was not far behind that of the USSR. These days – IMF rankings – South Africa is 96th and Russia 50th.)
I used the OECD numbers in the previous chart because the OECD also had productivity data. Here is real GDP per hour worked (same adjustment for Ireland) for 2018.
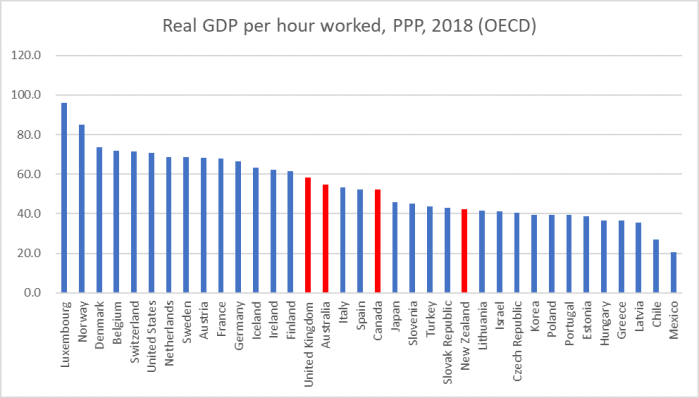
New Zealand and Australia tend to have high hours worked for capita, so the GDP per capita rankings are not as bad as those for GDP per hour worked.
Quite a portrait of relative decline. Her Majesty – and her Governors-General – appears to have been poorly advised on matters economic by her minister and officials in all four of these countries.
The Queen is also monarch of a variety of other countries – 12 others directly, plus the Cook Islands and Niue by right of her position as Queen of New Zealand. (There is a fascinating chart here of how the number of countries she has been monarch of has changed over the years.) Sadly – especially for them – none of those other countries has put in a particularly compelling performance either. On the other hand, there is a range of UK/Crown territories – Falklands Islands, Bermuda, Isle of Man, Gibraltar and Guernsey – that now do better than any of the UK, Canada, Australia, or New Zealand.
