The other day, courtesy of the Twitter feed of the chair of our own Productivity Commission, I noticed a link to a speech by the chair of the Australian Productivity Commission, Michael Brennan, under the title “Economic Knowledge and the State” given to an ANU symposium last week with the same title. That sounded intriguing.
In truth there was less there than I hoped there might be. It was mostly an attempt to argue that economics has been a generally positive influence on policy in Australia in recent decades and can be expected to continue to be so. But he was a bit modest about that, partly because it can be very hard to unpick quite how much difference economic analysis and the advice of economists made, and what the counterfactual might have been.
Brennan starts with a nice illustration of the power of productivity to make a difference in material living standards.
Average incomes in Australia today are 7 times higher than they were in 1900. To give you a tangible illustration of what this means, in 1900 we estimate that it would take an average worker over 500 working hours (a couple of months) to earn enough to buy a bicycle, which was then a staple form of transport.
For an average worker in the 21st century, it would take about a day. And of course, in 1900 you couldn’t buy anti-biotics, air-conditioning or a refrigerator.
But the focus of this post was Brennan’s short discussion of Australia’s overall economic performance.
In the post war period, Australia’s per capita GDP went from being nearly $6,000 above the OECD average in 1950, to below the average in 1990.
That is partly due to the comparator — several OECD nations converged rapidly towards US living standards in the post war era.
But there is no denying that Australia’s relative fortunes have improved since 1990.
Over that 30 year period, our real per capita GDP (that is, excluding population growth and terms of trade effects) has out-performed all of the G7 economies, and our incomes have risen back to being well above the OECD average.
It was the first part of that final sentence that caught my eye. It is true – using the OECD’s real per capita GDP numbers, Australia’s growth since 1990 has exceeded that of all the G7 countries. I was a little surprised to learn that the UK had been (narrowly) the best of the G7 grouping over that period.
But lets unpick that a little.
First, the OECD data themselves only go back to 1970. At that stage there were only (from memory) 22 member countries (not including Australia or New Zealand) but the OECD has data for 1970 for 27 of the countries that are now members (most of the others were then in the communist bloc, or weren’t yet separate countries at all).
Going back further, if we use the Conference Board Total Economy database for those 27 countries we get something like the margin Mr Brennan quotes (he may have used a slightly different comparator). In 1950, Australia’s real GDP per capita was not only higher than the OECD average, but massively so: real GDP per capita in Australia was around 50 per cent higher than that for the average OECD country.
But how about the more recent decades. As Mr Brennan implies, there were various countries still ravaged by war in 1950 that did quite a lot of catching up subsequently. The OECD data start from 1970, which largely deals with that particular issue.
Here are two comparisons since 1970: first, Australian real GDP per capita relative to the G7 average, and second Australia relative to the average for the 27 (now) OECD countries for which there is complete data.
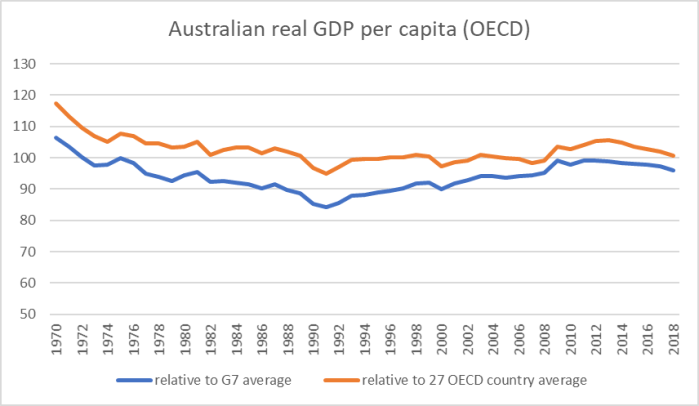
As recently as 1970, Australia had real GDP per capita almost 20 per cent above the average in this core older group of OECD countries. Now, it is almost bang on the average. Relative to the G7 countries there has certainly been some recovery since 1990 – Australia really has grown faster than each of those countries – but (a) relative to the wider OECD grouping Australia now sits about where it did at the end of the 1980s, and (b) both lines have been falling fall, at least a bit, in the last half dozen years.
(Relative to the whole OECD – the metric Brennan quotes – Australia’s real GDP per capita is certainly above that of the average OECD country, but given the pace of convergence of many of the former eastern bloc OECD members that margin is narrower than it was in 1995 (when the complete data for all countries is available).
All those comparisons were about real GDP per capita. But, as I noted, Brennan’s case had been about the power of productivity growth. And yet there were no data in the speech about Australia’s productivity performance.
Those data are even less favourable.
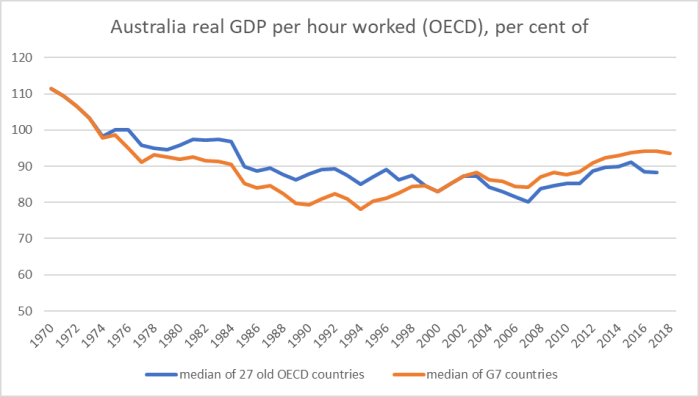
Whether the comparison is to the G7 countries or to the wider group of 27 OECD countries, average labour productivity in Australia is below the median of the other advanced countries. There has certainly been some improvement relative to the G7 countries, but even then Australia does less well than it was doing in the early 1970s.
(Relative to the full OECD, for which there is data only from 2000 onwards, Australia is a little above the median, but has managed no improvement this century to date.)
A little further on in his discussion, Brennan notes that Australia does not face the “stagnation of Japan”. Well, maybe. Here is a chart showing Australia’s real GDP per capita relative to that of Japan (and also relative to the US, a common comparator in Australian debate).
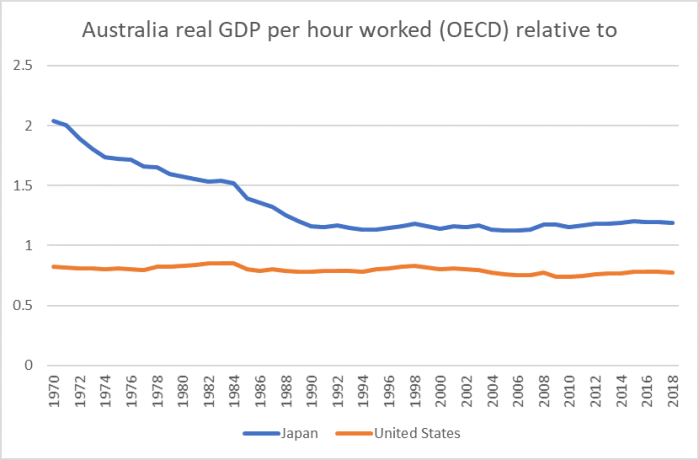
1989 was the peak of the Japanese share market boom/bubble. Australia’s productivity is no higher now, relative to that in Japan, than it was in 1989 (no higher relative to the US either).
In various posts this year I’ve used as a comparator on productivity a grouping of leading OECD countries. Here is how Australia compares.
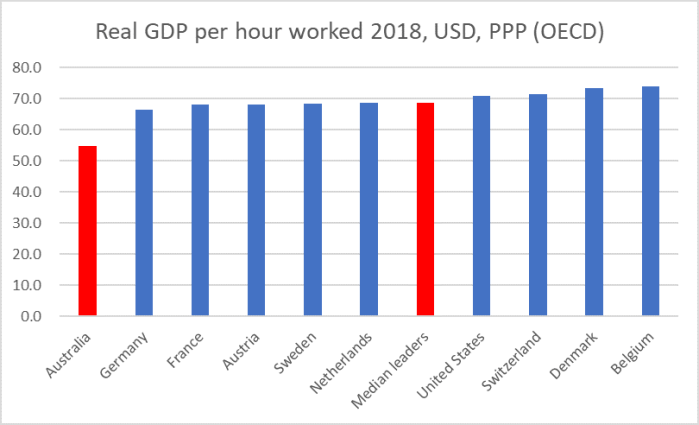
It would take a 25 per cent lift for Australia to match the median of that leading bunch.
And all this against the backdrop of the abundant natural resources, new waves of which Australia has been able to begin to bring to market in the last decade or so. I don’t show Norway in these “leading group” charts but it is the other advanced OECD country really blessed by nature with natural resources, and its real GDP per hour worked is almost another 15 per cent higher than that in Belgium. In many respects, given what it had going for it, Australia’s productivity performance has been woeful.
I reckon there is a pretty straightforward explanation – over and above all the normal areas any country could improve policy on – around the interaction between distance (in an era when personal connections, integrated value chains etc have often become more important not less) and the renewed determination of Australian policymakers to drive up the population more rapidly than almost anywhere in the OECD. But when he mentions geography is his speech, Mr Brennan refers only to the
mysterious but very real spill-over effects of agglomeration, particularly in large, dense cities.
perhaps not aware that, unlike the situation in typical (non natural resource dependent) OECD countries, in Australia real GDP per capita in the big cities – Sydney and Melbourne – barely matches that for the country as a whole.
Of course, writing from this side of the Tasman it behooves me to point out that New Zealand’s economic performance has been consistently materially poorer even than that of Australia, that the ability of hundreds of thousands of New Zealanders to move to Australia has helped many New Zealanders……and that Australia continues to have a consistently better cricket team.
But were I Australian I’d be a little uneasy at just how relatively poorly my economy had done, and is still doing, on the counts that matter – productivity – especially when the economy had been able to ride a mineral investment/export wave in a way open to few other OECD countries. And I might be asking questions about the quality of the economic analysis and advice from leading official institutions.

Good post, but I notice that you fall into the trap, common to apologists for Australian and New Zealand’s economic performance, of blaming distance from our markets. Transport and logistics costs are a very small part of the average price of consumer goods and are only really significant with perishables that must be airfreighted to our markets. Also, they aren’t a factor at all with weightless goods and services such as software. So, distance is not the tyranny everyone makes it out to be and is, at most, a minor factor in our relatively poor economic performance.
LikeLike
That’s not the distance problem in the modern business world. The important issues are who you get to have lunch with, which politicians you meet at cocktail parties, and how easy it is to have a golf session with a prospective customer. When it takes 9-24 hours to fly from anywhere in Australasia to anywhere important, distance is an unforgiving tyrant.
LikeLike
I’d echo comments along those lines. Also about where concentrations of specialist expertise (be it design, specialist legal or whatever) are.
My take on the issues is
https://croakingcassandra.files.wordpress.com/2019/05/an-underperforming-economy-the-insufficiently-recognised-implications-of-distance-draft-chapter.pdf a shorter version of which is forthcoming as a book chapter next year.
LikeLike
Have I read that correctly that the UK has been the highest performer of the G7 (on your preferred measure) over the period? How does the UK compare to the OECD overall? Have any of the Anglo countries managed to improve their productivity over the period or is this outcome the domain of other countries only?
I wonder how much of all this globally is down to ‘secular stagnation’? Brian Easton’s recent post on this resonated – particularly this sentiment:
“The list of possibilities is long. I finish this section with one more. Economic growth may have been more dependent on consuming natural resources than the conventional wisdom allows. If so, that part of growth is a kind of Ponzi scheme and we are reaching the point where it is coming to an end.”
Perhaps New Zealand is a microcosm of this outcome and we have reached that point faster than many of other places? Hence our own stagnation?
Link to Brian’s article:
https://www.pundit.co.nz/content/secular-stagnation
LikeLike
The best of the OECD performers were places like South Korea and Ireland (the latter all sorts of distortions) and the former Communist countries now in the OECD. But recall that the US is in the leading bunch, and their per capita income growth was almost equal to that of the UK – that is a pretty good performance, even allowing for the productivity growth slowdown near the frontier.
The issues are much more troubling for NZ given how far behind the frontier we start – we should have been able to catch up, but haven’t at all.
LikeLike