80 years of underachievement

Yesterday afternoon, glancing at my email inbox, I was briefly take aback.  Like many no doubt, I’m signed up for the Prime Minister’s weekly mass emails.   But, not really concentrating at the time, the sender/subject line of the latest one grabbed my attention.

Rt Hon John Key        Celebrate 80 years with me Michael

It was an unnerving thought –  80 years with the Prime Minister.

It turned out that yesterday and today mark 80 years since the conference in Wellington in which the depleted forces of the then Opposition formed the new National Party (and the PM was trying to encourage people to join the party today).  I got curious and turned to that invaluable resource Papers Past to see how the papers in 1936 had covered the formation of the new party, which was to play such a large part in subsequent New Zealand political history.  Surprisingly, there was very little coverage at all.  I guess the media is often not very interested in the goings-on of the Opposition the year after a new governing party has won a crushing victory.

In its eighty year history, National has been in government (and the dominant party in all those governments) from 1949 to 1957, 1960 to 1972, 1975 to 1984, 1990 to 1999, and from 2008 to now.  That is 46 years – or 58 per cent of the 80 years.  Take out the period of World War Two –  when everyone’s attention was mostly elsewhere – and National has dominated the peacetime scene and, hence, the ability to set policy, pass legislation etc.  (In fact, as the Prime Minister’s email pointed out, the National Party was formed by merging existing political parties, which themselves had governed New Zealand for decades prior to 1936.)

Against that backdrop, their achievement –  as stewards, leaders, those entrusted with power – is pretty disappointing.

In 1936, Angus Maddison’s collection of national per capita GDP estimates suggests that New Zealand per capita incomes were among the very highest in the world –  behind, but not much behind, the United States, the United Kingdom, and Switzerland.  Denmark and Australia were a little way behind us.  The Great Depression had been pretty awful for New Zealand –  albeit not as bad as in the US – but we had emerged as still one of the most prosperous countries in the world.

By contrast, on the IMF’s PPP estimates, New Zealand was 29th in the world last year.

The 1936 dataset only has estimates for around 50 countries, but glancing down the 2015 list it is a pretty safe bet that none of the other countries (not in the 1936 collection) now above us would have had higher per capita incomes than New Zealand in 1936 had the data been available.

New Zealand has done badly (although it is fair to note that of the other leaders in 1936, even the US now only has the 10th highest GDP per capita).

Here is a scatterplot showing GDP per capita in 1936 and 2014 for the 45 countries for which Maddison (and his successor, the Conference Board database) had per capita GDP estimates for both 1936 and 2014 (the latest actual data).

1936 and 2014

Broadly, countries that were rich then are still pretty rich now, and countries that were p0oor then are still towards the lower end of the distribution.  There are some striking exceptions – South Korea and Taiwan are two of the more striking examples here. (China, interestingly, for all the hype about the last couple of decades, is the dot furthest to the left on the entire chart).

New Zealand is marked in red, with incomes per capita well below where one might have expected knowing our economic performance in 1936.  Some places have done much much worse –  those green dots are Guatemala, Venezuela, and Argentina  – but New Zealand’s performance has little to commend it.  Relative to the starting point, it is the worst of any of the now-advanced countries.

Of course, some people will want to mount arguments that our severe underperformance is not a matter for which governments (or the political parties behind them) can be held accountable for.  And there are certainly some things government can’t change –  geography, natural resources, the EEC, and so on.  But almost every country has advantages and disadvantages –  permanent or specific to that 80 year window. In each country, governments are responsible for how they react.  Ours, typically, seem to have chosen quite badly.  Since our relative fortunes still aren’t improving, it is reasonable to suggest that our governments are still choosing badly.

The National Party, and those of its members who form governments need to take some considerable responsibility for that.  Of course, the Labour Party and its governments do too –  it is just that they have had rather less time with their hands on the levers of power.

Good luck to the National Party in celebrating their 80 years.  The party has done well for itself, but less well for the people of New Zealand.  I’m not suggesting any ill-will, or bad intentions, and I don’t subscribe stories in which parties skew things over time much towards their own voting base.  National Party-supporting groups have probably done about as badly as everyone else –  in those international comparisons –  over the 80 years. And that is a problem for all of us.

Somewhat to my surprise, I discovered recently that the Fabian Society still exists.  The Fabians developed in Britain as non-revolutionary socialists, and my images are of people like Sidney and Beatrice Webb, Clement Attlee, and Herbert Morrison.  But anyway, the movement still exists in New Zealand.  Also somewhat to my surprise, they’ve invited me to speak to one of their public meetings on what went wrong with New Zealand to generate this disappointing long-term  economic performance and what might be done about it.  Glancing through the list of past speakers, I think I will be the most conservative or market-oriented person ever to address them.   But I like the idea of any organization whose website leads with the aim of “inciting debate”.

Anyway, meetings appear to be open to anyone who wants to come along, and for any Wellington readers who might be interested I will be speaking –  sharing a platform with Herald columnist Brian Fallow (who is probably more naturally at home with the Fabians) –  this coming Friday evening (20 May)    Details are here, but the venue is Connolly Hall (Guildford Terrace, just off Hill St) and the meeting kicks off at 5:30pm


Outperforming cities…but not Auckland

My post the other day put the decline in Auckland’s GDP per capita (relative to that of the rest of the country) in some international context using BEA data on the average per capita GDP of various large US cities.  As one would have expected, the average per capita in the typical US large city had been rising a little faster than GDP in the US as a whole.

The US data are interesting, but the US is an extremely large country.  By contrast, in Europe that are lots of small countries, and (in particular) small countries with a single dominant city.  In that respect at least, European experiences might be more interesting to compare Auckland’s experience against.

Eurostat publishes a huge quantity of regional per capita nominal GDP data for the 28 EU member countries.  For a few (Malta, Luxembourg, and Cyprus) there wasn’t meaningful data distinguishing the performance of the biggest city from the rest of the country –  and in Luxembourg, the data are problematic anyway, since GDP captures economic activity occurring in a country, while many people who work in Luxembourg live in surrounding countries.  But that left 25 EU countries, and I went through the data to identify, as accurately as I could, the data for the metropolitan region capturing the largest city in each country.  Again, the data are likely to be only indicative –  in every metropolitan area, there will be some cases where people work in the area (so their output is in GDP) but live somewhere else (so the person isn’t in the population numbers for that region).

For a few large countries there is no single dominant city.  It isn’t an issue in the United Kingdom, France or Poland, where London, Paris and Warsaw respectively dominate,  But for Spain, Germany and Italy it is.  For illustrative purposes, I used data for Madrid, Hamburg, and Milan respectively.

Eurostat publishes data for 2000 to 2014, but for some cities the data are only available to 2013.   For each country, I took the average per capita income of the largest city and calculated that as a ratio of the whole country’s GDP.

This chart shows the behavior over time in the ratio for the median country.  I’ve shown two lines: one for the 17 countries with populations less than around 10 million, and one for all 25 countries.

eu time series

For all 25 countries, the median had increased over this period.  For the smaller countries, there been basically no change over the full period.  It is quite different from the picture for Auckland.

akld rel to nz gdp pc

I’m not sure why the smaller EU countries did less well on this measure than the full EU sample, but the smaller countries included the countries worst hit by the 2008/09 recession and the subsequent euro crisis.  There might be some cyclicality in the relative performance of the largest city does (doing really well in boom times, but suffering more than most in downturns –  we see a bit of this in Auckland, which feels the demand effects of fluctuations in migration more than most places).

Auckland’s average GDP per capita is higher than that in New Zealand as a whole (and around 12 per cent than that in the rest of New Zealand excluding Auckland), even if that gap has been closing.  But how does that levels gap compare?

In this chart, I’ve shown the latest observations for how much higher (%) average per capita GDP is in the big city  than for the country as a whole for each of the EU country –  grouped by small, medium and large.  I’ve also shown the median for the twelve largest US MSAs (as per my post the other day), the Auckland numbers, and the experimental numbers for Toronto (from a Statistics Canada research paper) for 2009.

gdp pc cross EU city margins

A few things catch the eye.  The first is that, at least among the smaller EU countries, it is the ones which have been catching up where the cities are doing best relative to the rest of their respective countries (eg Slovakia, Bulgaria, Hungary, and the Czech Republic).  New Zealand was supposed to have been catching up, but hasn’t.

The second thing that catches the eye is just how low the margin between average Auckland incomes and those in the country as a whole is, by comparison with these other countries.

But the third thing that caught my eye, was that the Toronto wasn’t much different.  Toronto doesn’t dominate Canada in the way Auckland does New Zealand: Toronto’s population is only about 50 per cent larger than that of Montreal.    The Statistics Canada data are only experimental, and they provide estimates for only 2001, 2005 and 2009, but on those estimates both Toronto (in particular) and Montreal had seen a fall in their average per capita GDP relative to that in Canada as a whole.

These days, Canada has higher GDP per capita than New Zealand does (it was the other way round prior to World War Two), but Canada’s productivity growth in recent decades has been about as mediocre as that of New Zealand.  Canada has much larger industrial manufacturing sectors than New Zealand does –  much of it tied into the US automotive industry –  but at heart much of Canada’s prosperity continues to derive from the ability to utilize its vast natural resources.  It isn’t an economy whose prosperity seems to be led from its big cities –  any more than New Zealand is.    That said, Toronto –  in such close proximity to the US –  seems a much more likely place for successful global companies to base themselves long-term than Auckland.

Canada also operates large scale non-citizen immigration programmes –  indeed, the new Canadian government has just announced a material increase in the target rate of immigration (and an reorientation away from economic migration –  towards refugee and family). Without knowing more about the Canadian data, I’d be hesitant in drawing too many parallels –  and Canada has not faced the same real interest and real exchange rate challenges New Zealand has.

But at least for New Zealand the striking underperformance of our largest city should raise real questions about strategies designed to (or having the effect of) drawing more and more people into Auckland (from abroad –  New Zealanders aren’t being attracted), in a country where per capita prosperity seems to rest –  and seems likely to continue to rest –  on the ability of our people to utilize, ever more smartly, a largely fixed stock of natural resources.

NB: Note that the US figures are measures of real GDP, while for the other countries the data are nominal GDP.    For cities other than the US, this will probably have the effect of overstating the margins by which big city per capita GDP exceeds that in the rest of the country, since many prices (including for example housing services prices, but also labour-intensive services) will typically be higher in big cites than in the rest of the country.

Was the Governor on the money?

That was the question a radio interviewer asked me this morning, about the talk of new Reserve Bank direct controls on banks’ housing lending.  He wanted a succinct answer.  Mine was simple: No.    The question was about talk of loan to income ratio restrictions, but the answer would be the same even if the question had been about the Financial Stability Report as a whole.

Take the talk of loan to income restrictions on banks’ housing lending first.  There was no mention  of this in the FSR itself, and even in the press release there was just a brief, but telling, reference:

The Reserve Bank is closely monitoring developments to assess whether further financial policy measures would be appropriate.

And yet clearly it is a major issue.  In fact, it dominated the press conference later in the morning.  Journalists asked question after question, and slowly drew information out from the Governor and Deputy Governor.  But there seemed to be no clear communications plan, and no developed messaging.  And none of the material was in the statutory accountability document they had just published.  It wasn’t impressive.

As Treasury pointed out last year, in many ways if the country is going to be dragged down the path of direct restrictions on banks’ loan portfolios, it would have been better to have looked  first at loan to income restrictions (“speed limits”) rather than loan to value restrictions.  Servicing capacity is typically more important than the current value of collateral.  The Reserve Bank could have adopted loan to income restrictions back in 2013.  But the Governor was in a hurry.    There was, in his telling, a desperately urgent issue and the Bank simply couldn’t wait: it had to do something, and LVR restrictions were what could be done very quickly.  The policy process in the lead-up to those restrictions was shockingly bad –  one (unelected) man had a bee in his bonnet, and there was little or no debate or discussion allowed (trying to pose some questions was when I got offside with the Governor).

Back almost three years ago when those restrictions were put in place, all the talk was of the temporary nature of the restrictions.  When people discussed it internally, I think most people had a sense that “temporary” might mean a couple of years.  The true believers thought that the top would have been knocked off the housing market by then, with the LVR restrictions having limited the new debt taken on in the last upward surge, and then things could get back to normal –  leaving bankers to decide the composition of their own portfolios.

But then we had a new wave of LVR restrictions last year.  In 2013, the Bank had not only seen the restrictions as temporary, but it was staunchly opposed to having different policies for different regions. By last year we had new LVR restrictions –  this time some mortgage borrowers were judged better than others, even for exactly the same underlying risk characteristics, and banks were allowed to lend in some places but not others.  And now the drums are beating for yet more restrictions –  perhaps even tougher, perhaps more differentiated, LVR restrictions, or perhaps loan to income restrictions.  There seems to be no end in sight.

Asked about this yesterday, the Bank seemed a bit bashful. The Deputy Governor noted that the Bank had never seen these things are permanent but………housing and financial cycles can be very long, so “temporary” might still be rather a long time.  I suppose exchange controls –  and all the other restrictions that Walter Nash and his successors imposed on us in decades past –  weren’t permanent either.  It “only” took 36 46 years to get rid of exchange controls.

Frankly, the Bank seems torn between two poles, and just hasn’t done the hard thinking or analysis –  or been exposed to the hard questioning by MPs and the media – to reconcile the two stances.

On the one hand, as they note in the opening sentence of the press release “New Zealand’s financial system is resilient”.   (That was also the story three years ago, when LVR limits were first imposed, but then the excuse was “but it might not stay that way if we let things carry on”).   As I noted (at length) last year, the stress tests the Bank had done in conjunction with APRA also suggested that the banking system could cope with very severe adverse shocks (including surges in unemployment on a scale beyond anything ever seen in floating exchange rate countries).  The latest FSR reported the results of new stress tests (reported in Box C of the document), done late last year.  The Bank did not publish a great deal of detail this time, but if anything the shocks look to have been a little more severe than those used in the earlier stress tests (no doubt befitting the further rise in house prices).  Once again, banks seemed to come through largely unscathed.  Total loan losses amounted (over several years) to around 4 per cent of initial assets – similar to the 2014 result.  Of this, 0.6 percentage points related to Auckland property lending.  As the Bank noted, loan loss rates on the housing mortgage books were only around 40 per cent of those observed for most other sectors.    There is simply no evidence that banks –  individually or collectively –  have been doing housing lending in a way that would jeopardise their own financial soundness or that of the financial system.  That is consistent with the international results –  which the Bank has previously cited – in which vanilla housing lending has rarely played an important role in systemic financial problems (especially in floating exchange rate economies).

And yet, and yet…..they reach for ever more direct restrictions on banks.  Now don’t get me wrong.  The New Zealand housing market (and especially that in Auckland, which is exposed to more pressures) is a disgrace.  There is no excuse for price to income ratios of 5, let alone those of around 10.  And central and local government policymakers are almost entirely responsible for those outcomes.    The Bank seems to half recognize this.  They talk of the interacting pressures of high rates of immigration at the same time that the urban land supply market isn’t working well.    But they don’t follow this point to its logical conclusion.  If the prices are largely the outcome of structural policy choices, there is no particular reason to think they are the fault of banks, or borrowers, let alone the despised class of “property investors”.    The Reserve Bank’s job is to use its regulatory powers to promote a sound and efficient financial system.  But the stress tests –  and their own regulator judgements, expressed in the press release –  suggest that the system is sound, robust and resilient.  And yet with every new set of restrictions they further undermine the efficiency of the financial system.

There are severe housing market policy problems, but there is no evidence that they are problems the Reserve Bank is responsible for, or needs to take action to try to remedy or ameliorate.  As I noted the other day the Reserve Bank has two main jobs.  The first is the soundness and efficiency of the financial system, and the second is keeping inflation near target.  At present, they are failing at the latter, are continually compromising the efficiency of the financial system, and all while skewing are policy (both regulatory policy and monetary policy) towards action supposedly designed to make safe a financial system that they tell us is already robust.

I couldn’t check this electronically this morning, but my impression was that there was almost no discussion at all in the FSR on the efficiency of the financial system, and the impact of Reserve Bank regulatory measures on the efficiency of the system.  That looks to be out of step with the statutory requirements for these documents.  I also thought it was interesting that there was little or no discussion of banks’ lending standards and practices.  I know the Bank is dominated by people with a macroeconomics background, but surely we expect to learm something in a document of this sort about the judgements the Bank, and its supervisors, are making about credit standards?

I wanted to pick up just three more dimensions of the material the Bank covered in the FSR. 

The Bank went to some lengths to argue that the LVR restrictions might have had only a “transitory” impact on house prices (the Deputy Governor’s words) but had led to a structural improvement in the quality of loans on bank balance sheets.  In support of this claim they produced a chart showing a reduction in the share of mortgages with LVRs in excess of 80 per cent.  In fact, there are all sorts of problems with this claim.  First, they don’t show us what has happened to the proportion of loans with LVRs just below 80 per cent (or just below 70 per cent for Auckland investors).  The difference in the riskiness of a loan with an 80.1 per cent LVR and one with a 79.9 per cent LVR is trivial, and yet regulatory restrictions typically impose these sorts of cliffs, with lots of loans gathered just on the approved side of the limit (and in ways which don’t appear when there are no regulatory restrictions).  The data mean different things in a regulated environment.

But that isn’t the end of the issue.  First, if people couldn’t borrow 85 per cent of the value of a house from a bank themselves, some will deterred from buying for the time being.  They might save a bit more and then go and buy.  But others will turn to other sources of credit.  The Bank correctly notes that there has not been a big increase in housing lending by non-bank lenders (not covered by the LVR restrictions, since the Bank has no legal power to impose such restrictions on them).  In itself, that lack of (this form of)  disintermediation is interesting – and perhaps worthy of further analysis (especially as it points to quite high efficiency costs from the restrictions).

But non-bank lenders aren’t the only alternative sources of credit, In many cases, parents or family members will have been tapped.  In some cases, those family members will be in a very good financial position and might be happy to lend from their credit balances.  But in other cases, a lower mortgage for the child might be offset by a higher (if still less than 80 per cent) mortgage for the parent.  In a crisis it is not individual loans that threaten the soundness of banks, but the exposures across whole portfolios.  It is quite possible that much of the apparent reduction in risky housing lending is offset by a general weakening in the overall credit quality of the portfolio.  If not, it would still be useful for the Reserve Bank to have engaged with the issue and explained why it concluded that these issues were not material.

Relatedly, the Reserve Bank has simply never engaged with the behavioural responses of banks to direct restrictions on portfolio composition (which we had simply never had in New Zealand prior to 2013).  These are profit-maximizing businesses.  If Reserve Bank restrictions limit high LVR housing lending, it reduces profit opportunities (and use of capital) in that part of the business. But what have banks done to maintain their profits and ensure that capital is fully deployed?  Surely a common take on regulatory restrictions is that they might dampen the risks we can see, while encouraging additional risk taking in less obvious areas.  I don’t know how banks responded to the LVR restrictions, but I’m pretty sure the response to the LVR restrictions wasn’t “you know, Graeme, you are right: we shouldn’t be seeking so much profit, and instead we’ll send the capital we would have been using in that business line back to Australia”.  I think we are owed better analysis of these issues from the Reserve Bank (and its large pool of analysts) before we accept that LVR restrictions have actually improved the soundness of the financial system.

In a sense, what each new set of regulatory interventions seems to do is the provide cheaper entry levels to the market for those purchasers who aren’t directly affected by the regulatory restrictions.  Each time a new set of interventions is announced there is a bit of a pause, and those pauses look like buying opportunities for those who can (at the expense –  pure and simple –  of those who can’t – those upon whom the Reserve Bank looks unfavourably).   The favoured might be the middle-aged trading up, cashed-up New Zealanders returning from abroad, those whose value to the banks means they are favoured recipients of credit from within the speed limits, those with wealthy parents etc (and even the non-resident foreign buyers, a significant part of net new demand in the Auckland market).  In general, the interventions advantage the haves at the expense of the have-nots.    Such redistributive policies might be what we elect politicians to do, but they shouldn’t be what unelected central bankers are about.

One keeps hearing disapproving comments –  including from the Reserve Bank –  about people purchasing residential properties to run  rental services businesses.  I know there is a strong community bias in favour of owner-occupation, and that the rate of owner-occupation has been falling.  But here the Reserve Bank –  and others who engage in this tarring of people in the rental services business –  is simply engaged in scapegoating.  All societies need scapegoats –  to bear symbolic responsibility  for what has gone wrong –  but if they are going to be part of a good policy regime there needs to be rather more robust differentiation between symptoms and causes.  If central and local government policies on immigration, land use, and building, combine to make house prices unaffordably high to young couples starting out, it is hardly surprising that those people end up renting (for longer) instead.  And someone has to own the houses.    The Reserve Bank was again citing yesterday statistics suggesting that around 40 per cent of housing sales are to “investors”, but why would this be a surprise (or even a concern, giving the “rigged” housing market?).  The home ownership rate itself is dropping towards 60 per cent, most rentals are provided by the private sector, and the median investment property is probably turned over a bit more frequently that the median owner-occupied house.

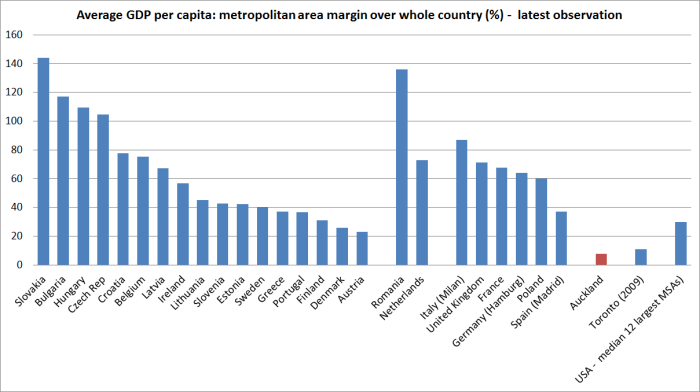
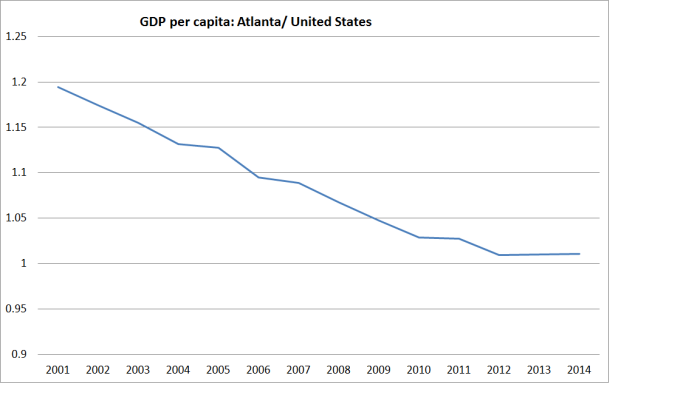
Finally, the Reserve Bank notes –  in a concerned fashion –  that household debt to income ratios are now (just) around the pre-recession peak.  In itself, this is a fair enough observation, but as so often in these documents it is the context or interpretation that is missing.  As I’ve noted before , there was no sign that the level of household debt as it was in 2007/08 lead to serious or systemic  financial problems.  And that was so even though all the research evidence suggests that it is large increases in debt to income/GDP ratios in short periods of time that has often foreshadowed financial crises.  The fact that debt to income ratios now are not materially higher than they were eight years ago –  coming off 15 years in which that ratio had increased enormously –  should be a source of comfort rather than concern.  We simply don’t have a good sense of what an “equilibrium” debt to income ratio is, and (in any case) such an equilibrium is likely to be highly endogenous to the extent to which the housing market is distorted by structural factors.  In Atlanta –  where median house prices are around US$180000 and house price to income ratios ar around 3 –  household debt to income is likely to be much much lower than it is in Auckland.

And the causation runs largely from housing distortions and house prices to debt, and not the other way round.  It is disappointing that the Reserve Bank never explicitly recognizes that if house prices are driven higher by the interaction of immigration and supply restrictions –  and that is exactly what the Governor says – younger generations will need to have more gross debt relative to income to buy the housing stock from older generations, than would be the case in a less distorted (much cheaper) market.

There was some interesting material in trhe FSR, but in the end it fell well short of what we should expect –  or even of what the law requires.  Wielding so much discretionary regulatory authority single-handed –  in a way that simply shouldn’t be happening in our parliamentary democracy –  the unelected Governor surely owes the public much more in-depth analysis of the issues and risks before we lurch into yet another ill-considered hasty patch on the symptoms of a serious problem, responsibility for which rests in the Beehive and –  to a lesser extent – in council chambers up and down the country?   The quality of the supporting analysis for last two LVR interventions was threadbare (or worse).  As they continue to undertake the analysis on further restrictions  – and talk to the Minister and Treasury, as part of getting loan to income limits on the (non-binding) list of tools in the MOU –  lets hope that the quality of the argumentation and research evidence rises to much better levels than we have seen to date.

As a final point, there was some mention in the FSR of the results of the Reserve Bank’s regulatory stocktake released late last year.    In that stocktake there was encouraging talk from the Bank of adopting longer consultative times for regulatory proposals and of possibly finally moving to routinely publishing the submissions they receive (as many other agencies, and select committees do, but which the Reserve Bank has consistently refused to do.).  There was nothing on either of these points in the discussion in the FSR yesterday.  I hope they are not backing away again.

UPDATE: This afternoon the Reserve Bank has put out a consultative document on the possibility of publishing submissions.  It appears to be strongly skewed towards maintaining the status quo.


Wheeler and Hannah on the OCR leak

I will offer some thoughts on the FSR itself tomorrow, but I had few quick reactions to the comments made at the press conference this morning about the MediaWorks OCR leak and related issues.

I had heard that the Reserve Bank had been considering backtracking on the discontinuation of lock-ups, and had in fact been consulting selected journalists on the conditions on which media lock-ups might be reinstated.  That was confirmed by the Governor this morning.

Frankly, they seem all over the place.  Less than a month ago, they announced the discontinuation of lock-ups.  I thought that was the right decision at the time (and had called for it earlier).  Presumably the Bank  had carefully considered the various options open to it then, and decided on balance that (a) consultation with affected parties was not required, and (b) that it was not appropriate to continue with lock-ups.  One wonders what has changed, apart perhaps from some aggrieved coverage from some members of the media.  As the Governor pointed out, lock-ups are very unusual internationally.  There might have been a case for them 20 or 30 years ago, when citizens and investors couldn’t just download the documents themselves, and were quite reliant on the media for initial reporting and interpretation.  That is no longer so, and the security risks are higher than they were (as the Governor rightly noted, they can’t simply go on relying on trust).  I would urge the Reserve Bank not to reverse itself again, but if they do reinstate lock-ups for a select few media representatives –  whether relying on pen and paper, or totally physically secure environments –  the costs of those privileged arrangements should be borne by the media organisations concerned.

The Governor was also asked why the exclusion of MediaWorks from Bank press conferences had been announced only last week, and not when the inquiry results were released on 14 April (a question I also raised last week).  The Bank simply avoided answering that question.  Simply telling us that this was the first press conference since 14 April told us nothing.  If there were penalties to be imposed on MediaWorks (and exclusion seems sensible) why not announce them when the inquiry report was released –  rather than use that opportunity to praise the helpfulness of MediaWorks legal team?.  What has changed?

Mike Hannah also confirmed that the Bank has no information on whether there had been previous breaches of security, whether by MediaWorks or other lock-up participants.  He stated not only that the Bank was not aware, but that it had not asked.  That seems simply extraordinary, at least as regards MediaWorks.  When MediaWorks approached the Bank and Deloitte on 5 April, surely a very early question –  from either party –  should have been “and has this happened before?” (along with “and who in the organization knew about it?”).  It is a shame media did not pursue the matter further, but we are left with the suspicion that the Reserve Bank really did not want to know too much about what had  gone on, and wanted the whole issue put behind it quickly.    That should not be the standard to which powerful autonomous public agencies operate.

How have big cities done in the US?

I’ve written several times about the apparent economic underperformance of Auckland –  apparent, that is, in the official annual regional GDP per capita data that Statistics New Zealand publishes.

We only have the data for the period since 2000, and no doubt more recent periods in particular will be subject to revisions. And there is noise in the data from year to year.  But whereas in 2000 average GDP per capita is estimated to have been 24 per cent above that in the rest of New Zealand, by the year to March 2015, that margin had shrunk to only 12 per cent.

ngdp akld ronz

That shouldn’t have been happening if the advocates of our “economic strategy” had been correct: between the agglomeration gains from cities, a rapidly rising population increasingly concentrating the population in our one moderately-large city, and all the claimed spillover effects from a skills-based immigration programme, everything should have been set for Auckland to have continued to outstrip the rest of New Zealand.  But it just hasn’t happened –  if anything, rather the reverse.   As I noted the other day, Census data suggest that until the mid 1990s more New Zealanders were moving to Auckland than were leaving.  But even that flow has reversed (albeit on a small scale) over the years since then –  the years that coincide with Auckland’s relative per capita economic decline.

There aren’t comparable official data in Australia (regional GDP data are all at a state level), but in the US the BEA publishes real per capita GDP estimates for each of the metropolitan statistical areas (MSAs).    The data are available from 2001 to 2014.

Here is a chart showing the median real GDP per capita for six areas people often think of when they think of the economic success of US cities (Boston, Houston, New York, San Francisco, San Jose, and Washington DC ) relative to GDP per capita for the US as a whole.

real gdp pc us cities

There is some variability, but over these 13 years as a whole average per capita incomes in these cities –  already much higher relative to the rest of the country than is the case in Auckland –  have increased a little further.  The change over the full period isn’t large –  but nor would one expect it to have been.  But the change is in the direction one would have expected.

Those six cities aren’t all of the biggest MSAs in  the United States.  The others in the top twelve (each with populations above 4.5 million)  are centred on Chicago, Dallas, Miami, Los Angeles, Atlanta, Philadelphia.  If we take the whole group of 12 cities, the median city had average GDP per capita 24 per cent higher than that in the United States as a whole in 2001.  In 2014, that margin has increased to 29.7 per cent.

Of course, in a country with a lot of big cities there is quite a diversity of experiences (different shocks, changing opportunities etc).  In five of these twelve MSAs, average GDP per capita had actually fallen relative to the US as a whole over this thirteen year period.  Most of the falls were pretty small, and might be not much more than normal year to year variance.   But Atlanta did stand out.

atlanta

The fall, relative to the rest of the United States, has been even larger than the relative decline of Auckland.

I don’t know much about the Atlanta economy.  There has been very rapid population growth –  from just over 4 million people in 2001, to around 5.7 million now.   And they have managed that growth while having median house prices of around US$180000, and a price to income ratio near 3.  That is major achievement in its own right.  But it is also one that makes me a little skeptical of claims that fixing Auckland’s dysfunctional housing and land supply market would materially boost per capita income prospects in Auckland (a claim the Productivity Commission has signed up to).

Auckland’s economic underperformance is real, and should be troubling.  It isn’t a “quality problem“, but reflects a serious failure of the economic strategy pursued by both this government and its predecessor.  Fixing the land supply market should be a policy priority in its own right, but it looks like a quite different issue to fixing the issues around Auckland’s overall economic underperformance.  That looks more like the fruit of an immigration policy that funnels huge numbers of people into Auckland, which doesn’t seem to be a natural location for generating lots of  highly-remunerative economic opportunities.  When our largest city has so badly underperformed over fifteen years, despite all the hopes and aspirations, it is time for politicians and official agencies to start facing up to the uncomfortable data.


Twenty companies manufacturing TVs

No, that isn’t a statistic from South Korea or China.  It is New Zealand in 1963.

My in-laws live in Waihi and whenever we are up there I point out to the children the old television factory, just off the main road, and give them a little reminder about the bad old days when New Zealand destroyed value by manufacturing and assembling television sets.  Somehow I must have been under the impression that there was just one television manufacturing factory in New Zealand.

But browsing in a second-hand bookshop the other day, I stumbled on Electric Household Durable Goods: Economic Aspects of their Manufacture in New Zealand, an NZIER Research Paper published in 1965.  There is 15o pages of analysis, statistics and discussion –  not everyone’s cup of tea, but I found it fascinating.

It doesn’t just have information on manufacturing.  There is an interesting reminder of just how many more electrical appliances New Zealand households back then had than their counterparts in other advanced countries.

durables

These sorts of international comparisons probably always have to be treated with some caution, but there is nothing very inconsistent with the data suggesting that at the time New Zealand still had among the highest real incomes per capita anywhere.   Actually, I was a little surprised there were quite so many consumer electrical goods here, since New Zealand had high protective barriers which meant many such things cost more here than in other advanced countries.  But, as the report notes, household electricity prices in New Zealand at the time were around half those in the United States and Australia, and around two-thirds of those in the United Kingdom.   A government commission of inquiry had recently noted that in most areas the price of domestic electricity was below the cost of production and transmission.

The domestic manufacturing of electric household durable goods was largely a result of the very heavy regime of import protection and controls put on from 1938 and kept in place, with varying degrees of intensity, for decades afterwards (that Waihi factory didn’t close until the mid 1980s).  As the NZIER piece notes

Before 1939, production of electric household durable goods in New Zealand, other than electric ranges and domestic radios, was practically non-existent.

Even for electric ranges, the report manages to cite statistics that over 80 per cent of those in use in 1939/40 had been imported.

The import controls which began in 1938 were precipitated by a foreign exchange crisis – which might well have led to a serious sovereign debt default if it had not been for the looming war –  but also reflected an active desire by the government of the day to promote domestic manufacturing (for a variety of reasons, including pessimism about the prospects for (and volatility of) agriculture, a desire for greater self-sufficiency, and so on).

In some sense it worked.  Many firms which had previously been importers and distributors turned to manufacturing.  The NZIER paper quotes from the company history of Fisher & Paykel –  a company established as importers and distributors.

The adoption by the Government in 1938 of a policy of controlling imports by licensing created an immediate problem for Fisher & Paykel Ltd,, as the company was trading principally in appliances imported from the USA. As dollar imports were even more restricted by the new system of import control than those from sterling sources, it became necessary to find alternative means of meeting a demand already barely filled and steadily increasing. The alternative was to produce the necessary appliances within the country, and so, in 1939, Fisher & Paykel entered the manufacturing field.

All sorts of New Zealand and foreign firms set up manufacturing operations here, producing all sort of products on a very small scale.  It individually rational, and often highly profitable, but wildly inefficient.  It took many decades to unwind.

But import licensing was considerably relaxed for a few years in the 1950s (although there were still typically tariff barriers), and there was a brief but substantial resurgence in imports of electrical household durables.  During the brief period of liberalization, annual imports of washing machines (for example) were ten times what they had been in the periods of heavy controls before and after.  Unsurprisingly, during that liberalization period there was some reduction in the number of domestic producers.

But when tight import controls were re-imposed in 1958, the whole focus on developing New Zealand industry was taken still further, with an emphasis on encouraging “manufacturing in depth”, and “since 1958 manufacturers in all industries have been encouraged to increase the ‘local content’ of their production”.

Television has been introduced into New Zealand since 1958 [experimental broadcasts only until 1960] and provides an excellent illustration of the policy in practice.  Not only is the supply of receivers to the New Zealand market the sole prerogative of New Zealand manufacturers, but the manufacture of television tubes and other components in New Zealand has been deliberately encouraged……..where manufacturers are allocated a licence to use overseas exchange which is not tied to any particular product (the so-called “pool” licensing system), it pays to take advantage of the facilities of as local supplier even if some cost disadvantage is incurred.

And thus it was that in 1963 “the number of firms engaged in the manufacture of [TV] receivers (20) constituted a record for the production of any electronic consumer good in New Zealand”.    The number of firms producing componentry is not listed.  The New Zealand Official Yearbook records that in 1963/64 there were 35 firms engaged in “radio and television assembly and manufacture”, producing 113904 TVs and 93676 radios.  The scale (or rather lack of it) is almost beyond belief  –  the average firms was producing just under 6000 units per annum.

Much of the focus of the NZIER is on the (in)efficiency of the New Zealand manufacturing operations.   The author went to some length to get good data, including from foreign firms with manufacturing operations here and abroad. They cite one example of a European manufacturer of radios (a sector where, they noted, the economies of scale were less than those for the production of televisions) who supplied data on the estimated costs of production for different size production runs.  That European manufacturer noted that they typically manufactured in Europe in production runs of 100000, but in New Zealand reasonably large firms typically did runs of around 5000 units.  The cost of production per unit on that scale was around twice that for the European-sized production runs (scaling up to runs of one million units was estimated to produce further per unit cost savings of less than 10 per cent).   Other estimates led the authors to conclude that New Zealand production was typically costing at least twice the “world” price.

The NZIER piece was primarily analytical and descriptive, rather than being policy-focused.  But the author, rather drily, concludes:

If the cost of producing radio and television sets in New Zealand are likely to remain 100 per cent above costs of production in large industrial countries (and on the basis of the evidence presented in chapter VI this is a generous assessment of the higher costs of production in New Zealand) then it is a valid question as to whether the capital and labour now engaged in this industry could not be employed elsewhere to the greater national benefit.

Indeed.

Such staggeringly wasteful economic policies for so long.

(And since we have only continued to lose a little more ground relative to other countries since these particular policies were scrapped, one might hypothesise some ongoing policy problems.  But that isn’t for today’s post.)

(And for anyone wanting a slightly caricatured sense of how things were, I recall this Alan Gibbs speech on New Zealand assembling television sets)


Looking to the FSR

This Wednesday brings the release of the latest Reserve Bank Financial Stability Report.  With pre-release lock-ups having (appropriately) been discontinued, the Governor’s press conference will, for the first time, occur an hour or two after the release.  That will mean that journalists will have had a chance to talk to analysts and industry representatives before questioning the Governor.  In principle, that should make for some more searching questioning and scrutiny.

Presumably the document will focus on the two main areas of credit exposure in the New Zealand financial system: dairy, and housing.

It isn’t that long since the Bank released the write-up of the dairy stress test it did with the major rural lending banks last year.  I thought that write-up was a bit too optimistic  – in particular, it was based on a stress test assuming a fall in dairy farm prices much less than the fall in Auckland house prices that they had assumed in their earlier housing shock stress test – but I don’t see any reason to change my view that the dairy book does not represent a systemic threat to the soundness of the New Zealand banking system.  It would be good to see a discussion this time based on some less positive scenarios, (and hopefully without the Governor taking on the mantle of a politician in trying to offer guidance to –  or exert moral suasion on –  banks as to how they should deal with farmer clients).

But most interest is likely to centre on the Bank’s discussion of the housing market, any resulting risks it sees to the health of the financial system, and whether the Bank is planning to devise yet more direct regulatory controls on banks’ housing lending activities.

On the policy front, the best thing they could do would be to simply abolish the various LVR restrictions puts in place over the last three years.  Those restrictions were ad hoc, ill-grounded, intrusive, and unnecessary.  If the Reserve Bank has concerns about the ability of the banks to withstand severe adverse shocks –  and if they do, those concerns have not been laid out in public backed by robust analysis – it is free to propose, and consult on, requirements for banks to fund a larger share of their assets from capital rather than deposits.  Capital requirements are less costly, less intrusive, and require considerably less knowledge by offficials.

Of course, the Reserve Bank won’t be lifting the restrictions, and the real interest seems to be whether the tentacles of this one-man branch of the administrative state will extend even further into the business operations of private companies (and their customers). Will LVR limits be further refined, and extended?  And will the Bank decide to try (consulting on) limits on the debt to income ratios of borrowers?

Consistent clear communication has not been the Governor’s strong point, so in a sense it is anyone’s guess.    The Reserve Bank does have a non-binding Memorandum of Understanding with the Minister of Finance on (so-called) macro-prudential policy.  In that document, the Bank undertakes that

The Bank will consult with the Minister and the Treasury from the point where macro-prudential intervention is under active consideration, and will inform the Minister and the Treasury prior to making any decision on deployment of a macro-prudential policy instrument.

We have heard noises from the Prime Minister about possible land taxes, but nothing about new banking regulatory controls.  And, although the document is non-binding, limits on debt to income ratios are not, at present, included in the MOU’s list of possible instruments “considered useful in the New Zealand context”.   That said, debt to income limits were preferred by The Treasury to the Auckland investor LVR restrictions imposed last year.

If the Reserve Bank is going to propose yet more new controls, one can only hope that the rationale, and supporting analysis, will be done to much higher and more demanding standard than what was offered in 2013 when LVR limits were first imposed, or last year when the investor restrictions were introduced, and the regional differentiation of LVR limits was imposed.  One of the things I pointed out then was how little research the Reserve Bank seemed to be doing, or publishing, in support of its new enthusiasm for direct controls on the banking system.  That doesn’t seem to have changed.

There has not, for example, been a single Discussion Paper, Analytical Note, or Bulletin in the last 18 months on the efficiency of the financial system and the way regulatory imposts affect efficiency, or any cross-country research evidence on what marks out financial systems that have had domestic financial crises from those which have not.    No more has been heard recently of the loose comparisons they attempted to draw last year between New Zealand and the experience in Ireland and the United States, but instead of replacing those comparisons with more in-depth research and analysis there has just been silence.    Given (a) the scale and nature of the Bank’s regulatory interventions and inclinations, (b) the potential size of the risks, and (c) the significant research resources they have been funded for, that silence doesn’t seem very satisfactory.

It would, for example, still be good to know whether the Bank has been able to identify any examples of countries with banking systems which have come under severe stress from housing lending when

(a) there is little of no direct government intervention in housing finance,

(b) when debt to income ratios have been little changed from those over the previous decade, and

(c) in a floating exchange rate country.

As the Bank has noted previously, vanilla housing loans have rarely, if ever, been at the heart of a systemic financial crisis.  For all the worries about Ireland, for example, the problems there were mostly those of speculative building (commercial property in particular, but also residential), and a monetary system that meant interest rates were set for German and French conditions, not those in Ireland itself.

The Reserve Bank Act sets out the bare minimum of what Financial Stability Reports must contain

A financial stability report must—

a)  report on the soundness and efficiency of the financial system and other matters associated with the Bank’s statutory prudential purposes; and
(b) contain the information necessary to allow an assessment to be made of the activities undertaken by the Bank to achieve its statutory prudential purposes under this Act and any other enactment

Typically FSRs have not done the basics well.  The Reserve Bank might prefer that “efficiency” did not feature so much in the various bits of legislation it is responsible for, but Parliament has chosen otherwise.  And yet the reporting on the efficiency implications of regulatory policy has typically been quite weak –  and there has been no research the Bank has done to draw on or refer to.  In one sense, it may not have mattered much when the Bank’s policy approach was fairly non-intrusive.  But the current Governor clearly believes he is better able to determine the structure of banks’ loan portfolios than they are.  However, he has offered no analysis of the efficiency implications of his choices, or even a discussion of how best to think about the issue.

It is now almost three years since the first LVR limits were announced.    Surely we should also be expecting to see some good empirical analysis of what impact those restrictions have had?  And not just on the things the Governor cares about –  house prices and financial stability –  but the side-effects and distributional implications that got so little attention in the regulatory impact assessment the Bank prepared when it imposed the policy.    The investor finance restrictions are newer, so it will be hard to provide much concrete analysis of the impact just yet, but the Act requires them to make the effort.   Of course, it isn’t enough simply to say ‘house prices are materially higher than they were when the regulatory restrictions were imposed’  but citizens might reasonably ask what useful impact these intrusive new controls –  imposed on the whim of one unelected individual –  have had?  And how, for example, does the Bank think banks themselves have responded?  Since the banks are profit-maximizing entities, and the Reserve Bank has constrained one line of business, where have banks sought profits instead?  And can we be confident that even if the level of risk in the directly-constrained books has been reduced slightly, that the restrictions have made any difference to the overall riskiness of the banks, and the system?

There may well be good answers to these questions, but so far there has been little sign of the Reserve Bank providing the analysis that would enable us to be comfortable.  And recall that providing the material necessary to allow readers to assess the Bank’s regulatory activities is not an optional extra, but a statutory requirement.

Of course, to make the point is also to recognize how weak the system actually is for promoting effective accountability:

  • The Governor personally decides on all the regulatory measures, and is also personally responsible for the contents of the FSR.  It isn’t plausible to expect that FSRs will ever contain anything suggesting doubts about choices a Governor has made, and it is unlikely that they will ever contain a balanced and comprehensive set of material allowing readers to draw their own conclusions. The Act describes the FSR as an accountability document.  In fact, it is better seen as a marketing document.
  • The Bank’s Board has some responsibility for scrutinizing the Governor, including around FSRs.  But the Board has limited resources, is too close to management, and has a track record of seeing its role as being to provide cover for the Governor, and to assist the Bank in its outreach activities (see last year’s Annual Report).  The Minister’s recent letter of expectations, which explicitly asked  the Board about the balance between soundness and efficiency may help a little, but it is going to be difficult for the Board to ever adopt anything other than a pro-management perspective.
  • Parliament’s Finance and Expenditure Committee has limited resources for scrutiny.

There is never going to be perfect scrutiny or accountability, and being a small country brings inevitable resource constraints.  But there are some possible institutional improvements.  For example, a separation of the role of chief executive of the institution from that of policy decision-making would be a step in the right direction.  And I’ve argued previously that there is a case for something like a Macroeconomic Policy Council, a small body that would have responsibility for undertaking or commissioning independent reports on aspects of the conduct of fiscal analysis and policy, monetary analysis and policy, and financial regulatory policy.  Operating at arms-length from the Reserve Bank and Treasury, such a body would contribute to a better quality debate on policy issues in these areas, and help provide the assurance to citizens, and MPs, that the quality of policy, and of supporting policy analysis and advice, was running consistent up to the sort of standard we should expect.  Our current system puts too much legislative weight on self-assessments (in the case of the Bank, both for MPSs and FSRs).  They typically don’t happen to any great extent at present, and it is probably unrealistic to think that institutional incentives will ever allow them to happen in a way that offers much genuine insight on policy choices and analysis, and certainly not when the results might be awkward for the institution and individuals publishing the self-assessment.  If we are serious about scrutinizing powerful unelected individuals wielding huge discretionary powers, which we should be, that really needs to change.

By the way, it is worth remembering when the FSR comes out that the Reserve Bank has no statutory responsibility for the housing market.  It has just two main roles:

  • maintaining a stable general level of prices, and
  • using its various regulatory powers to promote the soundness and efficiency of the financial system.

Dysfunctional housing markets are a matter for elected national and local government politicians.


Technology, Bill Gross, and prime-age employment

Bill Gross, the renowned US bond manager, puts out a monthly Investment Outlook opinion piece, a public outlet for some of his ideas and concerns.  I used to read them quite regularly, and although I don’t do so these days, somewhere I saw a reference to the latest issue, and so dug it out.

His focus this month is on the advance of technology and the possible threat to the future employment opportunities of people in advanced countries.  Among his possible solutions is a Universal Basic Income –  as he notes (and despite the recent flurry of interest on the left in New Zealand) it has also had significant support on the right, especially in the US.

The centerpiece of his discussion is this chart

Chart I: Advance of the Robots, Retreat of Labor

Bill Gross March 2016 Chart
Source: U.S. Bureau of Labor Statistics

As he describes it:

As visual proof of this structural change, look at Chart I showing U.S. employment/population ratios over the past several decades. See a trend there? 78% of the eligible workforce between 25 and 54 years old is now working as opposed to 82% at the peak in 2000. That seems small but it’s really huge. We’re talking 6 million fewer jobs. Do you think it’s because Millenials just like to live with their parents and play video games all day? I think not. Technology and robotization are changing the world for the better but those trends are not creating many quality jobs. Our new age economy – especially that of developed nations with aging demographics – is gradually putting more and more people out of work.

It is certainly a rather bleak picture, for the United States.  But it isn’t remotely representative of the experience across the advanced world.

The OECD only has detailed annual labour market data to 2014.    In the US, as Gross illustrates, the employment to population rate in 2014 for the 25 to 54 age group was 3.0 percentage points lower than it had been in 1990.   A handful of countries had done even worse – Estonia, Finland, Greece and Sweden (three of them countries with little or no macro policy flexibility, now inside the euro).  But the median OECD country (for which there was data right through the period) had employment to population rates 2.6 percentage points higher in 2014 –  when most Western economies weren’t exactly buoyant –  than in 1990.  New Zealand did better than the median, being 5.8 percentage points higher than in 1990.

employment to popn change

In fact, in eight of the 34 OECD countries, employment to population ratios for 25 to 54 year olds in 2014 were at the highest levels they had been in the last 25 years.  On the other hand, 14 countries had employment to population ratios for this age group that were more than 3 percentage points below the 25 year peak.  Perhaps unsurprisingly, 12 of them were euro-area countries, plus the United States and Sweden.

But employment to population ratios are quite substantially affected by the economic cycle.  Participation rates  –  those employed and those actively seeking work – are less severely affected.

participation rate 2104 less post 1990 peak

The participation rates for these prime-age people in 2014 were higher than they had been in 25 years for fully a third of the OECD countries (11 of 34, including New Zealand).  And another 13 countries had participation rates in 2014 within 1 percentage point of the peak (participation rates are somewhat cyclical, and in few countries was 2014 a year of intense cyclical pressure on labour resources).  The US was among a very small handful of countries where the participation rate was still well below the previous peak.

And here is how the US experience compares (and contrasts over the last 15 or more years) with that of the median OECD country, in a chart going back to 1980.

e to popn since 1980

Looking at the participation rate, the contrast is even more striking and appears to have begun earlier.

partic rate since 1980

Quite what is going on in the United States is an interesting question, but it looks to have been quite idiosyncratic.

Perhaps the answer lies in technological developments.  In much of the economy, the US represented the technological frontier for several decades.  But as an explanation it doesn’t really ring true when the US experience is contrasted with that of a bunch of similarly high-productivity (GDP per hour worked) northern European countries.

And perhaps there is a future to worry about in which there won’t be jobs for many of those who want them.  But it does seem to have been a recurrent worry, going back at least as far as the Industrial Revolution, and –  so far at least –  the concern hasn’t come to anything very much for the economy as a whole.  Productivity gains enable society to have more for the same, or fewer, inputs: labour once used to, say, connect telephone calls now does other stuff.  In general, therefore, productivity gains are something to celebrate, and if anything the concern in the last decade or so has been how weak underlying productivity growth appears to have been.

Of course, at least when the public sector is concerned, genuine productivity gains resulting from the application of technology don’t always free up any labour anyway.   My local community newspaper reports this week that the Wellington City Council libraries are introducing a new RFID self-service book-issuing system, which will “be quick and make using the library simpler”.  What’s not to like about that?  Cost savings should  flow from that, I thought, which should be welcomed by the ratepayers.  But no.  Instead:

The council’s community facilities leader, councilor Sarah Free, said the upgrade would offer users the best of modern technology.  … “I’m pleased to say there will be no staff reductions as a result of this upgrade”.

Perhaps there really is a revealed need for additional staff who will “focus on helping people find specialized resources or use library services”.  It feels a bit like gold-plating to me –  a council always keen to spend money, and rarely to save it – but in a sense in just illustrates the way in which the nature of jobs changes as technology advances without –  as yet –  any sign that it leaves large chunks of the population, who want to work, unable to find work.


A belated price for the OCR leak

More than three weeks after the Reserve Bank released the results of its OCR leak inquiry comes news that the Bank has finally taken some specific action against MediaWorks, the media group responsible for the leak.  We learn today –  although not via a open release from the Bank –  that representatives

“from Mediaworks news outlets are excluded from Reserve Bank media conferences until further notice”

In the Reserve Bank’s release on 14 April there was no hint of any specific sanctions for MediaWorks.  Instead, taking the opportunity to tar junior staff (and me), the Governor lauded MediaWorks management, noting that:

Deloitte was assisted in its investigation by Mediaworks’ legal team, who undertook an internal investigation, uncovered emails that confirmed the leak, and reported these to Deloitte.

The leak prompted the Reserve Bank (quite appropriately) to discontinue lock-ups for media and market analysts, but to the extent that was a penalty it was one imposed on all those who had previously participated (and was, perhaps, a greater burden on some of the more specialist entities).

Unfortunately for the Reserve Bank, it quickly became clear, upon reading the Deloitte report, that MediaWorks management must in fact not have been terribly helpful, at least until very late in the piece.

It is possible that MediaWorks senior management, including the former chief executive Mark Weldon, was not aware there was even an issue until 21 March.  The leak had occurred on 10 March, and although I drew attention to it that day (both directly to the Bank and, later, on a post here), it only got attention and coverage in the mainstream media on 21 March.    But at that point it got considerable coverage, and there is no way the senior management of a major media organization, with their own corporate Group Head of Communications, could not have been aware there had been a leak.  At that point, it would presumably have taken no more than an hour to have had the internal IT people check the emails of the MediaWorks staff in the lockup (even if they had no knowledge or suspicion of their own organization’s involvement, just to be on the safe side). That would have confirmed that MediaWorks was the organization responsible.

At that point, as the Deloitte team was (by their own account) only just turning their attention to media outlets as the possible source of the (then) possible leak, MediaWorks could have come forward and alerted the Reserve Bank to their responsibility.   That would have looked like full and early cooperation.  Even better, they could have pro-actively told the Bank, and Deloitte, how long this practice, of journalists emailing draft stories back to the office from the lock-up, had been going on.  There is no suggestion in the Deloitte report that what happened was just an accident (someone hit the wrong key on their laptop).

In fact, the Deloitte report makes it clear that MediaWorks did not approach either them or the Reserve Bank until 5 April, more than two weeks later, and then only when the Deloitte team sought meetings with each media person who had been in the lock-up.  At that point, presumably, the staff concerned and their managers left senior management with little option.

It isn’t really that clear why the Reserve Bank gave so much cover to MediaWorks in their 14 April statement.  A simple statement that MediaWorks had not approached the Reserve Bank until more than three weeks after the leak had occurred would have been considerably more appropriate than the positive statement on the role of the MediaWorks legal team. They were, no doubt, working largely to protect the interests of their own organization –  an organization which has been notably unforthcoming in answering questions about just really went on, who had sanctioned these breaches of the lock-up rules etc.

I suspect the answer to my question has something to do with the Reserve Bank’s desire to play down the whole episode.  Their systems were shown to have been very weak, and totally reliant on trust. It took no sophisticated signaling techniques for this leak to occur –  just clicking Send on an email.    Systems that might have reasonably robust 20 years ago –  when lock-ups were more useful, because ordinary readers couldn’t simply download the MPS at 9am and read for themselves what the Bank had to say –  simply hadn’t kept up.  The Bank has accepted no responsibility for that, or released any internal reviews it has undertaken as to how such vulnerabilities were allowed to arise.

But the inquiry also raised some questions about just how seriously the Reserve Bank itself had taken the issue in the first place.  Had they really taken seriously the possibility of a leak they could have taken action on 10 March.  I had suggested to them that morning that they focus on media outlets.  It wouldn’t have taken much effort for the Bank – Governor and Deputy Governors – to have rung the heads of each media organization in the lock-up  (I’m not sure how many that would be, but I’m assuming no more than 20) and asked them to (a) check emails of all of their staff who had been in the lock-up, and (b) arrange for signed statements to be prepared by all those in the lock-up swearing that they had not been responsible.  Had there in fact not been a leak (and the Reserve Bank couldn’t be sure then) it wouldn’t have cost much.  As it was, it surely would have identified the culprits within hours.    Instead, we learn that the Deloitte inquiry did not focus on media until after they met me on 18 March –  more than a week later –  and as late as 21 March the Bank was on record as talking only of “allegations” of a leak.

To be frank, given the Bank’s general attitude to me, and their unease about the issues I have been raising, and the questions I’ve been posing, I can understand why they might have been a little wary.  But the fact remains that, for all the Governor’s huffing and puffing about whether I told them what I knew at 8:30 or 9:08, they don’t seem to have done much with the information for several days at least.  And when they finally did discover the truth they appear to have been at pains to help protect MediaWorks’ corporate image.   There are still unanswered questions about whether MediaWorks was shown the draft Deloittle report, and whether it was given the chance to comment on the Reserve Bank’s press release in draft.

But this all brings us back to the question as to what has changed now (other than the CEO of MediaWorks).  Banning MediaWorks from Reserve Bank media conferences for a time seems like a reasonable sanction, but why wasn’t it done three weeks ago?  Since the Governor never acknowledges mistakes, and rarely makes himself available for interviews, perhaps we’ll never know. Then again, perhaps someone will ask at the FSR press conference next week.  They might also ask what “until further notice” means.  What are the conditions that MediaWorks has to meet?  Such an indefinite suspension seems unwise, and could give rise to speculation that the suspension might be lifted if MediaWorks outlets were seen to be covering the Bank in a not-unfavourable light.  Better, probably, to have banned them for three or six months, and then put the matter behind them.  And if the conditions for lifting the suspension don’t relate to the tone of the coverage of the Reserve Bank, do they relate to getting fuller and more complete answers from the new management about just what had been going on?  That might not be an unreasonable stance to have taken, but the Bank should be upfront about it.  As it is, we were left with the impression on 14 April that the matter was over as far as the Bank was concerned.

There is still a series of questions outstanding for both the Reserve Bank and MediaWorks.  Those for the Reserve Bank concern me most, because the Bank is a powerful public sector organization, which really should be much more upfront with the public when things go wrong (as inevitably occasionally they will).  I hope that some light will be shed on some of those questions when a series of Official Information Act and Privacy Act requests I have lodged with the Bank (and its Board) are answered.  Those answers are due in a couple of weeks, and I suspect that the Reserve Bank will delay responding just as long as it possibly can.

UPDATE: The question of why the Reserve Bank provided such cover to MediaWorks is deepened if this piece by John Drinnan is accurate.

The report talks about workers, but I understand senior news staff received the leak. I spoke to a Bank spokesman at the time the Bank stopped lockups, and it was unhappy about the way it was dealt with.

If the Bank was really unhappy, why imply otherwise, commending the assistance of MediaWorks?


“Quality problems”

Sometimes I find the Prime Minister’s claims about the New Zealand economy, and Auckland, almost breathtaking.  There is an insouciance about them that almost defies belief. They certainly defy data.

In a speech to an Auckland business audience yesterday –  there is a report here, and also video footage –  the Prime Minister repeated his breezy claims that Auckland’s “challenges” around housing and transport are “a quality problem”, and a “sign of success”, and that both the city and the country are doing “incredibly well”.

Perhaps that is how it appears when you are already wealthy, live in a large house in a prime inner suburb, and have a taxpayer-provided chauffeur at your constant disposal.  Neither housing nor traffic problems must impinge terribly much.

I’ve commented on a lot of the detailed issues previously, including the Prime Minister’s apparent vision of New Zealand as a Switzerland of the South Pacific, and am not going to go through all the detail again here.

But let’s just repeat some of it in summary:

  • Auckland has some of the highest house price to income ratios anywhere in the advanced world.  And we know that there are plenty of larger fast-growing cities in the United States where prices and price to income ratios are much lower.  Auckland prices –  and actually those in much of the rest of the country –  are a sign of policy failure, not a sign of success.
  • Despite extremely rapid population growth  –  relative to the rest of the country, and by the standards of largest cities in OECD economies –  Auckland’s economy seems to have been persistently underperforming.  The sheer size of the economy keeps growing, but per capita income growth has lagged behind.   Using SNZ regional nominal GDP data, Auckland average incomes were 12 per cent above those in the rest of New Zealand in 2015, but they had been 24 per cent higher in 2000. A curious definition of success.  We don’t have regional real GDP data, but the ANZ’s regional trends indicators (which try to proxy regional real GDP growth) suggest much the same sort of underperformance, dating back even further than 2000.  Per capita income growth supports living standards and consumption growth prospects.  Auckland’s economy has been seriously underperforming on that count, despite all the rhetoric about the importance of agglomeration gains in our one moderately-large city.

As it happens, for most of the last decade even the unemployment rate in Auckland has been consistently higher than that in the rest of the country, even though Auckland has a much deeper labour market and one might have supposed that matching labour demand and supply in a changing economy would be that much more frictionless there than in other regions.

auckland U
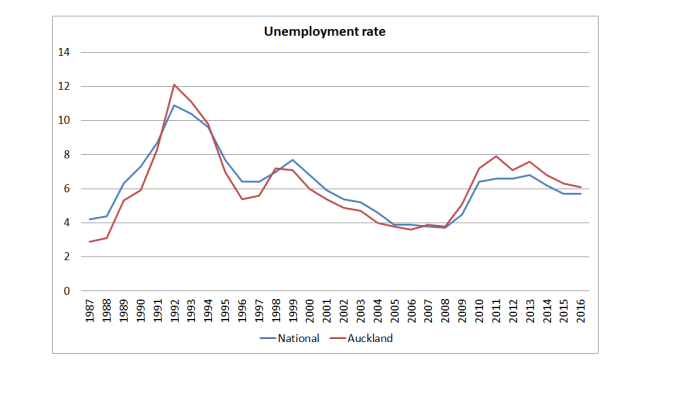
And it isn’t just that Christchurch has had a very low unemployment rate through the repair and rebuild period.  Graphing the Auckland unemployment rate against that of the median region produces much the same picture.

The Prime Minister goes on

“You’ve got net migration not just strong from India, China and Australia but actually net migration from around the country,” Key said.

Well, sort of.    Actually, in the last year around a net 3500 New Zealanders left for Australia, and a slightly smaller (net) number of Australians arrived.  Net inward migration is not a trans-Tasman phenomenon at present –  except, of course, in the sense that a more usual state of affairs has been a large net outflow.

In fact, our net inward migration results almost entirely from the government’s immigration policy choices.

I hadn’t really appreciated the extent of the increase in the number of people arriving on work and residence visas (ie every single one needing explicit government approval) in the last couple of year.

plt arrivals work and residence
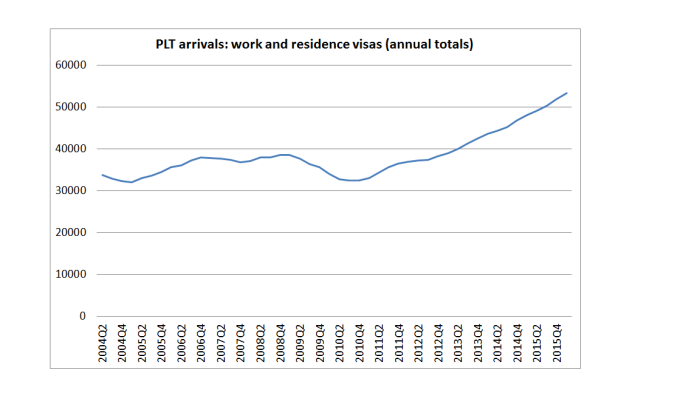
And the massive increase in student visa numbers (mostly to second tier non-university entities), many of whom later acquire residence, is on top of that.

All of which might be a cause to celebrate if there were any sign that these massive migration inflows –  probably the second strongest wave of immigration in the last 100 years – was doing any good in lifting the incomes or living standards of New Zealanders (and particularly Auckland, where the largest proportion of migrants end up).

But there seems to be no evidence of that at all. Certainly government agencies haven’t been willing or able to produce any.  If anything, there is reason to worry that the policy-driven influx of people is undermining income prospects of New Zealanders.

And what about the claim that people are coming to Auckland (“net migration”) from the rest of the country?  That really caught my eye when I saw it yesterday. Perhaps the Prime Minister has access to some data not generally available, but it isn’t the story in the official data, and hasn’t been for sometime now.

In our quinquennial censuses Statistics New Zealand asks where people were living five years previously, which enables them to produce data on internal migration.  As censuses have long been done at five yearly intervals, that generally provides a comprehensive estimate (and I stress “estimate” because not everyone who fills in the census seems clear on where they lived five years previously).  Because of the Christchurch earthquakes, the scheduled 2011 census was postponed to 2013.  The results of that census give us a picture of internal regional migration from 2008 to 2013.

internal migration 08 to 13
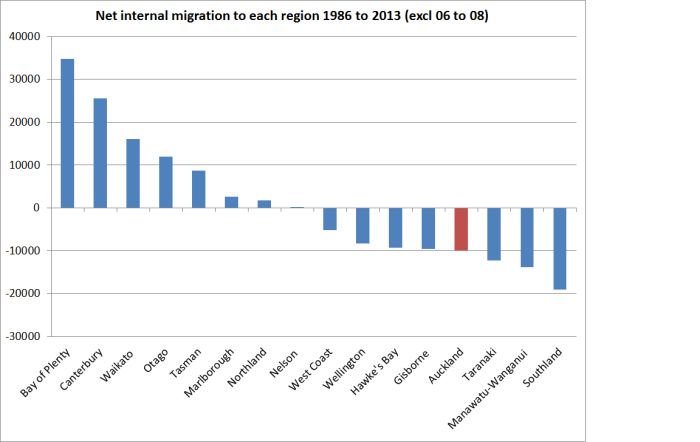
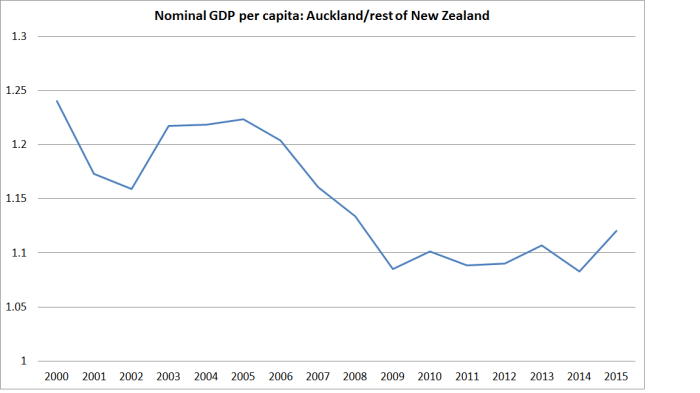
Net, a small number of New Zealanders left Auckland for other parts of the country.  Relative to Auckland’s population, the estimated outflow is tiny, but there is just no sign of New Zealanders flocking to the “success” of Auckland (and note that this period includes the outflow of people from Christchurch in couple of years after the earthquakes). Perhaps things have been different in the last three years, for which we don’t yet have data.

But if so, it would be quite a reversal. SNZ has compiled this data back  as far as the 1986 to 1991 five-yearly period.  The last five yearly period in which Auckland experienced a net inflow of people from elsewhere in the country was from 1991 to 1996.

Here is chart which covers the estimated net internal migration to each region for the period 1986 to 2013 (with the two years 2006 to 2008 missing, because they weren’t captured by any of the censuses).

internal migration 86 to 13.png

Internal migration has certainly happened on a significant scale (gross and net).  But, net, it hasn’t been to Auckland.

Add in the huge outflow of New Zealanders to other countries (mostly Australia) over that period, and it looks a lot like New Zealanders avoiding Auckland.  And that shouldn’t really be surprising: despite its really pleasant physical location, housing has become increasingly unaffordable and income growth has lagged behind.    Other places do worse (as a share of population), but Auckland was supposed to the beacon of opportunity and our future economic prosperity.

Of course, one can always attract foreigners from poorer countries,  and that is what successive governments have done (especially, in effect, in Auckland).  But that isn’t a sign of economic success.  It is, instead, an economic (and social) strategy (“critical economic lever” is MBIE’s term), and one which increasingly looks to have failed –  at least if the benchmark is, at it should be, benefits to the living standards and incomes of New Zealanders.

As for the Prime Minister’s final claim, that the New Zealand economy is doing “incredibly well”, words almost fail me.  At a cyclical level, our unemployment rate at 5.7 per cent is still uncomfortably high (and much higher than it was when the government took office, and currently the same as Australia’s when we’ve typically managed better unemployment outcomes).  Productivity growth –  whether labour or MFP – remains mediocre at best, and there is no sign whatever that New Zealand is making up any of the ground lost relative to other OECD countries in the last 50 years or more.

Most people in New Zealand who want to work have jobs, and material living standards for most are still quite comfortable.  But it is the continuation of a long slow relative decline.  And nothing the current government –  or its predecessor –  has done has done anything to begin to reverse that decline.  The big-Auckland “strategy” does increasingly look to have been something really quite bad, worsening living standards for Aucklanders (especially in conjunction with the “rigged” dysfunctional land supply market), and dragging down prospects for the rest of New Zealand.

As I said at the start, the insouciance in the face of all this underperformance almost defies belief.  But what matters much more is that it simply defies the data.