I’ve used here before the snippet from older books that in the decades before the Second World War it was generally accepted that New Zealand had the highest value of foreign trade per capita of any country. Estimates of historical GDP per capita suggest we also had among the very highest levels of real GDP per capita.
That was then. Yesterday I noticed this tweet from a Herald journalist. I presume the chart was taken from The Treasury’s Briefing to the Incoming Minister.
2021 wasn’t a great year for comparisons, since our border had been largely closed, directly affecting exports and imports of tourism services, but perhaps it was the most recent complete data Treasury had back in October.
This is the New Zealand story in isolation, for as far back as the quarterly national accounts data go.
You might discount the peak in 2000 (coincided with a shortlived trough in the exchange rate), but however you look at the chart, external trade as a share of GDP hasn’t been growing for 30 years. In the last decade it has been shrinking. Ministers and trade lobbyists, touting their preferential trade agreements, would prefer you didn’t notice these actual outcomes.
How does New Zealand’s experience compare to that of the other OECD countries (large and small)? The OECD database is complete from 1995, so here is the change in the average share of exports and imports from then to 2022.
Most OECD countries have seen quite a big increase in foreign trade shares over that period. Some of that will have been a rise in trade in intermediates. One could look at the OECD data on trade in value-added, but there is a multi-year lag in the availability of that data..
Can you spot New Zealand? That’s us over on the very far right of the chart, one of just a handful of countries to have had no growth in foreign trade as a share of GDP over those decades (as it happens - and I’m not here arguing causation – each of that handful of countries have been long-term OECD productivity underperformers).
What about the level of trade as a share of GDP (which is what that Treasury chart is showing). Here is the 2022 data for all the OECD countries (in case you are worried that pandemic effects are still distorting the picture the 2019 chart is very little different).
There are two regularities when looking at the extent of cross-country trade, neither very surprising:
all else equal, big populous countries tend to do less foreign trade (share of GDP) than smaller ones, and
all else equal, remote countries tend to do less foreign trade (share of GDP) than ones close to lots of other (advanced) countries.
Most OECD countries aren’t large (22 of 38 have populations of 12 million or less) and most of them are close to other centres of advanced economic activity.
What of New Zealand? We have the 5th lowest foreign trade share of any OECD countries. Of the four lower than us, three are large countries and the fourth (Australia) has a population five times our size. Every single other small country has trade shares higher than New Zealand’s. In all but Israel’s case, materially higher, and Israel is another example of a country fairly geographically remote (surrounded by plenty of other countries but not wealthy advanced economies, and wealthy advanced economies tend to trade a lot with other countries like them).
And if you inclined to read this and note it as just one of those things, here is how New Zealand stood in 1995.
Not great…..and still smaller than all the small OECD countries other than Greece…..but a substantially different picture than the 2022 one, and one that does not flatter New Zealand.
(And yes, for many purposes it does make sense to discount the numbers for Ireland and Luxembourg, but doing so won’t really change the underwhelming picture of New Zealand’s place among OECD countries.)
In my post on Monday I drew attention (again) to the fact that New Zealand has made no progress at all in reversing the decline in relative economywide productivity (relative to other advanced countries) since what was hoped to be a turning point, with the inauguration of widespread economic reforms after the 1984 election. If anything, the gaps have widened a bit further, and more countries (most former Communist ones) have entered the advanced country grouping, first matching and now overtaking us. Despite being so far behind the OECD leaders there are also clear signs that labour productivity growth has slowed further in the last decade or so.
All that discussion proceeded using simple measures of labour productivity (real GDP per hour worked). The data are readily available for and are more or less comparable across a fairly wide range of countries, and there is meaningful levels data. Labour productivity is a common measure in such discussions, even though total (or multi) factor productivity (TFP or MFP) is the in-principle preferred measure. It is the bit of growth in output or output per capita that can’t be explained just by the addition of more inputs (labour or capital). Some decades ago the late Robert Solow, recently deceased, observed that in modern economies perhaps 80 per cent of the growth in output per capita had been attributable to TFP.
It is a line that should be taken with several pinches of salt since in practice (a) TFP is an unobservable residual, and b) much of the innovation and new knowledge often thought of as the basis for TFP growth is probably embedded in better human and physical capital and the disaggregation is a challenge (to say the least). Thriving economies are likely to have better smarter people, better tangible and intangible capital, all used in better smarter ways etc.
But with all these caveats I thought it might still be worth having a fresh look at the OECD’s MFP data for the last few decades. They only have MFP (growth) data for a subset of (24) member countries (mostly the “old OECD”, and including none of the central European countries). For New Zealand, the first MFP growth data is for 1987, and with the annual data available only to 2022 that gives us 36 years of data.
There is a lot of year to year noise in the series, but for illustrative purposes I simply split the data in two, to compare the record for the 18 years to 2004 with the 18 years to 2022. As it happens, the global slowdown in productivity growth in leading economies (US and northern Europe) can be dated to about 2005.
New Zealand averaged annual MFP growth of 0.9 per cent in the first 18 year period, and only 0.2 per cent per annum in the second 18 year period to 2022. It is a pretty dire picture. (All data in this post use arithmetic averages, but using geometric would not make any material difference.)
Now, champions of the reform story might be tempted to look at that simple comparison and say something like “yes, you see. In the wake of the decade of far-reaching reform New Zealand made real and substantial economic progress, but then after the reform energy faded and drift took hold it all faded away to almost nothing.
Unfortunately for that story, here is how New Zealand MFP growth record compares (on the OECD’s particular methodology) for New Zealand and (the median) for the other countries (most of them) for which there is a complete set of data.
We all but matched the average growth performance of those other advanced OECD economies in the earlier period, in the wake of our reform process, but even then didn’t do well enough to begin to close the large levels gaps that had opened up in earlier decades. And then in the more recent period, we’ve done worse again: the comparator group (typically richer and more productive, nearer the productivity frontiers) slowed markedly, but we slowed a bit more still. When you start so far inside productivity frontiers there is no necessary reason why New Zealand could not have made some progress closing the gaps even if the frontier countries themselves ran into difficulties. But no. (Over that second 18 year period when New Zealand averaged 0.2 per cent per annum MFP growth, South Korea - also well inside productivity frontiers on an economywide basis – is estimated to have averaged 2 per cent per annum MFP growth).
It is only one model, and only one set of comparators but there is simply nothing positive in the New Zealand story. There is, and has been, no progress in closing those gaps, and our living standards suffer as a result.
And what of Solow’s 80 per cent? In New Zealand real GDP per capita increased by an average of 1.7 per cent per annum between 1987 and 2004. MFP growth averaged 0.9 per cent over that period. For the period 2005 to 2022 average annual growth in real GDP per capita increased by an average of 1.4 per cent per annum, but over that period MFP growth averaged just 0.2 per cent per annum. (The comparisons are no more flattering if one uses the OECD “contributions to labour productivity growth” table as the basis for comparison.)
Whichever measure of productivity one looks at the New Zealand performance is poor. Champions of reform 40 years ago would, I think, have been astonished if they’d been told how poorly New Zealand would end up doing. I hope they’d be even more alarmed at the indifference to that woeful record that now seems to pervade official and political New Zealand.
[And since I’ve already had one past champion of the reforms objecting to my characterisation in this post and Monday’s post, I’m equally sure that all serious observers now - ie excluding our political leaders and officials - have their own story about what else should (or in some cases shouldn’t) have been done over recent decades. That doesn’t change the fact - on my reading and my memory – that if asked in say 1990 most would have envisaged several decades of catch-up growth as the decline of the previous decades was slowly reversed. It is quite clear from the documentary record that that was the goal, and the intense political disputes of the era were not about that goal.]
2024 will mark 40 years since the great acceleration of policy reform that began with the election on the 4th Labour government in July that year and ran for the following decade or so. I’m sure there will be lots (and lots) of reflections on the period later this year, most especially from the left where the ongoing political angst seems greatest (yes, it really was a Labour Cabinet that kicked off the process and did many of the lasting reforms, much as some on the left remain very uncomfortable about that).
If one thought about the big economic issues that were around at the time, they could probably be grouped under three broad headings:
inflation
fiscal deficits and government debt, and
productivity
One might add to the list the balance of payments current account, which became no longer a policy problem once capital controls were lifted at the end of 1984 and the exchange rate was floated in early 1985. (Yes, recent deficits have been very large, but as a symptom of other imbalances, rather than a policy issue in its own right.)
Of that list, New Zealand has done fairly well on the first two items.
We used to have among the worst inflation record among the advanced countries (high and variable), but in recent decades we - like most advanced countries - have done much better. The last three years have been a bad lapse, but if that never should have been allowed to happen, the ultimate test is whether things are got back under control, and we seem now to be on course for that (eventually the lagged infrequent data will emerge). I’m not here going to get into lengthy debates about other countries, but whatever the common shocks once a country floats its exchange rate its (core) inflation outcomes over time are its own choices (see Turkey for any doubters).
We’ve also done pretty well on fiscal policy imbalances. There are plenty of leftists around who think taxes and spending should have been, and should now be, higher, but my focus is imbalances (deficits and debt). Again, the last few years (post Covid spends) have been bad, but under governments led by each main political party, New Zealand has over decades done a reasonably good job of keeping debt low and reining back in deficits when they have first blown out. And our system of fiscal policy transparency is pretty good too (although like almost anything could be improved).
One could throw financial stability into the mix. Almost every country that liberalised in the 80s ran into serious financial sector problems a few years later (neither the private sector lenders and borrowers nor the putative regulators really knew what they were doing, perhaps unsurprisingly after decades of financial repression), but the last 30 years have been pretty good. Lots of finance companies failed 15 years ago, which wasn’t necessarily a bad thing (risk and failure are integral parts of a market economy), but the core of the financial system has been sound and stable. Plenty of countries would have traded that record for their own experience.
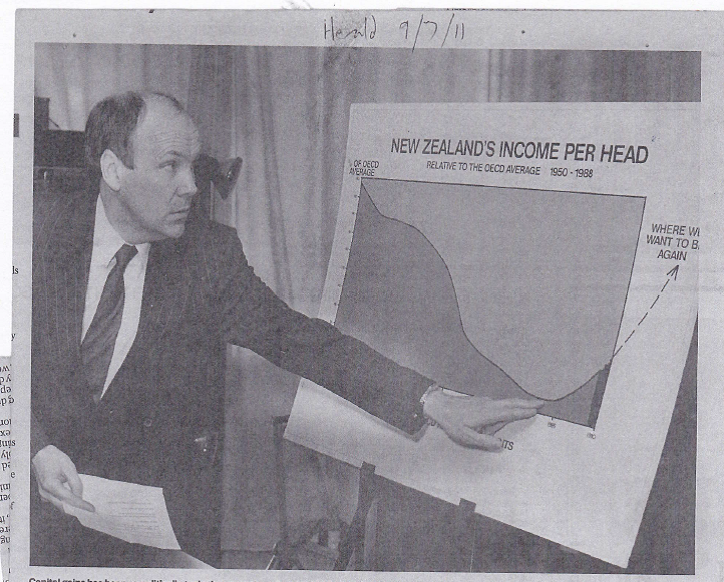
The big hole in the story has been around economywide productivity. 40 years ago people were highlighting how far New Zealand’s performance had fallen (official reports from as early as 60 years ago were already drawing attention to growth rates having slipped behind), and the hope/aspiration was to turn that around. This is one of my favourite photos (reproduced in the Herald a decade or more ago, but showing late 80s Minister of Finance David Caygill)
Even though there had been not-insignificant economic reform and liberalisation over the previous few decades, in the early-mid 80s it was easy to highlight the many very obvious inefficiencies in the New Zealand economy (car assembly factories dotted around the country to name but one example). The previous decade in particular had been a very tough time for New Zealand - hardly any productivity growth at all after 1973/74 – probably less because economic policy became particularly bad (one could quite a long list of useful and important reforms, alongside other problems and new distortions - eg Think Big) than because the terms of trade were very weak.
Almost as bad as the worst of the Great Depression, but averaging low for longer. Exogenous adverse shocks to both export and import prices impeded the ability of the economy to generate high average rates of real productivity.
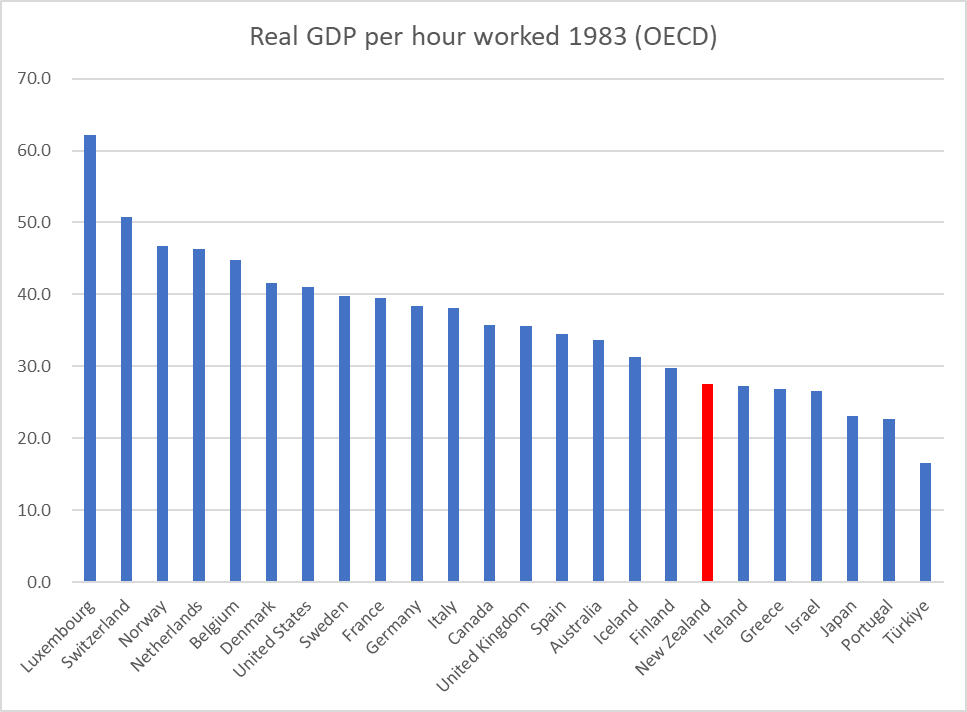
As recently as 1970 (when the OECD real GDP per hour worked data start) and despite decades of inward-looking policies New Zealand’s average productivity still didn’t look too bad. We were below the median OECD country but not by much, just under the G7 median, and more or less than same as the big European countries (UK, Italy, France, Germany). By the time of the 1984 election we’d slipped a long way further.
We were by then around the same as Greece, Ireland, and Israel, and of the G7 well behind all except (still fast-emerging) Japan.
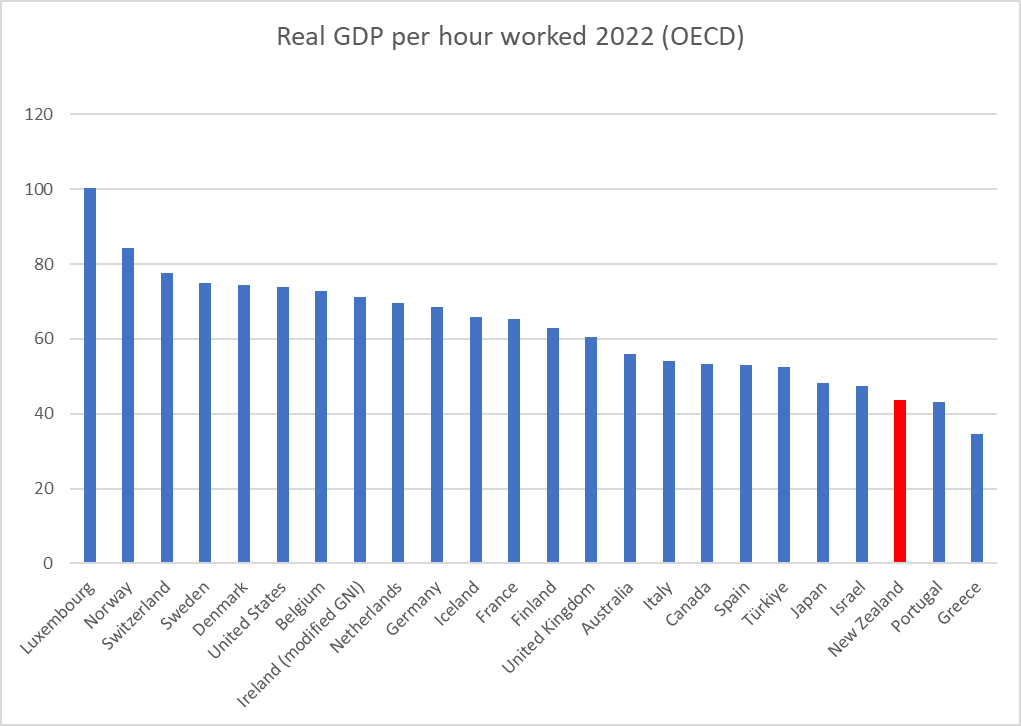
Here is where we are relative to the same group of OECD countries in 2022
We’ve clearly pulled away from Greece, but that is about the only semi-positive I could find (and yes, the gap to Italy has closed somewhat as well). For what it is worth, on the data to hand so far 2023 looks to have been a year when New Zealand average productivity fell.
Of course, the rate at which we’ve been falling down the league tables has slowed. But then remind yourself what happened to the (merchandise) terms of trade
They have trended upwards since the late 80s (I remember our puzzlement at the RB when the first late 80s lift happened) and especially in the last 20 years. On this measure (which excludes services, to get a long-term consistent series) the terms of trade have averaged higher than at any time in the last century. And yet still average productivity languishes.
There are of course a whole bunch of new OECD members since 1984. A large group of them were then either part of the Soviet Union or communist-bloc countries, even the least bad of which had much more messed up economies than New Zealand’s. This is how we compare now with that group
Middle of that pack to be sure, but probably not for long on the trends of the last couple of decades. South Korea is just about to go past us too.
It really has been a shockingly bad performance by New Zealand, against what would normally have seemed a propitious background - a sharp sustained recovery in the term of trade and a much greater reliance on letting market price signals work. There isn’t much serious basis for wishing away this failure.
And yet there seems to be little sign that our politicians or their official economic advisers have much interest, or any serious ideas for finally reversing the decades of real economic relative decline.
It is as if the powers that be and those around them have simply become resigned to our diminished fortunes, indifferent to what that failure means for actual material living standards now, and those for our children and grandchildren to come.
With both the annual and quarterly national accounts data having come out recently it is time for a quick update of some old charts.
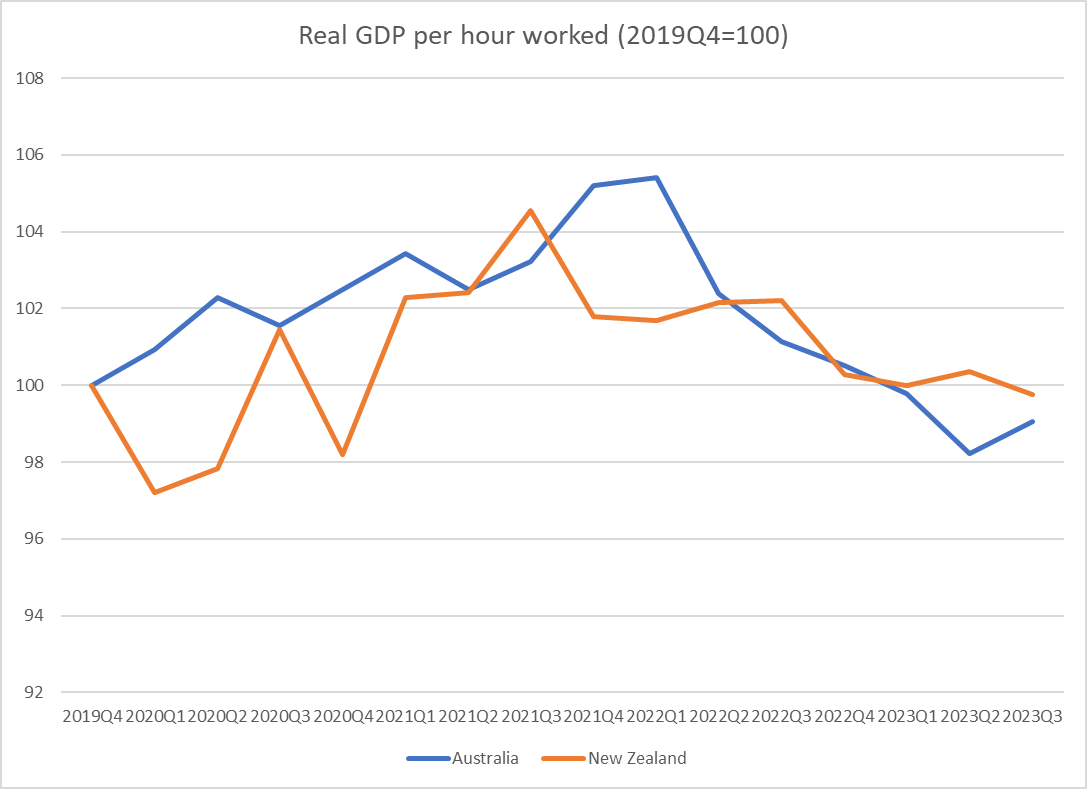
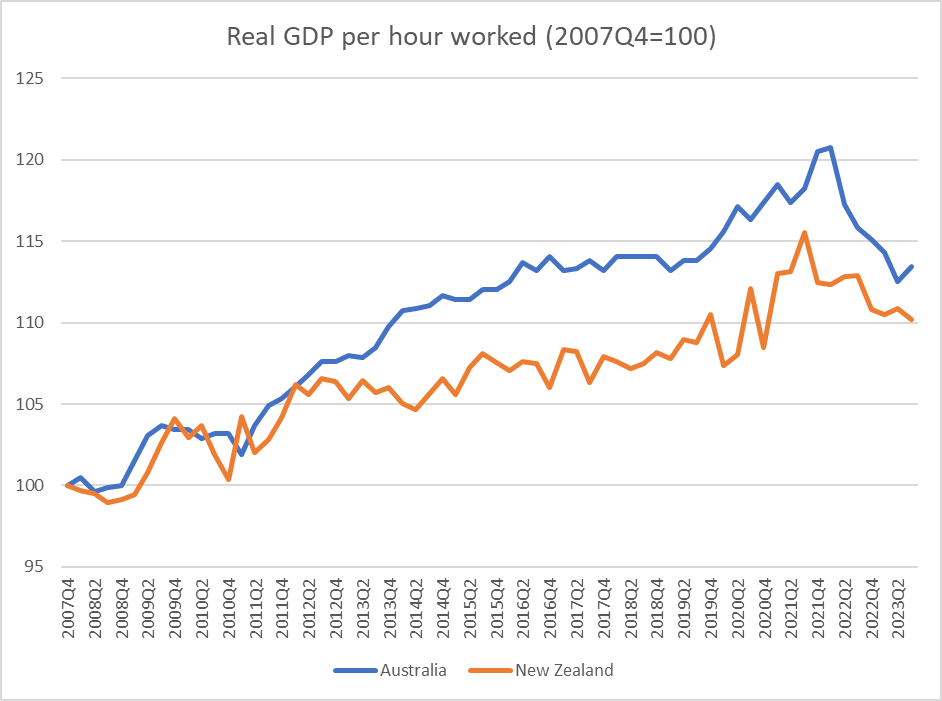
First, labour productivity (real GDP per hour worked). This chart is from the period since just prior to Covid, and for both New Zealand and Australia
If you want some slight consolation, at least we haven’t lost any ground relative to Australia over this period, but for both countries it is (on current readings) almost four wasted years, with no economywide productivity growth at all.
And whereas Australia’s terms of trade have risen by 11 per cent over that period New Zealand’s have fallen by about 5 per cent. That’s an additional income difference in their favour of 2-3 per cent.
(NB for resident UK pessimists, note that on current readings the UK has done less badly on labour productivity than either New Zealand or Australia over the Covid/inflation period.)
What about the longer-run series? This one is since just prior to the last big recession.
Pretty dismal productivity growth in both countries - less than 1 per cent per annum on average over the full period – but, as usually, we have done a bit worse than them over the full period. Note that although Australia is much more productive on average than New Zealand, it is also well behind the global frontier advanced economies.
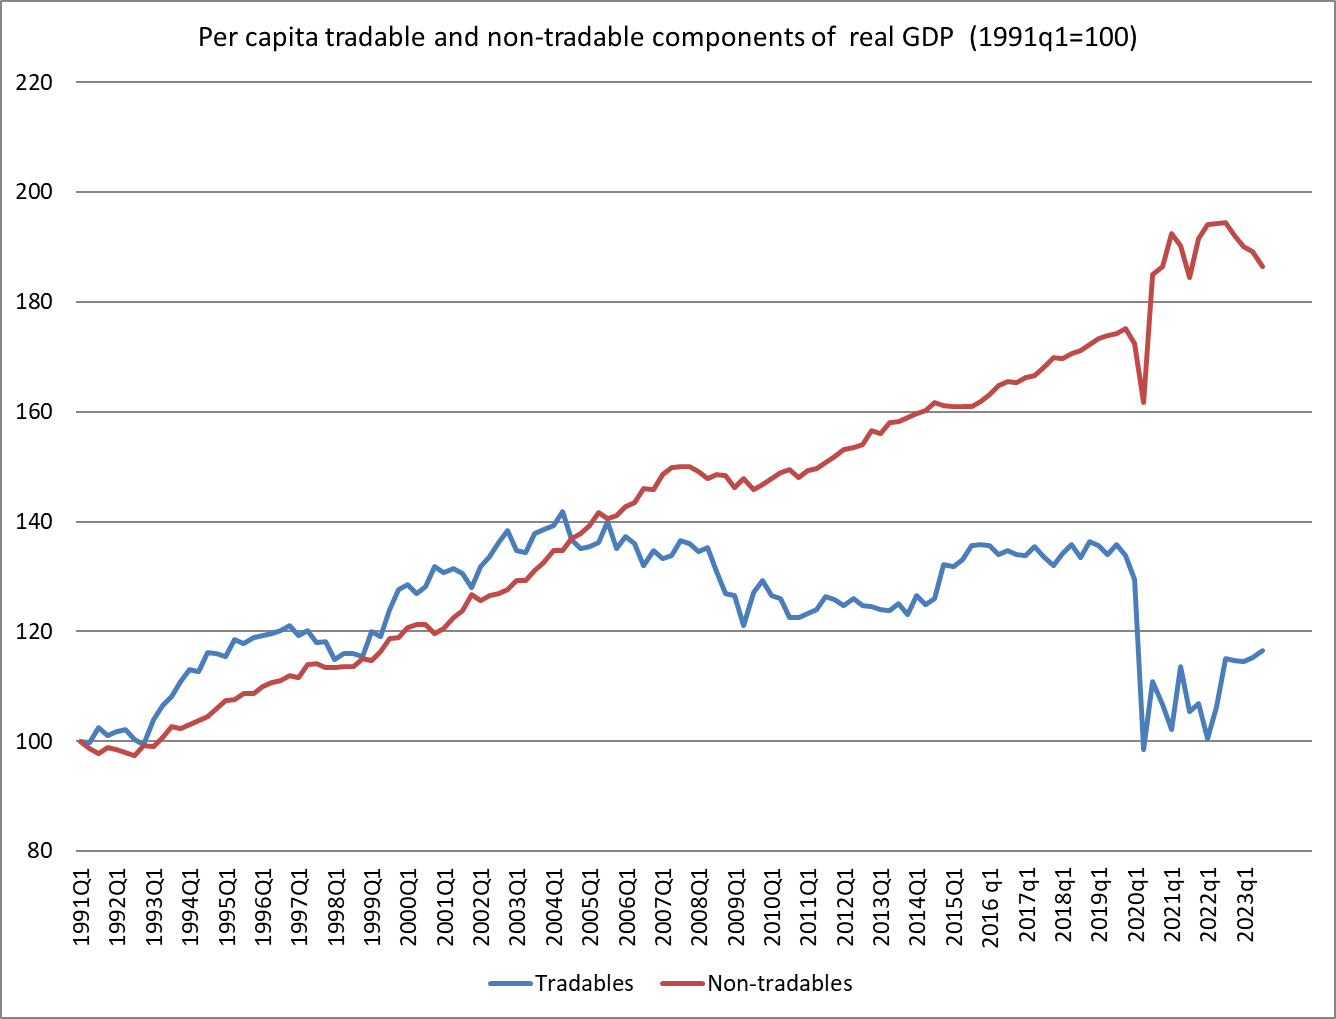
Here is another of my longstanding charts, an inevitably crude breakdown of GDP (per capita) into tradables and non-tradables components.
First, covering the entire period back to 1991
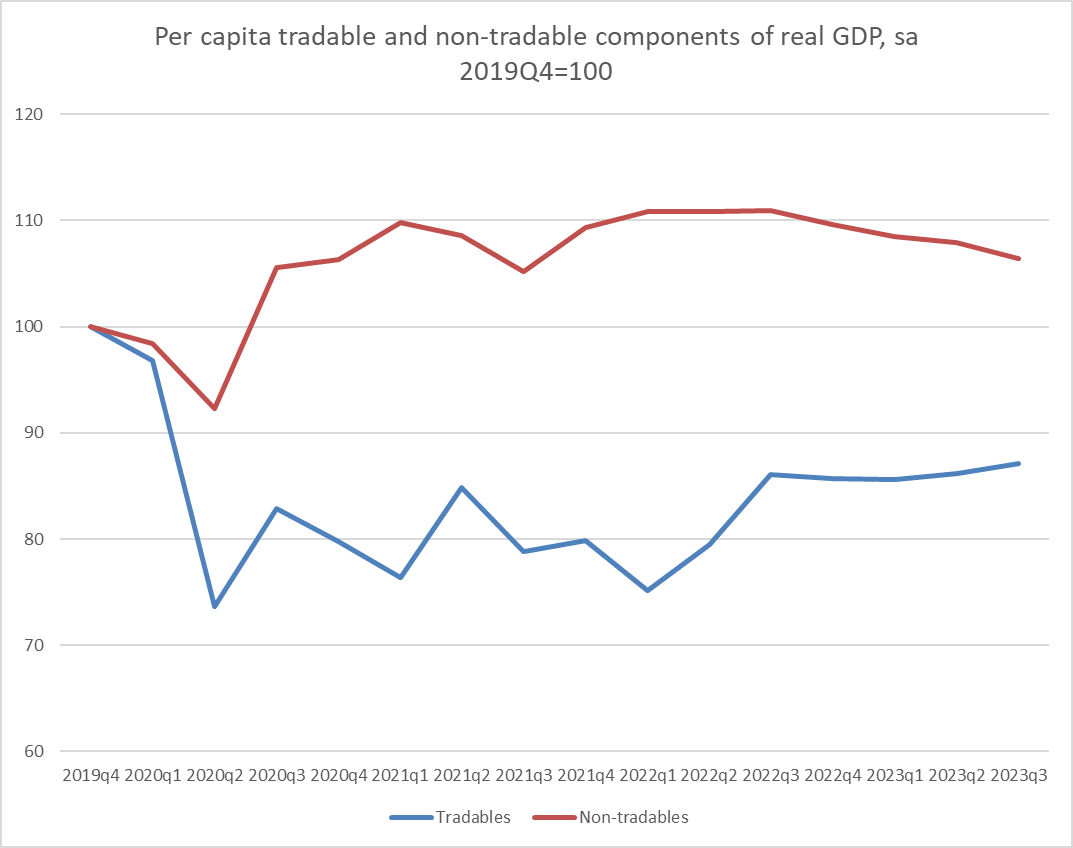
and then just for the Covid/inflation period, when the gap between the two lines has widened markedly (as you would have expected initially) and (so far) stayed wide.
On this measure, per capita (real) tradables sector production now is about where it was almost 30 years ago and is about 15 per cent less than it was at the peak 20 years ago.
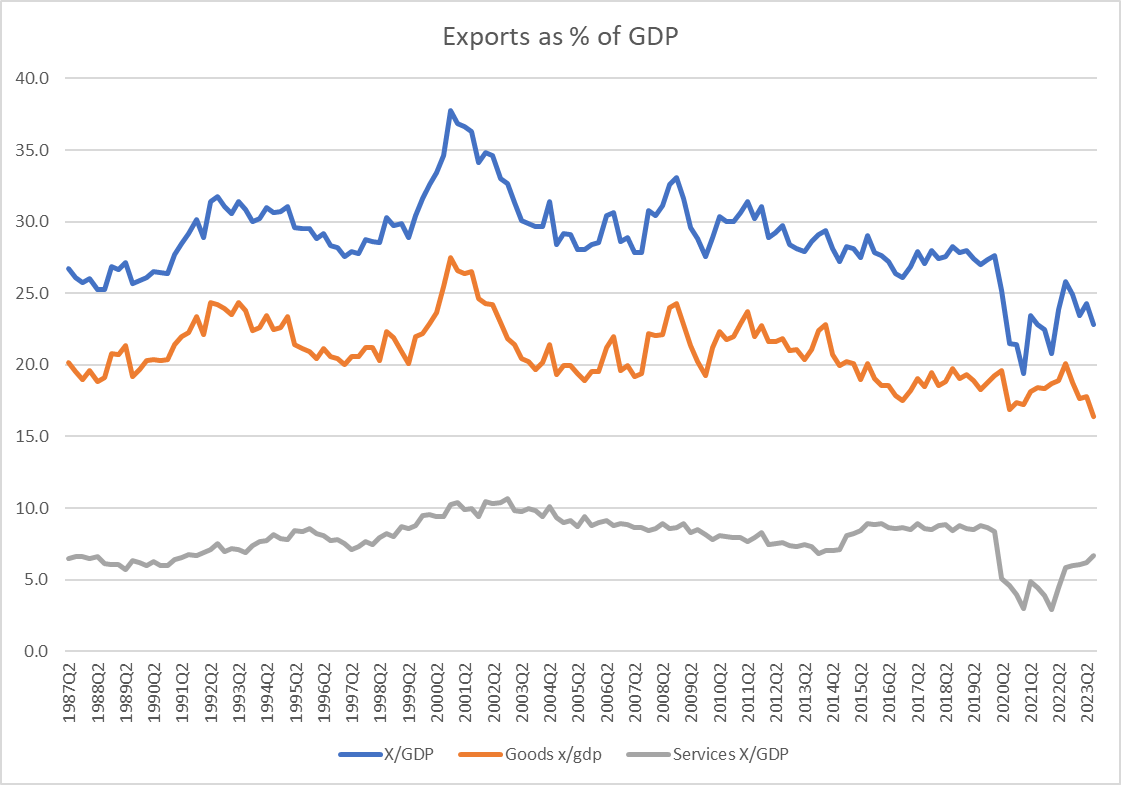
And then one final graph. This one shows (nominal) exports as a share of GDP
Total exports as a share of GDP have recovered somewhat after the Covid border restrictions but to a level (share of GDP) not seen pre-Covid since 1972 (off this chart, but using SNZ annual data).
And somewhat to my surprise, it is goods exports - not materially hindered by the border restrictions of 2020-2022 – that look really weak, now making new multi-decade lows as a share of GDP. Perhaps one shouldn’t have to say it: exports aren’t special. But successful economies tend to be ones where firms find more and more opportunities (and more firms find those opportunities) to take on world markets and succeed. The economy’s problems can’t be solved by exporting per se (which would be to put the cart before the horse), but successful and competitive economies will typically have a lot of firms succeeding internationally. New Zealand, by contrast (and for all the individual success stories that can be found) is an economy that seems to have become increasingly inward-oriented, increasingly less successful competing internationally. And these aren’t just narratives about one government, or one term in office; they are multi-decade failures.
But each government bears responsibility for their acts of commission and omission, and we now have a new government.
Sadly, there is little sign that senior ministers have absorbed just how poorly things have gone in New Zealand - and were doing when the National Party was last in office - or to have any driving commitment to much better outcomes, or (and the two are no doubt related) any driving narrative for what has gone wrong and what might make a difference. And, of course, there is little sign of an engaged and energetic bureaucracy offering the sort of analysis and advice that might, just possibly, engage a minister or Prime Minister who one day wondered what sort of economy their kids and grandchildren might inherit, if those generations are rash enough to stay.
For reference, and least those Australia comparisons at the top provide some sort of excuse for do-nothing complacency, recall that over the last 10 years half a dozen countries have gone past us on the OECD productivity (GDP per hour worked) league table.
The quarterly GDP data were out on Thursday. Quite how one reads them probably depends on bit on where your focus lies. To the extent that the focus is on squeezing out inflation then any data that points to excess demand dissipating a bit faster is mostly a good and welcome thing. The sooner inflation is back to around 2 per cent, after three years away, the better.
On the other hand, real GDP per capita is the average real incomes of New Zealanders. And since not only did real per capita GDP fall in the September quarter but some other recent quarters were revised down there is the gloomy side to the story as well.
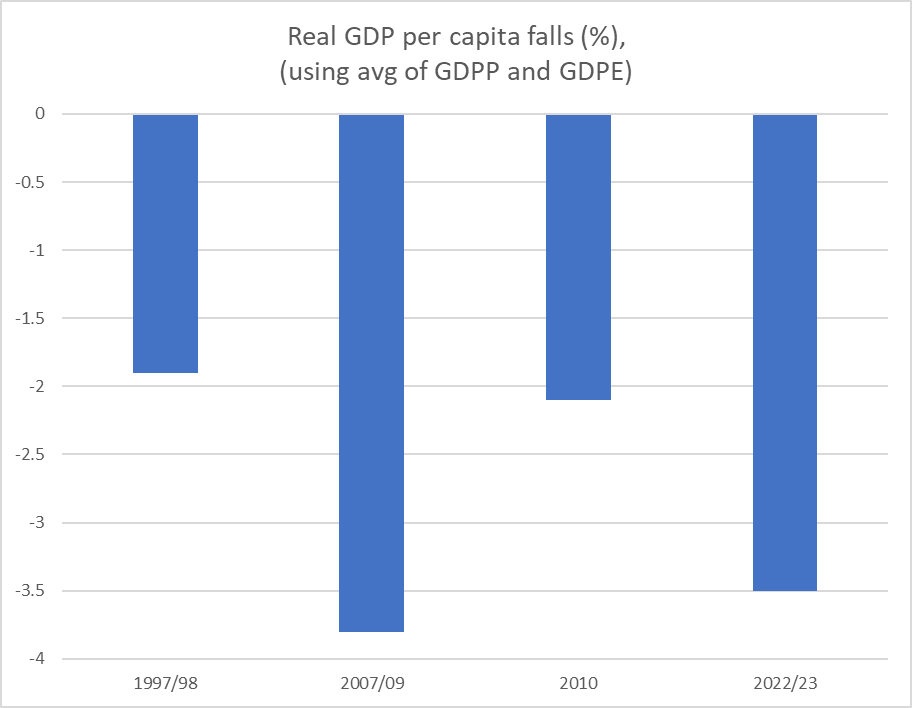
I put this chart on Twitter on Thursday
Looking back over recent recessions in New Zealand, real GDP per capita has already fallen by almost as much as it did in the 2008/09 recession. It isn’t that headline GDP is plummeting, but record non-citizen immigration inflows means the population has been growing at a rate not seen since 1947. This chart is from a BNZ report.
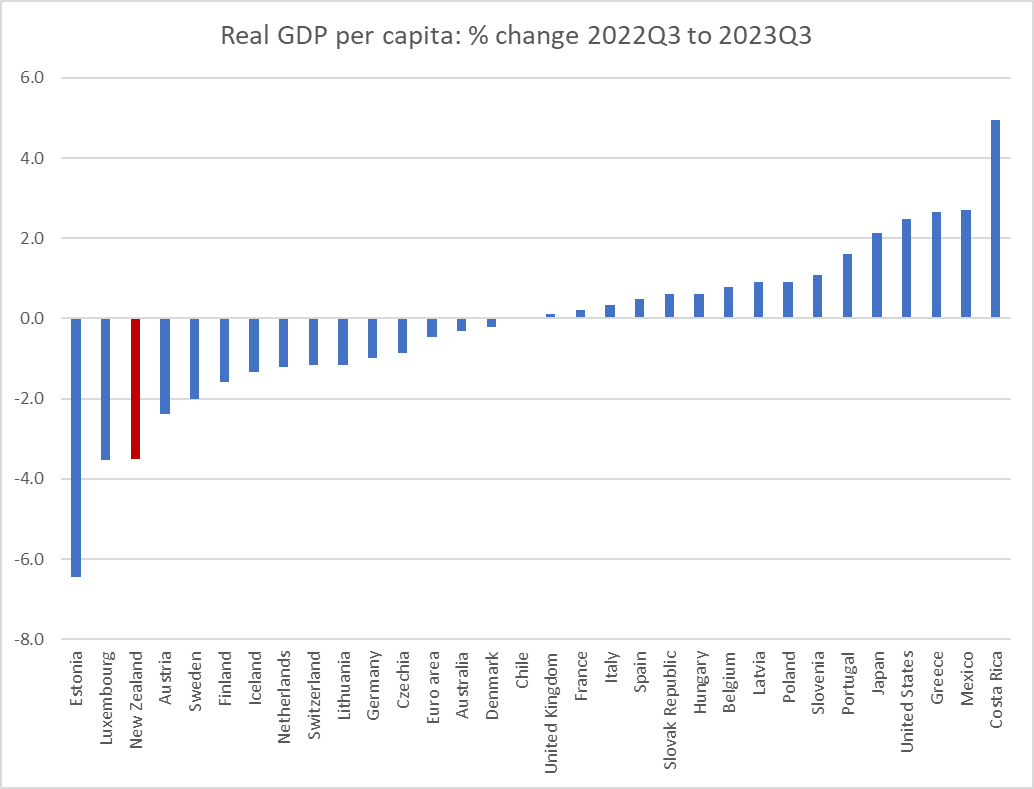
But how has per capita real GDP growth (or lack of it) here compared to the experiences of other OECD countries? The OECD doesn’t yet have quarterly per capita data for all member countries, but here is what they do have.
This chart shows the increase/decrease in real per capita GDP from 2022Q3 to 2023Q3. About half the countries have experienced falls in real GDP, but New Zealand’s has been the second largest fall (I’m guessing Estonia is an energy-shock effect).
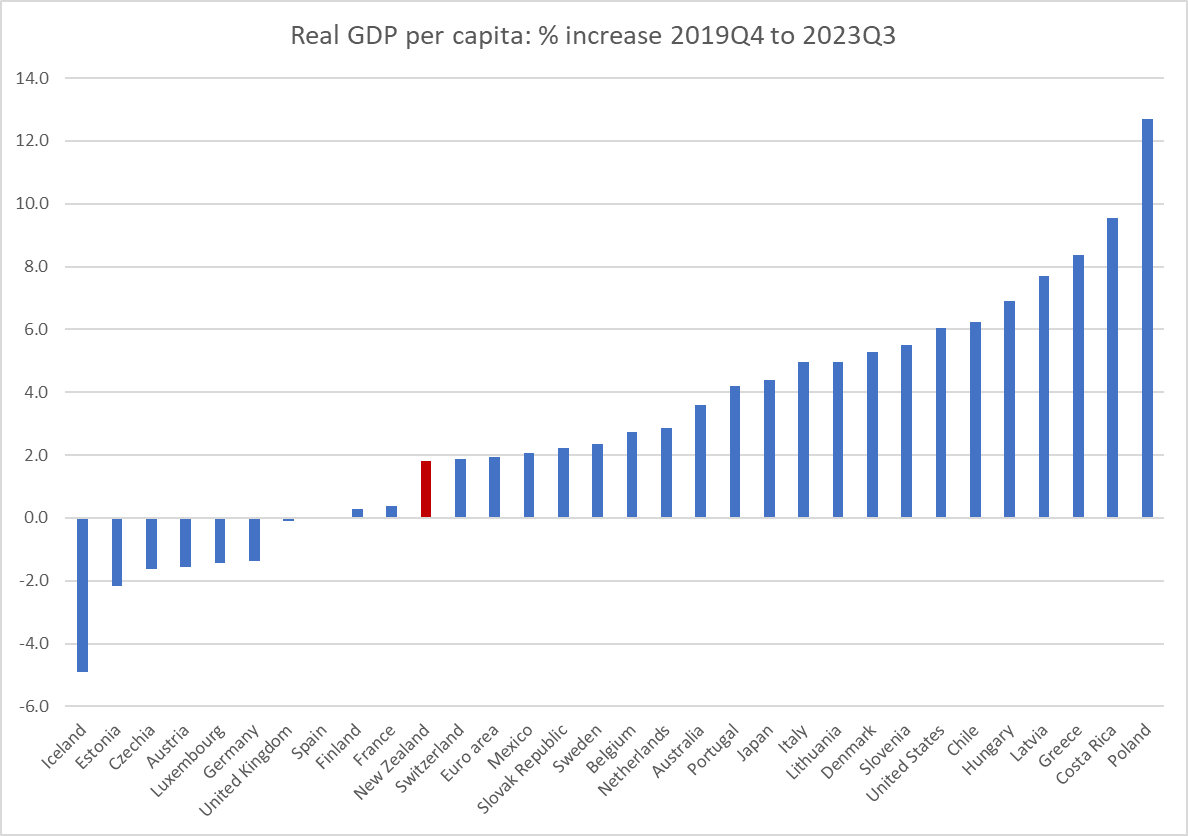
And here is the cumulative change for the same group of countries from just prior to Covid (2019Q4) to now (2023Q3)
Less bad of course, but (a) less growth than the median country, and (b) bar Iceland, all the countries with a worse performance than New Zealand were severely hit by the gas price/supply shock after the invasion of Ukraine (I’m not sure what the Iceland story is, but I checked the Icelandic statistics office website and the numbers appear to be correct).
It is a far cry from the stories we used to hear - backed by data - a year or two back about the initial post-Covid rebound having been fairly strong, by international standards, in New Zealand.
First, the ministerial list with its 28 ministers and 2 under secretaries, in a Parliament that at standard size has only 120 MPs. Yes, it is one fewer undersecretary than Ardern had in 2017 (meeting the ambitions of three parties as well) but…..this was supposed to be the government of busting public sector bloat, not simply matching previous excess (Luxon was quoted yesterday defending his numbers by reference to Ardern). Supporters of the government will pop up on Twitter suggesting there is a big agenda and they may all be very able people, but……it is far from obvious why (for example) we need an undersecretary to the Minister for Media and Communications, the entire job of one NZ First appointee (this parallels a 2017 appointment when one Labour person had the entire job of being undersecretary to the Minister of Ethnic Communities, a portfolio itself barely a job in the first place). The reforming governments of 1984 and 1990 didn’t seem to need executives of 30 or 31 people to get their jobs done.
And then there are all the portfolios: 76 of them by my count (up by five, I think, from the previous government, and 68 in the first Ardern ministry). If I read the table on Wikipedia correctly, the 1984 governments had only about 45 portfolios. It seems to have become a cheap form of pandering (pure portfolio labels themselves don’t cost much, but over time portfolio labels probably tend to beget activities and expenditure) to almost conceivable sector and population group.
It is almost as if your existence isn’t validated until the government has created a ministerial portfolio that covers you. (It is not as if none of these portfolios has any useful substantive content but…..why do we need a minister “for” manufacturing, or “for” hunting and fishing” or “for” hospitality, let alone for something as basic and individual as “recreation? I’ll go further – taking for granting that the Racing portfolio is absurd – and suggest there is no need for a Minister for Tourism either, even if we have had one for more than a hundred years. And that is before starting on the plethora of population ministries, for not one of which one could really mount a serious case for (notwithstanding there may be bits and bobs of real needed stuff in places like Maori Development). None of it speaks of a government that is serious about shrinking the public sector and back-office bloat. The amounts involved of course aren’t individually large, but the pennies add up, and people look to actions at least as much as words.
What of the coalition agreements. The preambles made interesting reading (basically the same, but here I’ve used the ACT one) for what the parties wanted us to believe they were about.
I was struck by the two highlighted bits. First, I wasn’t sure – even though all parties talk it up – why “social cohesion” was thought to be a good thing (seemed to be talked about eg by people wanting “hate speech” laws or the dodgy Disinformation Project people). There are real and deep divides among people, and values differ very deeply – I (for example) regard most of the parties of the further left as repugnant (on multiple grounds) and am not any keener on David Seymour’s moral vision. Much of the country now, on the other hand, regards orthodox Christianity as repugnant (governments even legislating to outlaw some of it). We all have to rub along in some form or another living in a common space, but that is about it surely? And second, that bit about being a “world economic and social leader”. It was bit puzzling for two reasons: first, there is no way what is in these agreements is at all consistent with that stated ambition (and, to be fair, National in particular never suggested otherwise in the campaign) and second, when New Zealand was regarded as a “world economic and social leader” wasn’t that primarily under the pre-war Liberal governments that were relentlessly extending the role of the state? As for “export powerhouse”, well I suppose it sounded good when they wrote it down.
For those who haven’t dug into the coalition agreement documents themselves you might not have seen mention of the “Ongoing Decision-Making Principles”. These are them
I take them with something of a pinch of salt, but I was pleased to “rigorous cost-benefit analysis” in there twice. Let us hope so. It would certainly make a change, and not just from the most recent previous government.
Consistent with the pinch of salt approach, there was a telling item in the ACT agreement. It starts “when evaluating government expenditure it should be assessed on the extent to which it is delivering public goods [here I’m going “tick”], social insurance [another “tick”, perhaps a little less enthusiastic], regulating market failure [“tick”, I suppose, although “being cognisant of government failure” would go nicely with that] and [………..wait for it] political choice”.
You have to wonder why they bothered. It was going quite well with that list, until the “and anything else we happen to want to spend money on at the time” was added. It is realistic I guess, but not exactly inspiring or even very aspirational.
The bigger question across all these documents (which incorporate, when not specifically excluded, the things in National’s 100 day plan, their 100 point economic plan, and their fiscal and tax plans (“plan” in some cases being a generous description)), is to what extent the new government’s programme mostly unwinds some of the bad stuff the previous government did and to what extent it genuinely sets a pathway to a much better future. Whatever you think of the state of things when National left office in 2017 – and at least there wasn’t a fiscal deficit – our average productivity performance was then as poor as ever, business investment lagged that in most OECD countries, and no real progress was being made towards abundant and easily affordable housing. And, for example, the Wellington City Council still wasn’t well-run and was still prioritising ideological vanity projects over basics (water, most notably).
There is a long list of stuff in the documents outlining the new government’s programme that I like. But it is long on things (small and large) undoing the last government’s agenda, most of which I put big ticks next to.
But it seems (and I’d like to believe I was misreading it, but I don’t think I am) short on making for a much better future relative to 2017.
Take the business side of things. National has long talked about encouraging foreign investment, but…..there was never much in their campaign, and the ill-conceived attempt to ease the foreign buyers housing ban proved stillborn. There seems to be a commitment to make it easier for overseas investors to engage in build-to-rent housing projects which sounds positive. But there isn’t much beyond that. The one item I spotted was this
which sounds as though it should be positive, but also seems quite limited. Presumably all the screening requirements and other current restrictions remain in place.
New Zealand has one of the highest company tax rates in the OECD, and not only is there nothing in the agreements to lower that rate – which bears most on foreign investors – but they are proceeding with the same distortionary policy Labour also proposed to remove tax-depreciation provisions for buildings (offices, factories etc). It is a step in the wrong direction.
There are some positives, including provisions around consenting for renewable energy projects and infrastructure projects, ending the oil and gas ban, encouraging minerals development and exploration, and to the extent that they are followed through on and work a focus on better schooling should produce some economic payoffs a decade or more hence (which isn’t a criticism just a reality). I’m all for school choice, but it is mostly about choice (good in its own right), and it isn’t yet clear how far the parties will be willing to go. The talk of a new RMA sounds good on paper, but with minimal detail, and huge uncertainty about specifics and then how courts might interpret things, who really knows how much it will amount to.
Could the new Ministry of Regulation end up being a positive? Quite possibly (although we once hoped for that from the Productivity Commission), but conducting reviews – worthy as they may be – is different from getting a three-party Cabinet to agree on substantial material regulatory and legislative changes, and National in particular did not campaign for a mandate of major change. And it isn’t clear either that the parties have a clear idea as to what it would take to once-again be a world-matching economic performer, or that they are going to supported by an officialdom with the intellectual leadership etc to produce top-quality advice equal to the challenges.
As for housing, the parties have committed to keep in place the outgoing government’s “highly productive” land restrictions, which functionally have the effect of making it harder to get the sort of competition in land around cities that really could drive down house prices. On the positive side, “automatic approval for appropriately certified building materials from the US, Europe, the UK, and Australia”.
Some are lamenting the agreement to make the Medium Density Residential Standards voluntary. I’m not – as on their own they were never going to materially contribute to lowering house prices, and represented something of a central government overreach that never dealt at all with real externalities, even if some of those involved had good intentions (others – like too many councils – just had a vision of urban form they wanted to impose). I am sorry that the government did not pick up the idea of allowing easy localised (ie own group of properties only) opt-outs from the new rules, and is not doing anything about a presumptive right to build. Overall, in combination, and in combination with an immigration policy which seems to be even more “big NZ” than late Labour, it is a recipe for house prices in New Zealand to continue to be ruinously unaffordable for huge proportions of the population.
Oh, and National’s (very weak) NZS policy has been kicked for touch, so that there is not even a pretence of beginning to face the fiscal implications of the continually ageing population and growing life expectancy (themselves both good things), all of which might seem a trifle less bad if we were starting with fiscal surplus and very low debt, rather than with big fiscal deficits and debt levels rapidly converging on OECD medians.
Time will tell. But for now I’m not much more optimistic than I was before the election. There is a reasonably encouraging list of things to unwind (although many more things could have been added), but having done the unwinds little in the agreements suggests any sort of full-throated seriousness about actually reversing decades of economic failure or the scandal that is house prices in land-abundant New Zealand. I doubt we will even hear again that stuff about once again being a world economic leader: with such an unambitious forward agenda, and weak policy capability, the gap between rhetoric and reality would quickly just be too sad, inviting head-shaking and some derision.
In this morning’s edition The Post has a double-page article about what Nicola Willis might be like as Minister of Finance. Those of my comments that were included are here
My bottom line was actually very similar to that of CTU economist, Labour champion, and former political adviser to Grant Robertson who was quoted as saying that only time will tell whether Willis makes a good finance minister, specifically “you don’t master these things overnight”. That said, I was a bit less impressed by the one campaign event I saw her at (the Stuff finance debate). I’m anything but a fan of Robertson – I think he ends up having been the worst Minister of Finance New Zealand has had in the post-liberalisation decades – but I thought Robertson had the better of her. Despite the government’s poor economic record and Willis’s apparent past debating prowess, perhaps 9 years’ experience as Labour’s finance person counted?
Willis comes to the job with relatively limited experience in the portfolio. Contrast her 18 months as the spokesperson with the 9 years Michael Cullen had before taking office (having sat in Cabinet for three years before that), or the similar background Bill English had had by 2008 (he hadn’t been spokesman for that long, but had briefly held a finance portfolio late in the previous National government). David Caygill and Steven Joyce both came to the job late in their respective governments’ terms, having served as senior economic ministers for years previously. Willis’s record is perhaps closest to that of Grant Robertson (neither had an economics background, and Robertson had had only 3 years as opposition finance spokesman). Neither has ever run anything much previously either, so again there isn’t a great deal to go on.
One might think of three aspects of the role of Minister of Finance:
senior political operator and parliamentary figure,
manager of the government’s finances,
lead figure in overall economic strategy.
The first of those isn’t really my territory. But it was probably where Robertson did best. He seemed to be a very effective figure in the House and a formidable debater etc. That isn’t nothing, especially when (as they will, for any government) things go badly at times. Perhaps Willis will be similarly effective (she was, like Robertson, primarily a political operative by background).
But beyond that it is very hard to know. One could mount an argument that at least in the first couple of years Robertson didn’t do a bad job at all managing the government’s finances (the left thought him far too disciplined), but he’d inherited a fairly easy position (budget surpluses, unemployment falling etc). The problems really became apparent once the worst of the Covid disruptions were over, and instead of insisting on steering a path back to surplus (in an overheated economy), Robertson presided over additionally expansionary budgets both last year and this, such that he bequeaths large deficits in a country that for 25 years had largely avoided them. There seemed to be an inability or unwillingness to say no (and that in a government with no pressures from coalition etc parties).
How will Willis do in that role? There really is no way of knowing at this point. No doubt officials in Treasury have been beavering away for weeks preparing advice for an incoming Minister of Finance, one who plans to bring down some sort of mini-Budget within what will be not much more than her first five weeks in office, and will quickly have to focus on next year’s Budget. But as to what hard calls she is willing to make, or to insist on (both her Prime Minister and the other parties will have different views on things) no one knows. There is no track record (or nor really can there be, especially when neither she nor Luxon has previously served as a minister).
I’m not overly optimistic, including because of the reluctance to put the seriousness of the fiscal situation front and centre during the campaign, preferring to run a campaign in which – like Labour’s – (faced with large deficits) it was more a contest of who had had the shiniest new baubles to bribe voters with, financed by proposed tax changes that – like Labour’s – had little no economic merit, and around which there were also serious questions about the revenue they might raise. As to the foreign buyers’ tax business, my unease was less about whether or not the revenue estimates are roughly right – in macro terms it was always second order – than about the way she and her leader handled the issue, refusing transparency, refusing to release any of the modelling, relying on “trust us” assertions when it wasn’t particularly obvious why – with the best will in the world – we would. Verification helps underpin trust, and there was none of the former.
Being Minister, backed by a phalanx of Treasury staff and analysis, is different than being opposition spokesperson in a campaign. But it isn’t Treasury that makes the hard political calls (and too often in the last few years Treasury itself seemed more inclined to favour bigger government over balanced budgets). There is clearly now some political mood for restraint – even Labour seemed to get it in the last few weeks – but how well, and for how long, will that shape Beehive decisionmaking when the pressures from the numerous vested interests (of all sorts) mount?
My own unease is greatest around that “lead figure in overall economic strategy” role. There will be other senior ministers no doubt, but a Minister of Finance who is deputy leader of the main governing party should be able to be looked to as the key player in this area. And it is where, in her time as finance spokesperson, there is little sign that she has any more credible a model – or any more substantive interest – than Grant Robertson had for (for example) reversing the decades of economywide productivity growth failure. We shouldn’t look to the (any) Minister of Finance as some sort of economic guru, but there is little or no sign that Willis is greatly interested or has made any effort to surround herself with advice, expertise, or even active debate about what might be needed. The risk is that holding office will be sufficient, rather than doing something much in it. There is, of course, the 100 point economic plan (which when I read it I probably agreed with a majority of the items in it) but a list that long really is a list rather than a strategy backed by a compelling narrative. And it isn’t as if The Treasury seems to have much to offer there either (as distinct from narrower expenditure control stuff).
Who knows. We’ll see before long I guess. If I’m “not a big fan” – and I’m not – it is a long time since I’ve had much confidence in any senior New Zealand political figure (or most of their top bureaucratic advisers – an issue for Willis since The Treasury is weakly led, and entities she will be responsible for like the Reserve Bank and Productivity Commissions are worse. What, if anything, she is prepared to do about the leadership of these three agencies will be an early test). It would be great to be pleasantly surprised.
(In the snippet above I included Bryce Wilkinson’s comments, partly because he runs a quite different line about Michael Cullen than the quote from me. The background to my own comment was the observation that one didn’t need to have an economics background to be an effective Minister of Finance. Cullen’s politics were very different to my own, but I have here several times defended his fiscal management, noting that he proved to have been very badly advised by Treasury, which told him that even in the face of expansionary budgets late in his term the Crown accounts would remain in operating surplus over the forecast period. That proved to be very wrong, but it is The Treasury that is paid to do the numbers and provide those reckonings. A couple of posts on that are here and here.
All that said, when I wrote about Cullen’s book I ended the post this way
Those last few lines are the sort of thing that could fairly be said of pretty much all our Ministers of Finance for decades.
It would be great if Nicola Willis were to be different. But there aren’t yet many positive straws in the wind.
That was the title of a ten page piece published last week by the ANZ economics team (chief economist Sharon Zollner and one of her offsiders, who appears to be a temporary secondee from the Reserve Bank). You can find a link to the paper here.
The gist is captured in the paper’s summary
I found the first line of that final bullet rather jarring – the balance of payments not having been any sort of policy focus for decades now (really since the shift to a floating exchange rate) in 1985.
But what really puzzled me about the note was how little macroeconomics there seemed to be in it, or behind it. It isn’t that there was no interesting material in it; in fact there were a variety of interesting charts on developments and issues in individual sub-sectors, and for anyone interested in these issues it is worth a read. But I thought I’d throw in a few macro perspectives.
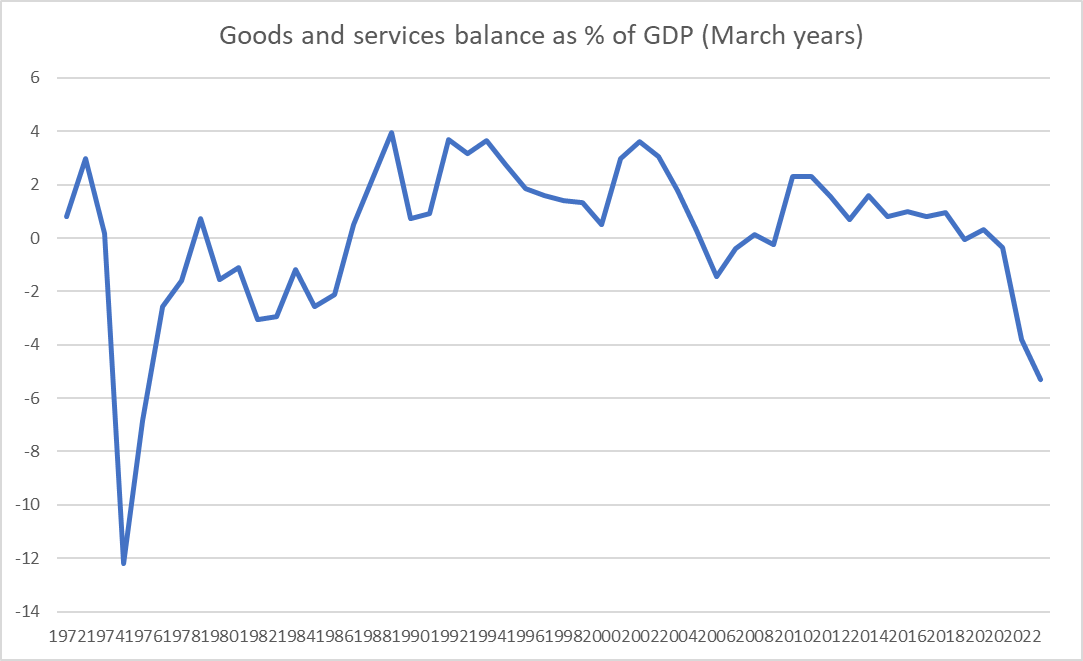
The paper starts with this chart
which is a rather different picture than the one (for the current account) we usually look at. The current deficit as a share of GDP got to about current levels in 2007, but looking just at the goods and services balance what we’ve seen in the last couple of years is without precedent for many decades. Here is the same chart with the longer run of annual data.
I’m not entirely sure why ANZ chose to focus on the good and services balance. It is akin to the primary balance in a fiscal context, which I argued here a few weeks ago it made sense to give more prominence than is often done in New Zealand for a number of reasons. If as a country you are running a goods and services balance (or surplus) it is unlikely that the NIIP position (as a share of GDP) is going to get away on you. (Of course, there isn’t anything necessarily wrong with a widening negative NIIP position – as so often, it depends what is causing the change.)
But one other positive feature of focusing on the good and services balance is that it helps to make clear that the recent sharp widening in the current account deficit – to one of the widest among OECD countries – is down to the spending choices of New Zealanders. The other big component of the current account is the income deficit (primarily in New Zealand, investment income – interest and profits). Interest rates have risen a lot in the last couple of years. But I’d have to confess I hadn’t really noticed that, thus far, the income deficit has not widened much at all as a share of GDP. If interest rates stay around current levels for long that will probably change.
So if it is spending choices that – compositionally – explain the sharp widening of the current account, where do we see that.
Well, the badly mis-forecast sharp increase in core inflation is one place. But step back a little further.
Here, from the IMF WEO database, are investment and (gross) national saving as a per cent of GDP, in annual terms included estimates for calendar 2023.
Another way of looking at the current account deficit is as the difference between saving and investment. And here you see that investment as a share of GDP last year and this has been at the highest we’ve experienced in decades (since the days of Think Big), and while the savings rate isn’t at any sort of record level it has been quite a bit lower than what we’d seen in New Zealand over half decade or so pre-Covid. Saving here is national savings – household, business, government – and we know that government dissaving – substantial operating deficits – has been a feature of the last few years, never more so than in 2022 and 2023 by when the economy was already running beyond capacity.
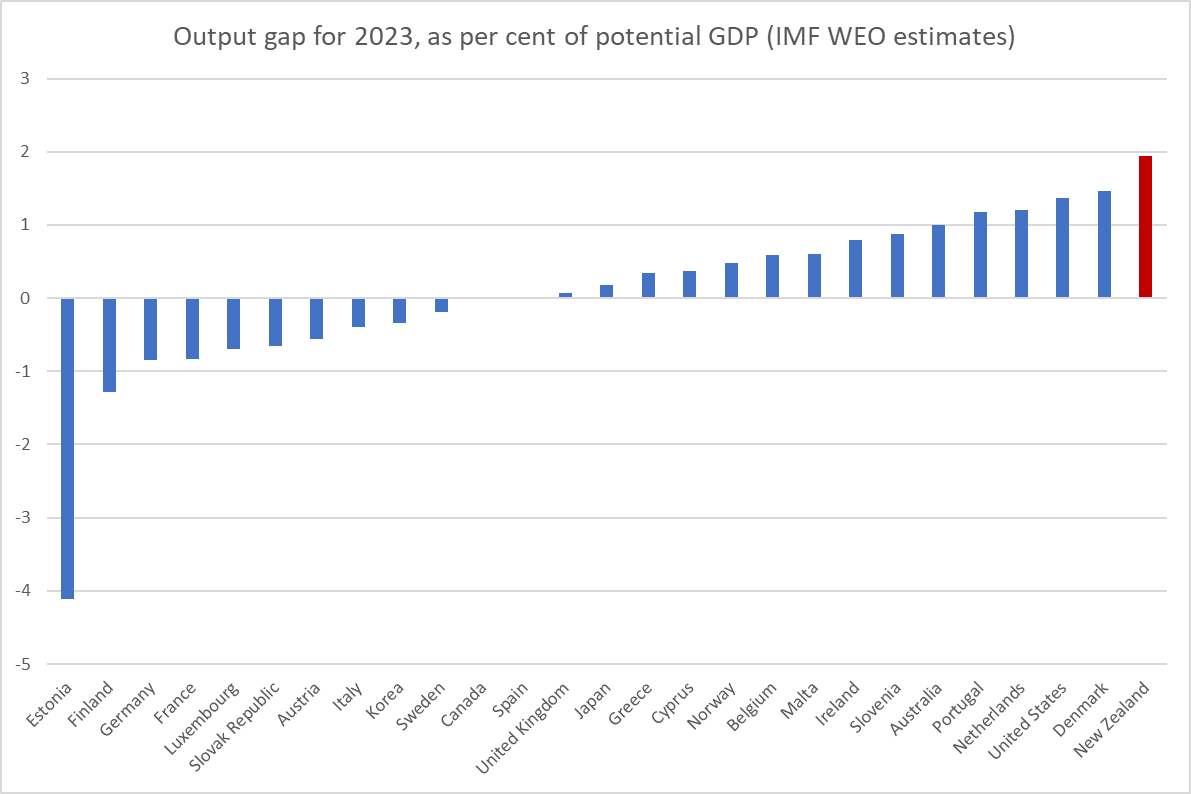
Beyond capacity? Well, we know the labour market has been stretched beyond sustainable (in the RB Governor’s own words) and both the Reserve Bank and Treasury have talked of positive output gaps.
But absolute numbers for local output gaps don’t get much coverage or grab the imagination. But this chart is from the IMF’s World Economic Outlook a couple of weeks back. The good thing about the IMF numbers isn’t that they are right – few forecasters consistently are – but that they take a fair common approach across a whole bunch of countries. And on their reckoning even this year on average the New Zealand economy is seen as the most overheated – “overheated” means prone to larger than usual balance of payments deficits and higher than usual inflation – of any of the advanced countries they do such estimates for. And that without any surge upwards in the terms of trade of the sort we were enjoying when the economy was last this stretched – in output gap terms – in 2007.
And then here is another chart I’ve shown before to highlight just how unusual domestic demand has been here in recent years.
Domestic demand needed to increase to some extent to fill a void left by the slump in net exports (most notably net services exports) if the economy was to remain fairly-fully employed, but policy (mostly monetary policy, which takes fiscal policy as given) was set so badly that we’ve ended up with astonishing levels of domestic spending, and with it……high core inflation, and a really marked widening in the balance of payments current account and goods and services deficits.
But, and here’s the thing, we still do not need specific balance of payments. Not from government, and not even from you and me thinking we’d best do our bit for the nation. Rather, as the government (eventually) gets the deficit back down again, and as the Reserve Bank eventually does its job, we can expect these imbalances largely to sort themselves out, and certainly not to end up posing severe risks to anything much. And if perhaps Chinese tourism exports never fully recover, we can expect private domestic spending to adjust, as it tends to when (for example) the terms of trade fall and people find themselves less well off than they had thought.
Of course, we shouldn’t rule out an exchange rate adjustment at some point, but we’ve come to forget how common they used to be in New Zealand – common, without being highly disruptive or prompting higher interest rates again. For a couple of decades at the RB we used to spend huge amounts of time trying to make sense of some of the biggest real exchange rate swings in the advanced world…..and then they just stopped (the reasons for that aren’t, I think, well understood or even extensively studied).
The ANZ paper ends with this line
The bottom line is, ‘something’s gotta give’, as the saying goes. We can either be the collective architects of that change or we can wait for changes to be imposed on us by foreign creditors and financial markets.
That seems overwrought, but we should expect our macro policymakers to do their jobs rather better than they have in the last 3 years or so. But perhaps it isn’t the done thing for market economists to call out policymakers too vocally?
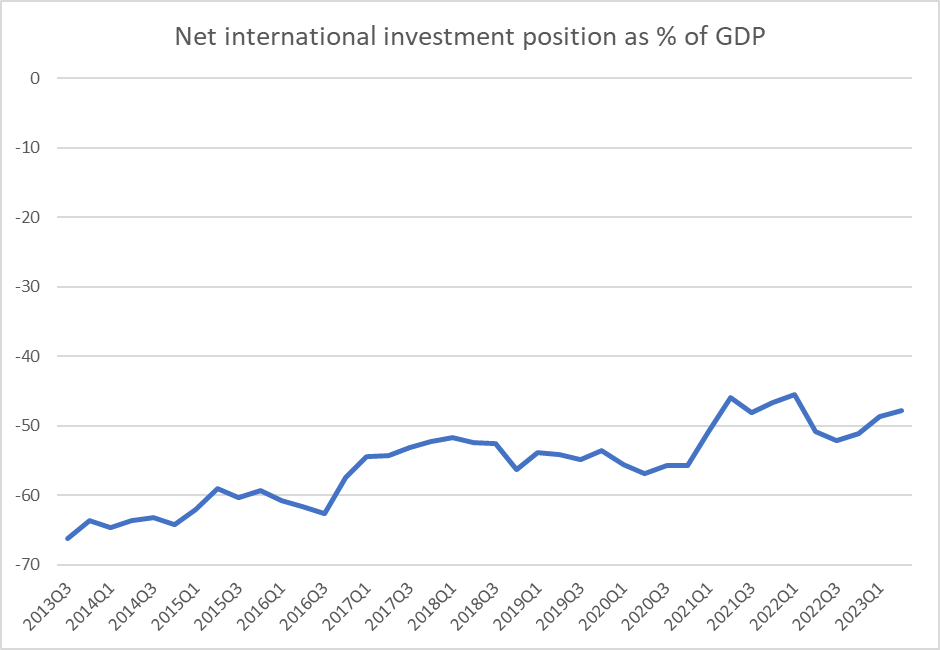
UPDATE: Oh, forgot to include this chart, which does put the last couple of years’ external imbalances in some perspective.
The rest of the world’s net claims on New Zealand residents have, if anything, shrunk a little further as a share of a GDP over the Covid years. It seems unlikely the creditors will be dunning “us” any time soon……which is not to say that if our interest rates end up lowish relative to the rest of the world there might not be some fall in the exchange rate.
I’ve written a few sceptical posts here over the years about the annual (or so) Technology Investment Network’s (TIN) boosterish reports on the New Zealand tech sector. The overall story was just even close to as upbeat as the reports liked to make out.
Yesterday a link to a new TIN report turned up in my email inbox. This was the bit in the email
There is a clue right there in the reference to chocolate chips. This wasn’t going to be a report about what most people have in mind when they think “advanced manufacturing” but about the manufacturing sector as a whole. All firms in the sector use technology of one form or another, some of it very advanced.
Anyway, I downloaded the full report (you have to register to get it, but it isn’t onerous, and the report itself isn’t overly long, at about 30 pages of substance). It turned out to be the product of a bunch of outfits I’m pretty sceptical of. There was TIN itself which did the work, there was the co-chair of the Advanced Manufacturing Industry Transformation Plan Steering Group (ITPs being that throwback to the 1960s that the outgoing government became keen on) who supplied the Foreword talking up both his group and document, and then there was MBIE which is said to have “commissioned this report” and presumably paid for it. Money was being thrown around in all too many areas under the outgoing government.
Both the Foreword (by Brett O’Riley) and the Welcome (by the Managing Director of TIN) are pretty upbeat. O’Riley makes the bold claim that manufacturing is “the backbone” of the economy (to which I responded on Twitter this way
Just reading a puff piece from a manufacturing industry group describing manufacturing as "the backbone" of the economy. pic.twitter.com/3chXTsxzyj
After noting that the manufacturing sector will soon drop to being only the third biggest greenhouse gas emitting sector (behind households and agriculture) the Welcome ends this way
It all sounds good quite upbeat.
That is, until you read on.
There is a helpful Executive Summary. It also attempts to start upbeat
Advanced manufacturing is a critical engine of Aotearoa New Zealand’s long-term prosperity, making a vibrant contribution to the nation’s economy
But then the pesky data start getting in the way
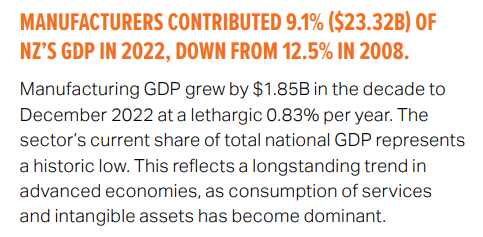
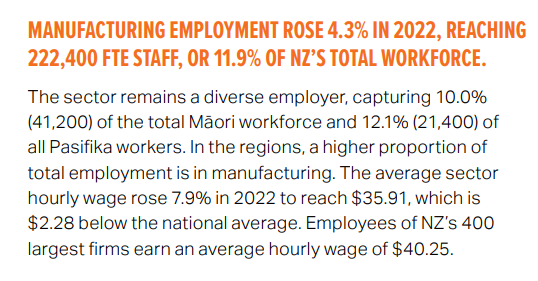
There are still lots of workers
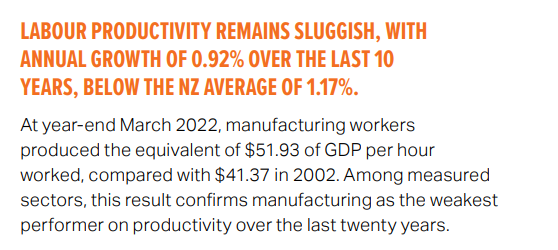
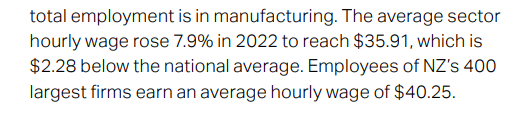
But if your sector is 9.1 per cent of GDP and 11.9 per cent of the workforce, what does that say about productivity?
Low level, and low growth rate. Ouch.
And, unsurrpisingly wage rates in the sector as a whole are below the economywide average.
You might have noticed in that clip at the top reference to 60 per cent of New Zealand’s exports. That is because many of New Zealand’s agricultural exports are processed (dairy factories really are big and sophisticated operations, even if the share of that processing in total dairy value-added is not huge). Anyway, exports….
Not exactly a positive story either.
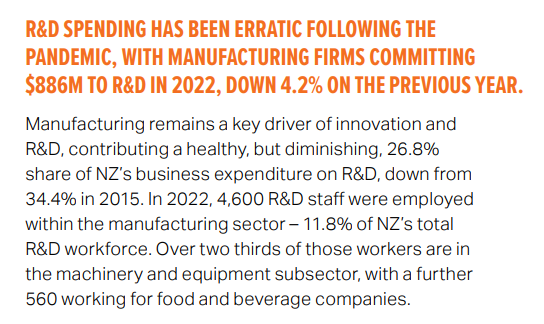
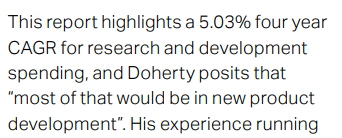
The puff piece at the front was upbeat on R&D (‘over a quarter of national R&D spending comes from manufacturing’) but by the time you get to the Executive Summary a less rosy picture emerges
So that is quite a big drop in the share of national R&D spend, and manufacturing sector R&D staff are almost the same share of total R&D staff as manufacturing employees are in the total workforce (although to be fair one has to wonder a little about whether the comparisons here are all apples-for-apples, since if manufacturing does 27 per cent of the national R&D spend with only 12 per cent of the R&D employees, those manufacturing R&D employees must be doing a lot of work/spend each).
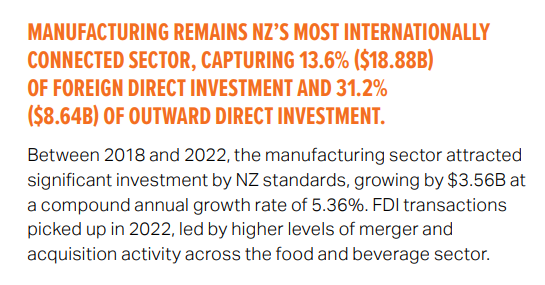
What of FDI? Manufacturing does seem to represent a larger-than-representative share of inward and outward FDI, but…
By my reckoning that compound annual growth rate for inwards investment was less a bit less than the growth in nominal GDP over that period, so not exactly a very positive story for “the backbone” of the economy, “a critical engine” of New Zealand’s “long-term prosperity, making a vibrant contribution to the nation’s economy.
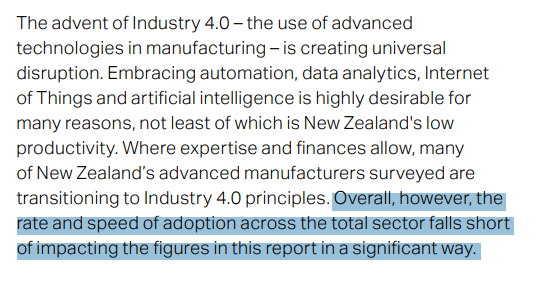
The report would really quite like to be upbeat about new technologies, but….
And those were the last words of the Executive Summary.
There are some more detailed sections that follow. A new snippets:
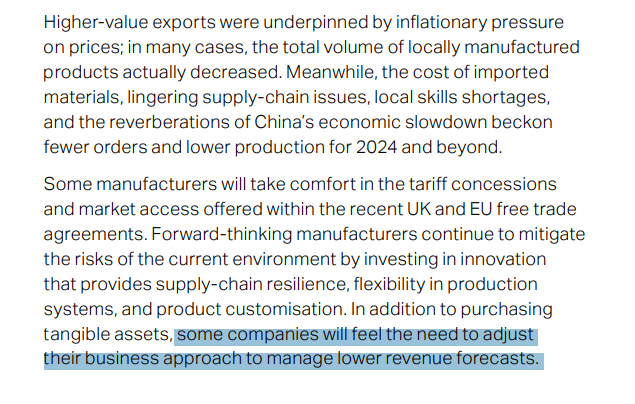
On international trade:
in addition to that wonderfully-understated last couple of lines, note “in many case, the total volume of locally manufactured products actually decreased”, and “[various factors] beckon fewer orders and lower production for 2024 and beyond”
On R&D etc:
Nominal GDP rose faster than that.
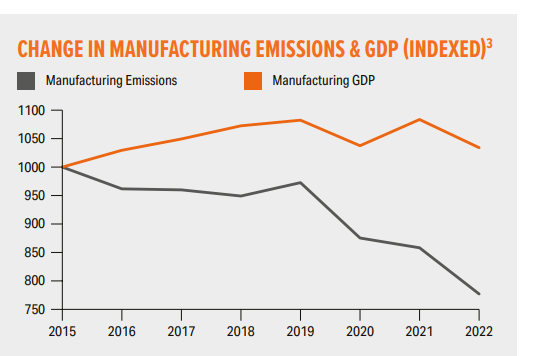
And this grim observation
The exciting news is that emissions have dropped, and not just because of a dismal GDP performance, but that is an input, not the sort of outcome firms go into business to achieve.
What of profits? They grew more slowly than nominal GDP over this period, and represent 7.6 per cent of economywide profits even though the sector is 9.1 per cent of GDP.
The best you could really say for this report is that, underwhelming as the data are, perhaps it provides some sort of benchmark against which to measure where things go from here. But why the spin upfront, and why was the taxpayer paying for the report in the first place?
None of this is intended as a criticism of any specific company in the sector. Companies that survive and thrive in New Zealand, selling to world, deserve a fair bit of admiration and in the case studies at the back of the report there are some really inspiring stories (I don’t include taxpayer-subsidised NZ Steel among them, nor perhaps the company that has been running since 1981 and has a grand total of 115 employees). In all my years at the Reserve Bank one of the best things I ever did was to participate in the regular business visits programme, and it was rare not to come away from each and every company we visited admiring people – often owner-operators – who had everything on the line to make and sustain a business (it was hard not to think they were doing something better or more useful – certainly much more risky – than we were).
But the aggregate story just doesn’t seem to be a very positive one, if such aggregates (“the manufacturing sector”) make much sense at all (the New Zealand “manufacturing sector” is a very diverse thing, including new and cutting-edge firms and legacy companies from the eras of protectionism and Think Big). Beyond the puff pieces at the start, there is a certain grim realism about many of the comments on the numbers (see above), but perhaps it would have been better to have had that upfront, grabbing the headlines.
There is no right or wrong answer as to how much of a “genuinely” advanced manufacturing sector a successful New Zealand economy might be expected to have, but it isn’t surprisingly the sector struggles here when you combine things like distance, high company tax rates, obstacles to foreign investment, and a real exchange rate that for decades has been out of line with relative productivity fundamentals
Earlier in the week a journalist asked me for some thoughts on which political party in government had managed the economy better – in overall macroeconomic terms – over the years since we moved to MMP.
My initial response was that the answer would be pretty dull. Pressed to write something anyway, I outlined briefly why really there was not a great deal between them, at least without a great deal more in-depth study. And that shouldn’t be very surprising. After all, external shocks happen (overseas, or physical/climatic ones here), and cyclical macroeconomic management has been outsourced to the Reserve Bank over all that period, with very similar targets set by successive governments. Crude partisans might point out that (core) inflation went outside the target zone at the end – or so it appears likely – of both Labour governments over that period, but those failures are first and foremost on the Reserve Bank. Other crude partisans might point out that unemployment has been at its lowest right towards the end of both Labour governments, but……since that is basically the same phenomenon as the overheated economies that gave rise to the inflation problem, you are back with it being the Reserve Bank’s mistake again. One can argue, say, that the current government should have done more to sort out, punish, or even support (via fiscal policy) the Reserve Bank, but…..it is a sample of one event.
When I wrote something a bit fuller on this topic a few years ago, I noted that fiscal policy had also largely been a bipartisan success story. We might not have had a very successful economy, but when deficits have emerged governments of both parties have restated their commitment to surpluses, and had delivered. You could argue that National deserves a better rating there, having inherited large deficits in 2008 (as I’ve argued here before Labour had been badly advised by Treasury and did not think it would be leaving deficits) and returned to surplus. But actually if you look back at the 2009 and 2010 Budgets, contemporary Treasury estimates were that – starting from a deficit – they were expansionary. I’ve been quite critical of this government’s fiscal stewardship over the last couple of years, but…..nothing much in the campaign suggests any more urgency for or conviction about a return to surpluses from the other side.
But the backdrop to it all was that while, until quite recently, New Zealand – under governments led by either party – had done reasonably well on the stabilisation side of things (monetary and fiscal, and even with structural policies that kept the non-inflationary rate of unemployment fairly low), productivity (or the lack of it) was the elephant in the room. It has been for a long time, and still is (or should be).
We don’t have an official quarterly labour productivity series, but it is easy enough to construct one’s own. In this chart, I’m showing the average of production and expenditure GDP measures, divided by hours worked from the HLFS, all normalised and expressed in log terms. Expressing things in logs means that a slowdown in the growth rate is mirrored in a flattening of the curve. We don’t have long runs of official historical data in New Zealand, but this goes back to 1987Q2.
If you can easily see any great difference from governments of one party to governments of the other you are more eagle-eyed (or perhaps “motivated”) than I am.
But I did check anyway. One could go from the last quarter of the previous government to the last quarter of the next one, but….there is clearly noise and measurement error in the data, and nothing is that precise, so although I checked both, this little table uses annual data (eg average change from 1990 (last year of that Labour government) to 1999 (last year of that National government) and so on. Now, no one really believes that changes of government make a difference immediately, so this is illustrative more than anything.
Average annual growth in real GDP per hour worked (%) 1990-1999 National 1.1 1999-2008 Labour 1.4 2008-2017 National 0.9 2017-2023 Labour 0.7
Much the biggest story isn’t the difference between the parties, but the difference over time. Productivity growth in the last decade or more – under both governments – has been materially lower than it was earlier in the period – under governments of both parties. This is consistent with the factoid I’ve thrown around a few times in recent weeks: in OECD league tables for labour productivity we dropped six places – in a club of only 37 – in the last decade.
Here is the deterioriation illustrated graphically. Eyeballing the data it looked to me as though there was a break around mid 2010. So what I’ve shown is (a) the actual data per the previous chart, and (b) an extrapolation to now of the trend in the data from 1987 to 2010.
Roughly speaking the gap between the two lines as of now is equivalent to a 10 per cent loss of productivity (growth we would have seen if the previous trend had continued).
Note that all of this is simply New Zealand data. I have repeated often charts showing our deterioriation – or at best lack of catch-up – relative to other advanced countries. But this is us. And remember that we are so far behind the productive frontier economies – it would take perhaps a 60 per cent increase to catch them – that even to the extent world productivity growth slowed down (and it did, in the US from about 2005) there is no necessary reason why New Zealand productivity growth needed to slow. Our slowing was about New Zealand policy choices, passive or active.
It is depressing how little serious attention has been paid to these failures – and challenges – in the election campaign, and since politicians mostly display little interest our bureaucratic institutions don’t bother doing or supplying the hard analysis. Some are simply emasculated to that end – one could think most notably of what the current government has done at the Productivity Commission. Productivity really matters for our future material living standards, and even for the shiny baubles both main parties try to woo us with.
I’m not an ACT supporter – on quite different grounds – but here I would give that party some credit. Their policy document on productivity evinces a degree of seriousness about the issues that nothing from any of the other parliamentary parties has even hinted at. I don’t agree with all the specifics, and would probably disagree substantially on some, but….they write as though it matters. And that isn’t nothing (even if it can’t overcome my scruples about the party leaders’ values etc). In fact, a week or two back a reader not otherwise known to me got in touch and asked who I thought they should vote for if it was housing affordability and productivity that mattered most to them. Making clear that I was definitely not an ACT supporter myself, I nonetheless gave them an analyst’s answer: probably ACT, on both counts.