All the interest in the Orr-departure story – the background, and the subsequent and ongoing efforts to mislead the public by the Board and the temporary Governor – seems to now centre on the Ombudsman. Various people, including me, have appealed the Bank’s OIA obstructionism on specific requests and the Ombudsman seems to be pursuing the issue reasonably expeditiously. I received a draft of a provisional opinion the other day for comment (which I have now provided extensive comments on) but I’m guessing it might be a couple of weeks before we get a final decision. I’m going to be away for a while so I don’t expect to write anything more after this post for at least a couple of weeks.
For the record, the Herald has an article today on the Reserve Bank staff cuts. Most of it is ground covered in my post last Friday. But the one bit that caught my eye was this

To which there are so many possible thoughts in response:
- Surely no serious external observer ever thought they needed what they had bid for to do their statutory duties effectively,
- But if the Board is now confident that everything can be done with 20 per cent fewer staff than they had in January, why did they ever bid for so much more money? (And it was the Board’s bid, perhaps championed by the then Governor but he was their agent and they had responsibility for governance, budgets etc),
- And if “no work programmes have been cut” [“out altogether” appears from context to be the intended interpretation] a) what were all those people previously doing? and b) given all the non-core stuff the Bank got into under Orr, why on earth not?
- It seems like further evidence that the modest cuts Willis imposed relative to what Grant Robertson had allowed the Bank to spend did not go anywhere near deep enough.
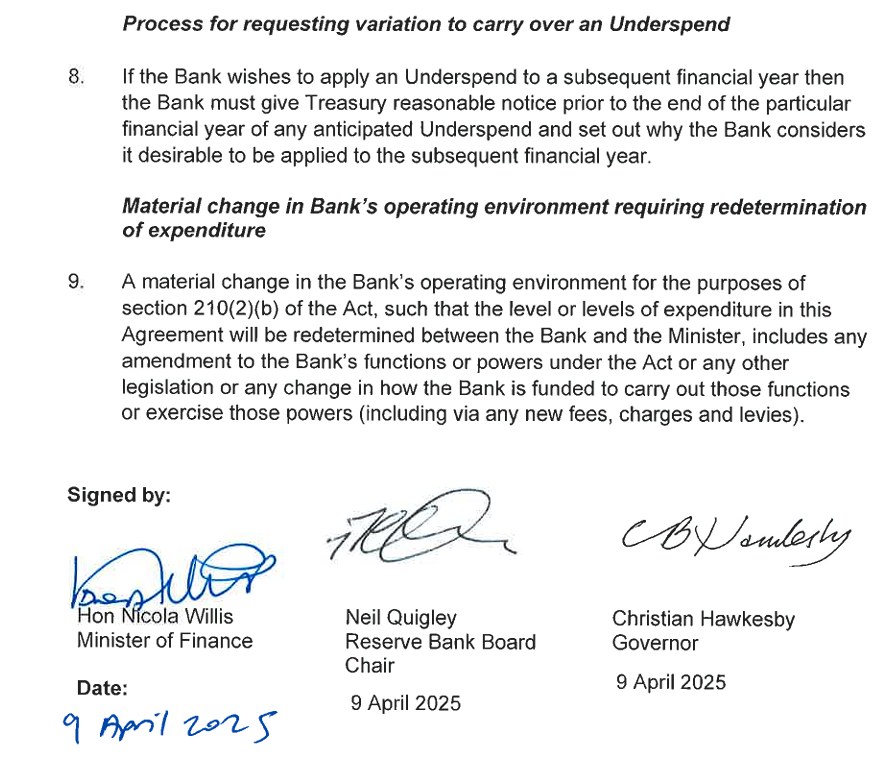
And it remains extraordinary that none of the Board members has had the decency to resign and that the Minister continues to express confidence in the chair, whose signature had been on that egregious bid late last year for so much more money, in which he and the Governor stated that that increased funding was what was appropriate “to deliver on our mandate and agreed outcomes”.
So many puzzles and so few explanations when it comes to explaining the last 10 months or so of the Orr tenure, that all ended so ignominiously on 5 March, coverups and all.
But another OIA response came in from The Treasury yesterday (having taken the best part of two months to provide two pages of information (and not withhold or redact anything)). Another of the puzzles around that final year or so is why Treasury appears to have been doing its monitoring role of the Bank so poorly (and this is a formal monitoring role, for which resources are formally allocated, established under the overhauled Reserve Bank Act in 2021).
This had been the request, lodged on 16 June

Some of this had already been overtaken by events because the Reserve Bank had already released to me Treasury’s comments on the draft 2024/25 Statement of Performance Expectations (SPE), and then had released the draft SPE and covering note the Bank had sent to the Minister of Finance.
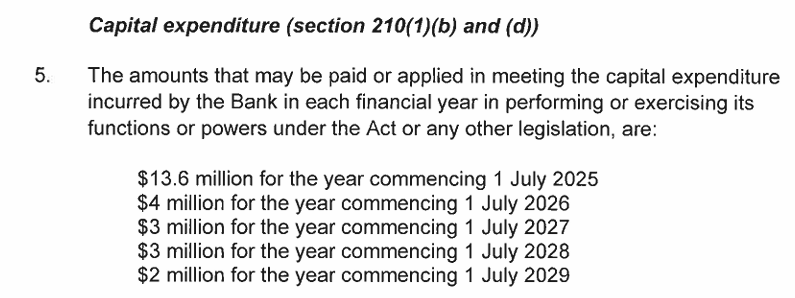
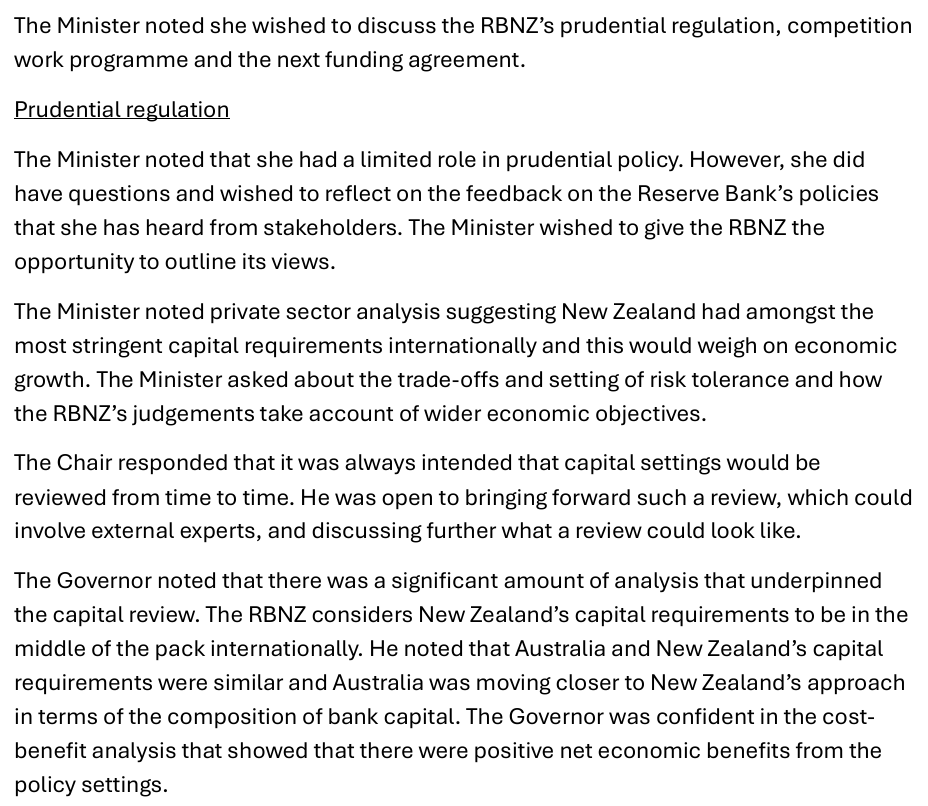
The mystery, you will recall, was that the Bank had chosen to spend about 23 per cent more in 24/25 on matters covered by its Funding Agreement than the variation approved by Grant Robertson just before the 2023 election had allowed. Surely, it seemed, Treasury and the Minister of Finance would have pushed back strongly on this? But it emerged – all documented in previous posts – that the Bank simply chose to leave out the planned budget numbers from the draft SPE they consulted the Minister on. She simply wasn’t told about this planned excess, and Treasury had not flagged any concerns to her (they’d noted that the draft SPE didn’t have the budget figures in, but raised no particular concerns and simply noted that the numbers would have to be in the final version). They were, but there was no particular reason for the Minister or her office to look closely at the final version because they’d not been alerted to any particular areas of concern, or requested any major changes to the draft. As I’ve noted before, perhaps the Minister and her advisers should have been more suspicious – Willis had scarcely been on record as an Orr fan – but the real fault seemed to lie with Treasury. They are, after all, supposd to be the guardians of the public purse.
So what new do we learn from yesterday’s release? Mostly, it is about gaps – and not in what they released, but in what work never seems to have been done.
There were four limbs to my request.
On the first, it seems that there was no additional analysis or advice internally, and certainly nothing documented outlining any concerns as to what the Bank might be up to or suggesting (say) that they should insist that the Minister was alerted to the planned budget for 24/25. There is no sign in any of the material that Treasury was even aware of the scale of the planned spending blow-out, let alone suspicious of how such a blowout might be used to try and leverage more resources in the forthcoming Funding Agreement bid.
The third limb related to something I’d spotted in this year’s government Budget documents.

A not inconsiderable chunk of the “savings” in this year’s Budget ($144 million in fact) was this item. We were told, reasonably enough, that the figures now included in the 2025 government Budget reflected the new Funding Agreement that had been signed and released in mid-April. But why had figures so much higher ever been included by Treasury in the HYEFU last year? After all, much higher numbers had no warrant in any document any minister had ever seen (eg the draft SPE – see above) or signed (eg the Funding Agreement then still in place covering the period to 24/25). Why, in an environment of fiscal stringency, had Treasury included levels of Reserve Bank spending for the next few years far higher than anything authorised from the centre to that point?
The answer, it appears, is that no one bothered to look or check or think. Treasury told me that “there is no material in scope of the third part of your request”. And went on to tell me that “we note that the RBNZ provides the Treasury with operating expenditure forecasts which are used in the Treasury’s Half Year Economic and Fiscal Update (HYEFU)”. Which seems almost beyond belief. The Bank isn’t a tiny entity (say the Walking Access Commission), but one spending a couple of hundred million dollars a year, and one which had been increasing its spending substantially, and yet Treasury staff simply took whatever the Bank told them it planned to spend for the following few years and stuck it in the formal fiscal forecasts without apparently raising any questions at all. Not exactly a fearsome (or effective) watchdog.
One reason I’d asked about those HYEFU numbers is because I knew that the Bank had lodged its egregious bid for the following five years with the (acting) Secretary to the Treasury on 13 September. I’d assumed that between then and when the HYEFU fiscal numbers were finalised (27 November) somebody at Treasury would have (a) looked even a little closely at the Funding Agreement bid, and b) raised some red flags about a bid that used as a baseline spending levels so far ABOVE what was allowed in the still-current Funding Agreement, and c) perhaps (optimistically) gone back and looked at how the 24/25 budget had been set relative to those Funding Agreement limits. They might even have alerted the Minister.
And that was the gist of the second limb of my request. In fact, it appears that none of this happened. Treasury never actually responds directly to that bit of the request but (a) does not say it is withholding anything, and b) notes that two documents are in scope and soon to be released (as part of the long-delayed pro-active release of papers relating to the 2025 Budget). The first of those is “T2025/3027 Aide Memoire: Preliminary assessment of the Reserve Bank of New Zealand’s funding proposal for the 2025-30 Five Year Funding Agreement”, and is dated 13 February. That appears to be the first time anyone at The Treasury had put anything in writing on an egregious funding bid they’d received five months earlier (from an agency with a chief executive who was well known for his aggression etc). It seems almost unbelievable, but there it is.
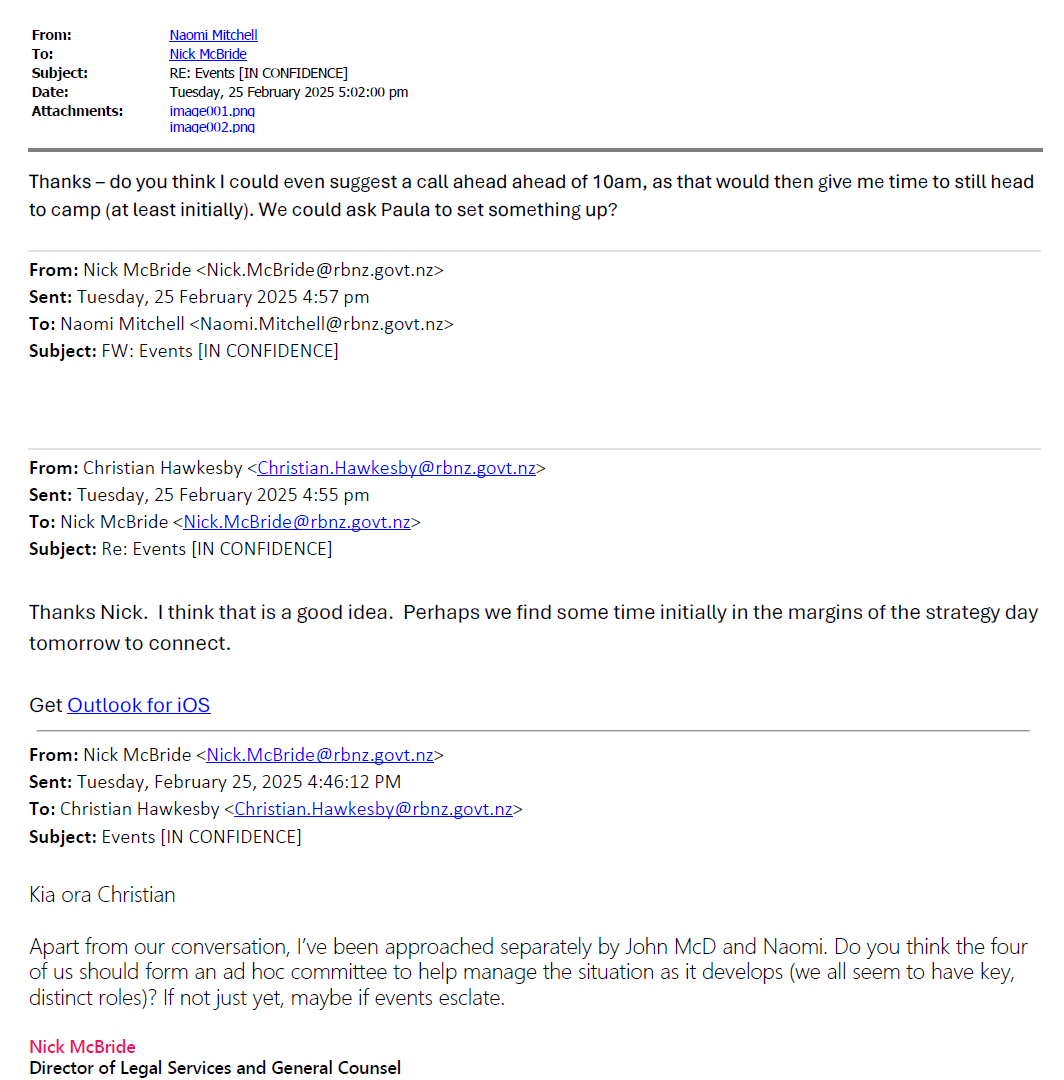
I am loathe to accuse Treasury officials of playing fast and loose with the Official Information Act, but in this case it is hard to believe I have been given a straight answer. Why? Because we have the written words of the former Governor to his senior leadership team, cc’ed to the Board chair and deputy chair. This, from 5 February, is from the Bank’s 11 June release

You don’t tell people to “cease and desist negotiating with various Treasury Officials” if there had been no discussions and negotiations. And you don’t pull down your initial bid (see second to last line) if there’d been no prior reaction from Treasury or the Minister, and it is hard to believe that Treasury had put nothing at all in writing prior to then (and had not let the Minister know there was a looming issue).
But I guess it is plausible that no one much at Treasury had turned their minds to Funding Agreement issues for months after receiving the bid. Which doesn’t reflect well on them at all.
The fourth limb of my request covered any material of substance relating to Funding Agreement negotiations from 1 December until the date the Cabinet paper was lodged (1 April as it turns out). I’d narrowed the timeframe because I’d assumed there’d have been initial reactions earlier (after 13 September) but what I was interested in was the stuff that had led to the blow-up with the Governor). Treasury does not directly respond to this limb of my request either, but lists another paper soon to be released, dated 13 March (ie post Orr), a formal Treasury Report on funding agreement issues. And that is all. If Treasury’s responses are at least approximately truthful, it seems that they were very late in getting onto this set of issues (either future Funding Agreement bid, with its artificially high purported baseline, or the 24/25 budget itself, which had blasted through the then Funding Agreement limits).
If so, one might – just possibly, and in a mood of charity – be marginally less unsympathetic to the Governor. Perhaps he really thought he was going to get away with a) the massive 2024/25 overspend, and b) the artificial baseline for the new Funding Agreement. After all, it seems there had been no Treasury challenge or scrutiny at all, and his numbers even seemed to have found their way into the official fiscal forecasts with no challenge or question. It is astonishing that for months – dating all the way back to that draft SPE – there seems to have been no serious pushback, from the Minister or from Treasury. What sort of job were top Treasury officials doing in monitoring this powerful Crown agency? Not much of one it appears. Deputy Secretaries (both now out of the jobs they held then) are recorded as having turned up for chats at Board meetings, but what of it if excess of this sort was allowed to roll on for months unchallenged?
It is always possible that the way my OIA requests were drafted means something of significance has been able to be withheld as not quite falling within the specific scope of those requests. It is certainly difficult – nay impossible – to believe that there was nothing at all prior to 13 February. But it certainly doesn’t look as though Treasury was doing its job in a way citizens, let alone the Minister, might have reasonably expected that they would be.