If only there was a supportive government

I picked up The Post this morning and in an article about some of the fiscal challenges governing parties may face came across this line about the latest pay offer to secondary teachers. The journalist might have been channelling the Beehive with his line that “it’s a very good offer”, “the union would be mad to turn it down”, and (most striking to an economist) “remarkably the pay hike is more than double that of the rate of inflation”.

Knowing it was a multi-year settlement, well after the expiry of another multi-year collective, that was really a bit much: apples for oranges comparisons sprang to mind. So I went and tracked down some numbers, and then some more numbers. The first round were in a Twitter thread here.

Over time one normally expects to see real (inflation-adjusted) wages rising. In New Zealand, as in most places, they were last decade. But times have been tough since. In this chart I’ve used the best (stratified) measure of private sector wages rates, deflated by the CPI.

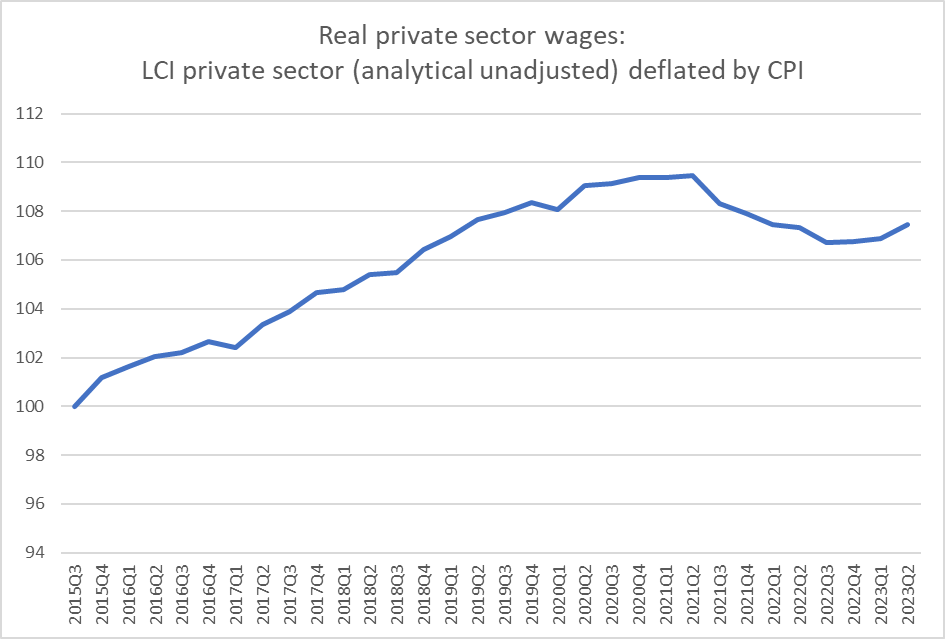
In the last couple of years there has been a significant setback. On this measure of real wages, as at Q2 this year real wages were no higher than they had been four years earlier. There are probably several factors at play: prices (inflation) often adjust faster than wages, especially when there is an inflation shock out of blue, forecast by almost no one. But – despite the record low unemployment rate – there are also other dragging factors; notably the fact that there seems to have been very little economywide productivity growth over the last several years, and the terms of trade have also fallen quite a bit. There are no mechanical linkages from any of these influences to wage rates, but in many ways the recent poor performance of real wages might not be considered too surprising.

But even so, on average, New Zealand real wages rates last quarter were still about 7.5 per cent above where they’d been at the start of the period shown.

Why did I choose that period? Because back in the dark woebegone (or so the left and the teacher unions would have it) days of the Key government the second most recent secondary teachers’ collective employment was signed (October 2015). Backdated a few weeks, the teachers got a payrise, and an agreement to a couple more pay rises over the following couple of years. Multi-year nominal agreements make some sense (keeping down negotiating costs etc) when inflation is low and stable.

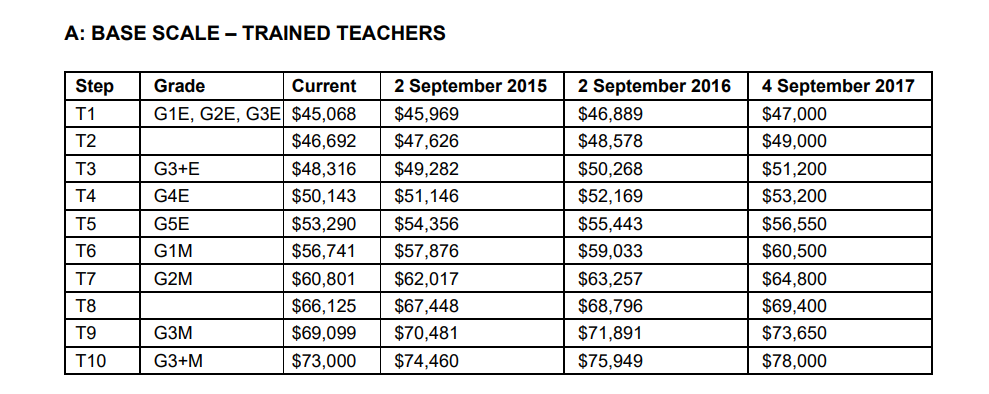
In July 2019 another three year agreement was signed, this time by the Labour government.

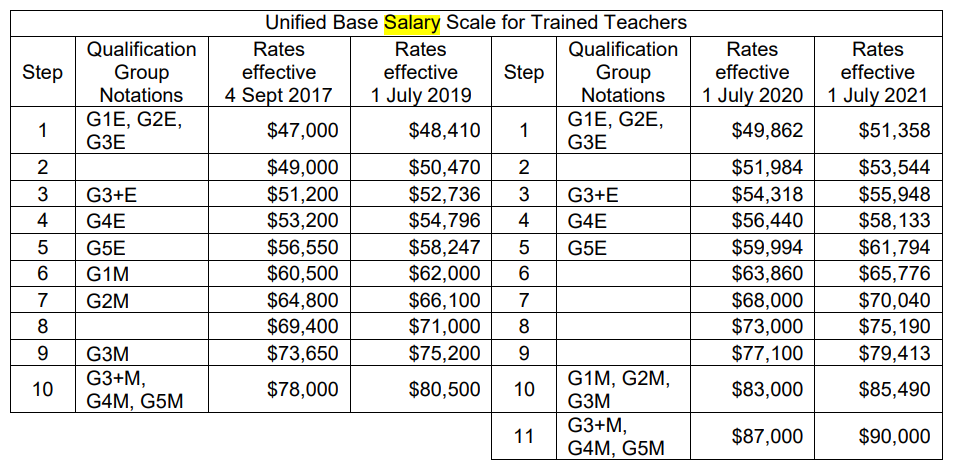
You can see the first column of that table is the final column of the previous table. You can also see the new top of scale step added to the table.

The latest offer by the government is for increase of 6 per cent backdated a few week to 3 July, another 4 per cent next April, and a final 3.9 per cent on 1 December next year. I’m not clear whether the proposed agreement would be for two or three years, but these are the wage increases offered. The July 2023 increase appears to represent the first salary increase since July 2021, in which period inflation has run far away that earlier negotiators will have expected. As it happens, the labour market has also been very tight in that time.

What I was curious about was how teachers were doing (a) relative to the CPI, and b) relative to private sector wages (why private sector? Because they tend to move a bit more flexibly in response to economic conditions rather than political imperatives.)

The secondary teachers’ scale now has 11 steps. For simplicity, I looked at just bottom one (T1), step 5 (T5), and the top step (was T10, now 11). Incorporating the 3 July increase teachers are being offered this is how real teacher salaries from 2015 to now compare with the movement in private sector real wages over the same period.

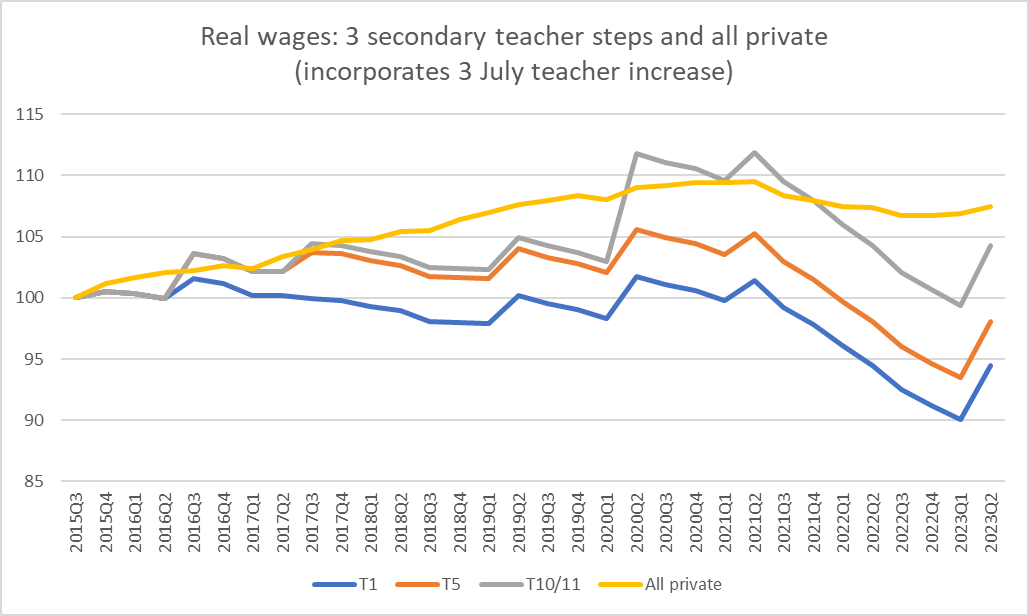
All three steps leave teachers right now behind the private sector as a whole, with only the effect of that new top step added in 2019 bringing that group of teachers somewhere close to the average private sector movement over those eight years.

But, of course, the offer includes two more pay increases for secondary teachers. Those are known, and if the offer is accepted, guaranteed. We don’t know what the inflation rate will be over that period (or what inflation rate either the teachers or the government had in mind) but the Reserve Bank is responsible for inflation and they publish quarterly forecasts. The most recent ones were published in the May Monetary Policy Statement, and my sense is that they may be a little low. But in the next chart I’ve used them to deflate the teacher pay rises.

We also don’t know what will happen to private wages, but again the Reserve Bank publishes forecasts (they publish forecasts for the private sector LCI, but I’ve adjusted them to a private sector LCI (analytical unadjusted) using the recent gap between the two series. The Bank expects quite a bit of growth in private sector real wages in the next 18 months.

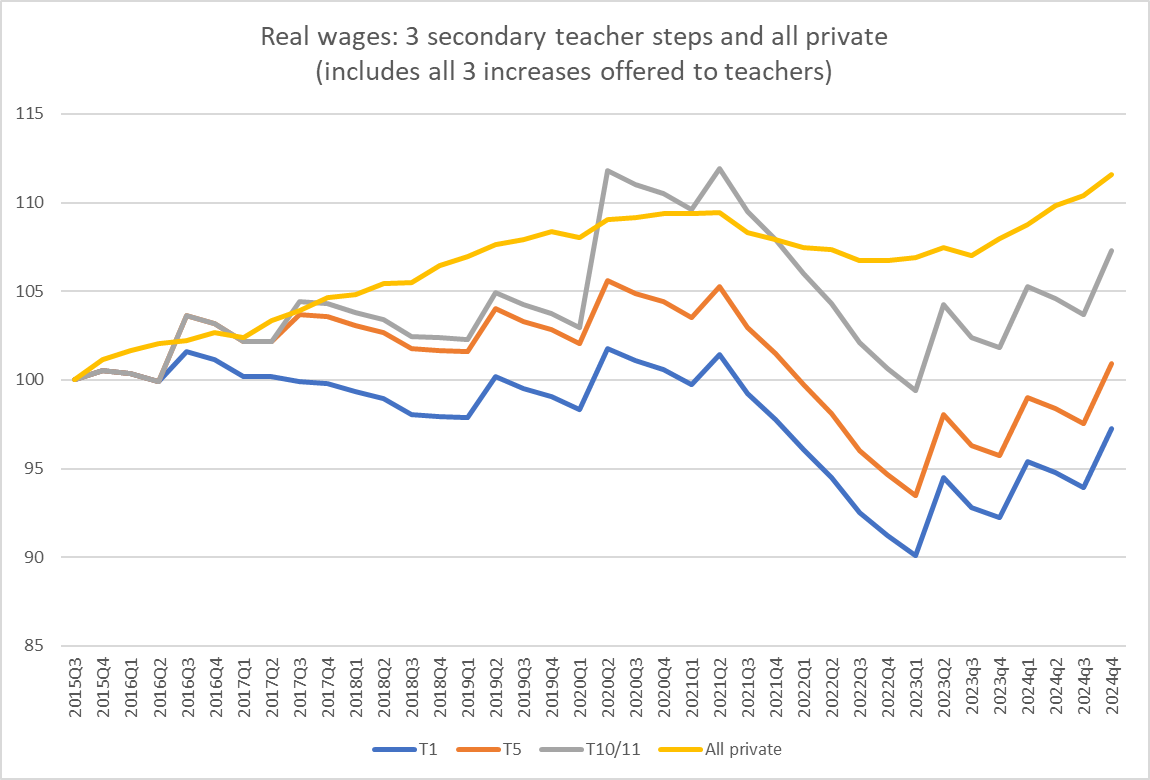
Over 9 years, on these forecasts, private sector real wages would have risen by 11.6 per cent, but the real wage rate for starting teachers will have fallen, and that for the middle step hardly have changed at all. Even that new top step included in 2019 doesn’t bring the real increase close to that for the average private sector job.

(There is a one-off lump sum payment as part of the offer, but that is best seen as “compensation” for teachers having been caught under a multi-year agreement with hugely high unexpected inflation – the direct responsibility after all of a government agency. It doesn’t affect real wages looking ahead, or thus recruitment/retention choices/challenges.)

Of course, it is up to the teachers whether or not to accept the offer. Perhaps on average it replicates what a market process would eventually have thrown up, and recruitment and retention will no longer be a challenge for schools once this agreement is in place. Or not.

But it is a little curious to contemplate the sight of a left-wing government, of a party long quite closely aligned with teacher unions, asking teachers to agree to significant real wage cuts relative to what was envisaged when the previous agreement was signed in 2019. Critics of the declining quality of the education system might suggest that such an outcome as only fair and reasonable, but I rather doubt that is the message the former and current Labour Ministers of Education have in mind.

And in a high-performing education system you probably wouldn’t expect to see secondary teaching real wages falling, and falling behind those of the private sector as a whole.

But with only one child left in school, if the offer ends the strikes for the last 18 months of our direct exposure to the system I guess that will count as some small mercy.

PS: One slight consolation of the current outbreak of inflation is the reminder for a new generation of just why high and unpredictable inflation is a bad thing. Not only do multi-year agreements become a lottery, but there is all that money illusion that leads people to see a 14 per cent one-off increase as large or generous,

Policy costings offices in Australia

After my post yesterday I remembered that I had also written a post in 2019 based around the excellent talk Jenny Wilkinson, then the Australian federal Parliamentary Budget Officer had given at Treasury in 2019. I ended that post this way

….it was a very useful presentation (I hope Treasury makes her slides available) from a technocrat’s technocrat.  I’m left sceptical on two main counts:

  • first, whether elections ever much do, or really should, turn much on precise fiscal costings. Perhaps it appeals to inside-the-Beltway technocrats to conceive of that model, but I see elections as mostly about things like competing visions, competing personalities, competing diagnoses, and competing claims to competence.  If so, why spend so much on highly-detailed and expensive state-funded costings, that the parties themselves don’t think it worth spending their own money on?
  • second, we should think harder about the whole panoply of support and information etc we provide to political parties and the public, preferably without further reinforcing the favoured position of established large parties.  Thus, it is interesting to note that written parliamentary questions are much much less used in Australia, as a way of garnering information, than is the case in New Zealand. (“In the years 2008–2014 only about 8 questions in writing were being asked each sitting day, but this number increased to 19 in 2015, and was 14 in 2016.”).   What about better resourcing select committees (to me a better use of money)?  And if we threw in a free PBO service, should we reduce existing money parliamentary parties are funded with?  If not, why not?  And would resistance to that idea suggest the costings were some epicurean nice-to-have rather than a central element of a well-functioning democracy?  And then, of course, there is the OIA.  Mightn’t it be better to require agencies to release documented costings models themselves, in ways that would allow political parties and their consultancy firms to use them to the extent they judge appropriate (and not otherwise).

And if I had the analytical resource implied by 40-45 more staff and had to deploy it somewhere in the public sector, it is far from obvious that a policy costing operation (with supporting analysis and research as the PBO) would offer the highest benefit-cost ratio.

Rereading that got me thinking again about the resource requirements for such an agency in New Zealand, that both Grant Robertson and Nicola Willis now seem keen on (despite apparently straitened fiscal circumstances). As I noted in yesterday’s post, no small advanced economy I’m aware of runs one of these costings offices (Australia, you will recall, has five times our population and rather more than that multiple of real GDP, the real resources used for this luxury product). And policy issues aren’t really less complex or less numerous just because your country is smaller (Australia has some federal/state interaction issues, but they aren’t likely to material affect the potential demand for policy costing work).

As far I can see there are three such costing offices in Australia. I will focus on the federal and Victorian versions, but the first such entity was the New South Wales one.

The NSW entity is a bit of an odd beast, and I don’t think anyone has championed anything like it in New Zealand. It is set up only for the 9 months prior to each state election (not sure if snap elections are allowed in NSW), and can be used only by the leaders of the two main parties, who in turn are required to submit all their policies to the PBO 10 days before the election, and the PBO is required to publish costings for them at least 5 days before the election. It seems to be staffed largely by temporary secondees from existing public service departments, overseen by an academic. From the report on the 2019 election, it seems to have had about 20 staff at peak

In practice, it seems that parties work with the PBO behind the scenes in advance getting their policies costed, and either modifying or dumping ones that come in too expensive etc, with only the final policies and the costings of them seeing the light of public day.

If you believe in these sorts of things, I guess one can see the logic of the NSW approach, as it tries to put the main Opposition party on something like the same footing as the governing party. It isn’t a small financial or resource commitment (about the total staff numbers of, say, our Productivity Commission), for what is after all only a state government, but it is only for 9 months every three years.

What of the federal Parliamentary Budget Office? There is quite a lot of material in that earlier post. One other extract that might be worth bringing forward is

…in answer to a question from me, Wilkinson observed that what the PBO can best do is cost programmes that represents small deviations from the status quo (they have good tools to estimate direct and immediate fiscal costs/gains) while wider economic second round effects, and the associated fiscal impacts, are likely to be small.  But, and using her own (deliberately extreme) example, if some party were to campaign on getting rid of the welfare state, her office could do the direct fiscal costs, but could offer little or nothing on the wider economic (or social) effects of such a policy, including the possibility that it might have large long-term indirect fiscal implications.    They will only offer qualitative statements about those wider effects.  Which left me thinking that the the PBO probably does very well on things that don’t matter that much, and can’t offer much on the bigger issues that elections probably should really be about (whether about the welfare state, climate change, productivity or whatever).   

They do a lot of costings

Another aspect of the presentation that surprised me was (a) the number of costings the PBO does, and (b) the extent to which demand is not concentrated just in the pre-election period.  In fairness, she noted that the latter had surprised them too.  In the most recent year (an election year) they’d done 2970 costings, while in the previous two non-election years they had averaged about 1700 costings. Only MPs can request costings, and there are 227 MPs (across House and Senate).     Those numbers don’t mean 2970 separate items of policy, as many of the costings will be, in effect, rework as members or parties iterate towards a policy that meets their ends and will be scored by the PBO as not costing too much.

but note (see above) how much less extensively written parliamentary questions are used in Australia.

At the time of that 2019 presentation, Wilkinson told us her office normally had about 45 staff, scaling up to around 55 at elections (and recall that this is a federal government, in a system where a lot of policies are state responsibilities). The table in the latest Annual Report suggests that is still about right

What of the Victorian state Parliamentary Budget Office? Here is what they say they do

All MPs have access (unlike in NSW).

This doesn’t come cheap. Their documents say that for last year’s election they peaked at 26 FTEs, and they appear to have a permanent staff of about 16.

For a system of unitary government it seems reasonable to think in terms of the combined Victoria plus federal offices (which thus cover all the policy areas that affect Victoria, whether via federal or state policy). That seems to involve a base level of 60 staff, scaling up to perhaps 80 in the run-up to elections.

Now, of course, Australia is a fairly big country. But as already noted, neither the number of policy issues nor the design complexity of those policies is really scalable with the size of the country. And it seems most unlikely that one could do a worthwhile job – across the multiplicity of areas of policy – with 12-16 staff in New Zealand. In fact, I find it difficult to see how it could be done well – and there is really no point if it is not done well – with fewer than perhaps 30-40 staff.

That would be bigger (much bigger) than either the Productivity Commission or the Parliamentary Commissioner for the Environment (21 staff). Would it be a priority use of scarce resources for taxpayers to be putting this additional financial assistance towards political parties and MPs? I continue to think that better-resourcing select committees would have a much larger payoff for citizens and good governance. There is likely to be a good reason why no other small advanced countries run state-funded policy costing offices (while parties themselves are of course free to use economics and other consultancy firms to the extent they find useful – in a political market).

Issues of scale are very real for small countries’ central government policy functions. I’ve already mentioned that the Productivity Commission has 15-20 people in total. To the extent there was an inspiration behind our Commission (as distinct from a bauble for the Key government to throw ACT’s way), it was the Australian Productivity Commission, which has over the years produced a lot of useful reports. The latest Annual Report suggests that Commission has 165 staff and 12 commissioners. The sorts of issues facing Australia are not likely to be any less numerous or complex than those facing New Zealand, and even if the staff of our Commission walked on water they simply could not match the value that could be added by the Australian Productivity Commission.

I would have thought there was no credible way we would devote 180 people to the Productivity Commission – nor do I think we should – but I guess if the Ministry for the Environment now has more than 1000 staff really who knows anymore. But with 15-20 people it was always going to be vulnerable to going the way it has, and was always going to struggle to maintain depth and critical mass.

The pool of really able people is small, and fiscal resources are limited (in a smallish underperforming economy). It just doesn’t make a lot of sense to be thinking of putting dozens of people into helping political parties cost their specific policies. On the track record of their performance, nor does having 15-20 people in a Productivity Commission that now seems, in practice, to perform a more general role in support of political parties of the left. A new government should rebuild Treasury, and if there is resource it would be better spent strengthening select committees to scrutinise actual legislation and actual government agencies, rather than (further) funding the bids of the parties competing for the keys to the Beehive.

Policy costing

Yesterday one of the Labour’s surrogates – Craig Renney, economist at the CTU, but also former adviser to the Minister of Finance (and reputed to be interested in being a Labour MP himself) – came out with a short document attempting to put a fiscal frame around National’s election promises. (One might have thought that if you’d been a part of enabling an $11bn hole in the government finances – the LSAP losses – you might have been a bit more modest in your rhetorical tone, but I guess he was only a (very senior) adviser).

It is explicitly partisan political in nature, and heavy on rhetoric. The flavour is perhaps conveyed by the front cover

As anything other than partisan spin though, it was a strange document. I’m as keen as anyone to see National’s programme (with numbers), but then in a week when the PM has been going round distinguishing between Labour Party policy and government policy, the same could be said of Labour’s (as yet largely unannounced) programme.

Renney’s document is built around an attempt to show that what National has announced so far does not fit within the operating allowances for the next three Budgets set down by the Minister of Finance in this year’s Budget. I have no reason to doubt that his numbers are approximately right. But (not only is it not clear that National has yet announced all its policies) there is no obvious reason why National would regard itself as bound by the operating allowances the Labour Minister of Finance had put in his pre-election budget. After all, Labour hasn’t in the past, and is highly unlikely to do so next year were it to be re-elected. (The operating allowance framework is in any case quite badly flawed as any sort of future signal, but especially when inflation is jumping around.)

I’m not championing what we know of either side’s fiscal policy. From both sides, there seems to be a disconcerting falling away from a commitment to budget surpluses, except in that vague distant future sense of the early St Augustine (“Lord, give me continence and chastity, but not yet”).

But Labour’s own (official government) numbers already have about them a considerable air of unrealism. In this year’s Budget, the only hard numbers – those planned for 23/24 – showed a slight increase in core Crown primary spending (ie excluding finance costs) as a share of GDP, but then the vapourware numbers – the ones relying on those operating allowances – show a fall from 31.2 per cent of GDP this year to 29.7 per cent in 2026/27. Another way of looking at those same numbers is to calculate – all from Budget numbers – real per capita core Crown primary spending over those three years Renney focuses on. On Labour government numbers, real per capita expenditure is projected/planned to show no growth at all in the next three years. Does that seem like a prospect that would align with what we’ve seen of this government’s approach to spending in recent years (in an era of ageing populations, public sector wage pressures etc)? Not to me. And the last three years have seen a single party government, and on all the polls if Labour were to get back in it would be dependent on the even less fiscally disciplined, less inclined to expenditure restraint, Green and Maori parties. With a Labour leader who has already ruled out the wealth taxes those two parties favour to help pay for their fiscal ambitions.

There is also the small matter of scale. Renney’s claims are that there is a gap of $3.3-$5.2 billion over the three fiscal years in questions. Since core Crown primary spending over those years is estimated at in excess of $400 billion any such gap is 1 per cent spending (or about 0.3 per cent of GDP). Seems a slim basis for such florid headlines.

But it will be good to see National’s numbers. In a better world, they would be credibly showing a commitment to a structural fiscal surplus next year. But given that Labour’s vapourware tiny surplus the following year was looking shaky from day 1 (once Eric Crampton pointed out the tobacco excise tax losses they and Treasury had accidentally left out) I don’t suppose it is likely.

But no doubt Renney’s report achieved its political end and put National and Willis on the back foot for a news cycle. National’s response didn’t seem much better. It seemed to consist first of suggesting that the economist of the CTU shouldn’t be commenting in public, which was a bit odd to say the least. And then we had the attempt to reclaim the news cycle by suggesting that it all (what?) was down to Grant Robertson not having followed through on the earlier plan to set up a budget-costing unit. National had (rightly in my view, see below) opposed the idea of such a unit when Labour and the Greens were championing it, but apparently when Willis had become finance spokesperson she had written to Robertson to express National now being in favour. Nothing had happened in the intervening year or so.

I wrote a lot about the idea of a policy costing unit here pre-Covid when the idea was being worked up by the government and The Treasury (there was a formal consultation process at one point). My most recent post on the issue was here. I ended that post with this thought

It won’t improve policymaking, it won’t change the character of elections, but it might –  at the margin –  create a few more jobs for economists.

I remain staunchly opposed. This was an extract from a submission to the Treasury consultation

Parties have adequate incentives already to make the case for their policies, in whatever level of detail the political (voter) market demands, and… already have access to the Parliamentary Library resources, parliamentary questions, and Official Information Act requests.  A policy costing office –  not found in any small OECD country –  would be, in effect, just a backdoor route to more state funding of parties (and not necessarily an efficient route – bulk funding would be preferable if state funded was to be more extensively adopted).  It also reflects a “inside the Beltway” conceit that specific costings are highly important, and that use of a single “model” or set of analysts somehow puts everyone on equal footing  (it doesn’t –  public service analysts having their own embedded assumptions about what is important, what behaviours are sensitive to what levers etc.)   With the possible exception of the Netherlands, I’m not aware of any country where a political costings office products plays any material or sustained role in election campaigns and outcomes.

Here was the list of other reasons from that 2019 post

I’ve listed most of my objections previously, but just quickly:

  • there isn’t an obvious gap in the market.   At present, political parties produce costings (sometimes reviewed by independent experts) to the extent they judge it to be in their own interests to do so.  Voters, in turn, can judge whether the presence or absence of any costings, or any debate around them, matters much.  Existing parliamentary parties have access to considerable taxpayer resources which they can draw on to develop and test policy proposals,
  • it isn’t obvious when, if ever, a New Zealand election in at least the last fifty years has turned on the presence, absence, quality (or otherwise) of election costings.  It is a technocratic conceit to suppose otherwise: people vote for parties for all sorts of reasons (values, mood affiliation, fear/hope, being sick of the incumbent, trust (or otherwise)) which have little or nothing to do with specific policy costings,
  • the relevance of specific policy costings (and indeed overall fiscal plans) is even less under MMP than it was in years gone by.  Party promises are now little more than opening bids, as coalitions of support are put together after the election to govern (and on almost every specific piece of legislation).  We simply aren’t in a world where a few dominant ministers dominate a Cabinet which in turn has a majority (or near so) in the government caucus, which in turn has an unchallenged majority in Parliament,
  • the “fiscal hole” argument (from the 2017 campaign) remains an utter straw man in this context.   First, when Steven Joyce made his claims in 2017 lots of people, including experienced ex-Treasury officials, weighed in voluntarily, and debate ensued about whether, and in what sense, Joyce was saying something important.  The system –  open scrutiny and debate –  worked.  And, secondly, a policy costings unit –  of the sort the government apparently envisages – would not have made any useful contribution to such a debate, which was about the overall implications of Labour’s fiscal plans, not about the costs of specific proposals Labour was putting forward.     Elections are messy things –  always were and probably always will be, and that isn’t even necessarily a bad thing.
  • some of the arguments made for a policy costings unit might have more traction if, somehow, every political party and candidate could be forced to use it (say, submit all campaign promises to the costings unit at least three months prior to an election, with the costings unit issuing a report on all of them say at least one month prior to an election).  But even if you thought that might be a good model, it isn’t going to happen (and there is no credible way that such a model could be enforced).  Instead, the proposed costings unit will be used when it suits parties, and not when it doesn’t, and will probably be most heavily used by parties that are (a) small, (b) cash-strapped, and (c) like to present themselves as policy-geeky.  The Greens, for example.  One might add that the unit would most likely be used by parties that believe their own mindset is most akin to that of those staffing the unit –  likely to be a bunch of active-government instinctively centre-left public servants.  Embedded assumptions can matter a lot –  The Treasury used to generate wildly over-optimistic revenue estimates for a capital gains tax, and it was probably no coincidence that as an agency they supported such a tax. 
  • the policy costings unit seems, in effect, to largely represent more state-funding for (established) political parties.  That might appeal to some, but even if you thought more state funding was a good idea (and I don’t) it isn’t obvious why this particular form of delivery is likely to be the best or the most efficient.  Money might be better spent on research and policy development (say) rather than “scoring” at the end of the process, for detailed plans that will almost inevitable change before they are ever legislated.  And if we want to spend more on policy scrutiny, I reckon a (much) stronger case could be made for better-resourcing parliamentary select committees.
  • the interim proposal for next year’s election would enable only parties already in Parliament to utilise the facility.  Again, this has the effect of further entrenching the advantage established parties have in our system (I hope it will be re-thought when the legislation itself is considered).
  • practicalities matter: there probably won’t be much demand on a policy costings unit in the year after an election, and could be quite a bit in the year prior to one.  How then will be unit be staffed and a critical mass of expertise maintained?  If people are seconded in from government agencies, would we really have an independence (including of mindset and model) at all?  And costings skills aren’t readily substitutable with bigger-picture fiscal policy (or macro policy) analysis skills.
  • the lack of transparency around the proposed institution should be deeply concerning.  As far as I’m aware there has not yet been any indication as to whether the policy costings unit would be subject to the OIA (as the Auditor-General and Ombudsman are not, and nor is Parliament more generally).   The Minister of Finance has indicated that any costings the unit did would only be released with the consent of the political party seeking the costings.  That should be a major red flag.  In my view, any new unit should be (a) explicitly under the OIA, and (b) the enabling legislation should require that any costings done for political parties should automatically be released 20 working days after being delivered to the relevant political party (or more quickly if the costing is delivered within 20 days of an election).  A policy costings unit should not be a research resource for political parties – the only possible basis for confidentiality – but a body that at the end of the process provides estimates based on the details the relevant party has submitted. (As I understand the system in Australia, costings provided during the immediate pre-election period are automatically released, but others are not.)

The fourth bullet there – re the 2017 “fiscal hole” debates – is germane to Willis’s claims in the last 24 hours. The sort of policy costings unit that has been proposed costs specific policy proposals, but does not provide reports on the coherence or otherwise of overall fiscal strategies. The presence of such a unit would have made no obvious difference to anything about the furore around the CTU report.

From a more narrowly political perspective, one might also note that if National is really championing this new source of employment opportunities for economists, and (which is what it is) additional state funding for political parties, it isn’t a great signal of the seriousness of their commitment to fiscal restraint. Renney might, after all, have the beginnings of a point.

Incidentally, in this rather silly political debate, Grant Robertson emerges no better than anyone else. He is reported as having said that National’s change of heart on a policy costings unit had meant it was too late to have done anything for the 2023 election. Except that he himself in 2019, announcing the new policy costings unit policy Cabinet had just agreed to about a year out from the 2020 election, explicitly announced a transitional non-statutory arrangement for the 2020 election, pending full establishment in 2021. If Willis’s change of heart was a year or more back, presumably the same could have been done this year. (I’m glad he didn’t of course.)

Finally, I have seen this morning at least one commentary suggesting that independent fiscal institutions are now the way of the world, the OECD champions them etc. A policy costing unit is not really what most countries – or international agencies – have in mind in advocating such institutions, which are typically more about independent monitoring and reporting on government fiscal strategy and policy (ie macro in focus). Very few countries have state-funded policy costings units, none of them small and (by advanced country standards) relatively poor.

Inflation and monetary policy: looking across countries

Time moves on. This post was going to be run late last week once the last OECD inflation data for the June quarter (that for Australia) came out, but a bad cold ran through the house and not much got done. Last night, July inflation numbers were released for the euro-area (remember that NZ only recently got mid-May’s numbers), but this post is going to focus just on the numbers to June.

This is annual CPI inflation ex food and energy (the only core measure available for a wide range of countries) as at the end of June. The sample of countries is the OECD countries/regions with their own monetary policies, excluding Turkey (with off the charts crazy monetary policy and inflation) and the OECD’s poorer Latin American diversity hire countries (but note that two of those latter countries’ central banks have already started cutting policy rates). Of two other advanced countries not in the OECD, Singapore’s (headline) inflation peaked at 7.5 per cent, and Taiwan’s at 3.6 per cent.

The diversity in outcomes across countries isn’t often recognised. Politicians and central bankers have both tended to go along with lines about “everyone is experiencing much the same thing” (which is a convenient line for avoiding specific and localised accountability). But they aren’t.

Pre-Covid, inflation rates across countries were very tightly bunched (in 2016q4 for example, the lowest core inflation rate for these countries was -0.4 and the highest was 2.9 per cent, at present the range is from 1.6 per cent to 16.2 per cent)

And here is how New Zealand has gone on this metric over the same period relative to the median of these 16 countries/regions.

Pre-Covid our core inflation rate was around the median (altho perhaps showing signs of beginning to pull away) but over recent years core inflation in New Zealand has been consistently higher than in other OECD countries (and of course now miles above target). That is on the Monetary Policy Committee. Note that at least on this measure there is no sign yet that the median country’s core inflation rate is yet falling.

There are other core inflation measures, and each country or central bank often has favoured or specific ones, sometimes ones best suited to particular idiosyncrasies at the time. But a fair number of countries or central banks have and publish either trimmed mean or weighted median measures (others have and use them – seen at times in speeches etc – but don’t seem to make the data series routinely available). It would be great if there was a consistent collection of these (generally superior to crude exclusion) measures across advanced countries, but there isn’t.

I did what I could and found trimmed mean and/or weighted median data for eight of the countries above (NZ, Australia, US, UK, Canada, Switzerland, Sweden, Norway). Even then it is complicated by things like having only a chart for one country, and inconsistencies in whether there is monthly/quarterly or just annual data available, and in whether or not seasonally adjusted data is used (NZ doesn’t). Oh, and the US has fuller data for PCE inflation – the Fed’s focus – than for CPI inflation.

Here is where the annual rates of core inflation stood for these countries at the end of June (there are no weighted medians for Switzerland and the UK)

And here is the time series for the five countries with both weighted median and trimmed mean annual rates

It is a mixed picture. Core inflation in Sweden and Canada has clearly fallen, and Australia seems to have as well, although to a lesser extent. Things are still getting worse in Norway, and in New Zealand things are probably best seen as going sideways. Of the other countries, the chart of trimmed mean inflation in the UK suggests they are still very near a very recent peak, and Swiss trimmed mean inflation is now down a little from peak.

What of the US, which gets most coverage? Focusing on the PCE measures, core inflation is clearly falling

Most countries don’t provide quarterly or monthly percentages changes, but we do have that data for New Zealand and Australia (in New Zealand’s case complicated because SNZ does not – for some inexplicable reason – use seasonally adjusted data to do the calculations. There isn’t much seasonality in the resulting series, but using raw data tends to skew downwards the quarterly changes – when, eg, there are things that reprice once a year.) Here is the NZ chart

and the Australian one

For Australia, the falling rate of quarterly core inflation is now pretty clear. Both measures now paint much the same picture. But for New Zealand while the trimmed mean suggests quarterly inflation has peaked (quite some time ago), a) there is no hint of that in the weighted median, and b) in the last couple of quarters there is no sign the trimmed mean is falling further. The fact that the two series have re-converged suggests not much grounds for comfort about New Zealand core inflation (especially when put together with the simple ex food and energy measure). On balance, perhaps we could say that the worst may have passed, but none of the series are yet suggesting anything like a quick convergence back to target (recall, the MPC is required to focus on the 2 per cent annual target midpoint).

Which brings us to monetary policy.

At their last review – incredibly, scheduled deliberately a week BEFORE New Zealand’s rare and infrequent CPI data came out – the MPC declared itself thus.

It isn’t clear to me how (a) any central bank can credibly claim to be legitimately “confident” about anything much at present (if your models got inflation so wrong over 2020-2022, why would you be confident things were working just fine now, and b) how the RBNZ MPC any particular had found any reason in the data (let alone the CPI data they chose not to avail themselves of) for their particular breed of “confidence”.

I checked the RBA and Bank of Canada statements last month: they didn’t seem confident (much more, as you might expect, data-driven). Nor did the Bank of England or the FOMC. And there was no apparent confidence that they had done what needed doing in the SNB, Norges Bank or Riksbank statements either. In fact, the Swedish Riksbank’s latest statement captured nicely what might have been expected here, on the data as it stands

This from a central bank with the same target as the RBNZ, similar current core inflation, but clearer evidence core inflation has already been falling.

It leaves a distinct sense that, as so often, the RB MPC was engaged in spin, lacking in substantive analysis.

There will some important further data out before the MPC again sets the OCR later this month (notably tomorrow’s labour market suite, and also the Bank’s Survey of Expectations – the one that so far this cycle has done a less bad job than the MPC of picking future inflation), so what they should do in August is still to some extent a question for another day (although they should, if they are at all intellectually honest, take that “confident” statement off the table). But how about where things stand now? And all bearing in mind that monetary policy works with a lag (although quite how long and variable those lags really are does seem to be up for debate).

There are central banks where you really have to wonder what is going on. For example, policy rates haven’t been raised in Hungary and Poland since September last year and both now have double-digit core inflation (still rising in Hungary). Less extreme, the Norwegian central bank has core inflation still rising, and although the central bank has raised the policy rate by 100 basis points this year, it is still only 3.75 per cent (and Norway’s latest monthly unemployment rate is still very low). Iceland also has core inflation steady at around 9 per cent.

On the other hand, when one looks at the Bank of Canada’s increase in the policy rate last month (to the highest level in more than 20 years), in conjunction with the already-falling and fairly moderate core inflation you get the sense that, if they are still too sensible to say it, that they might have good grounds for being increasingly confident of being back to target before long.

It would all be a lot easier if we had robust estimates of the neutral real and nominal rates for each country. But we don’t (neither the real rates nor the implicit inflation expectations that are actually shaping behaviour of firms and households).

And there is lots of differences across countries. For the period since 1999 (when the euro started, and the NZ OCR began) here is the median policy rate in each country (differences would be a bit smaller done in real terms, but still substantial).

All countries, except Australia, now have policy rates above those medians.

I took a look at how current policy rates compare to the peaks in each country in and around 2008. The median difference across those 16 countries is under half a percentage point (eg both the US and the euro-area now have policy rates almost exactly the same as that pre-crisis peak).

But four countries stand out, with policy rates now well below that previous cycle peak. There is Iceland. Now, the pre-2008 peak was in the context of one of the most staggering and destructive credit booms in modern times. Still core inflation is 9 per cent, and the policy rate even now is only 8.75 per cent. There is Norway: as above, core inflation is high and rising and (from a distance) it is hard to be confident things are in hand.

And then there are New Zealand and Australia, both with policy rates around 3 percentage points less than the 2007/08 peaks (and there is a pretty common view about 2008 that the RBA got lucky, not having had policy rates tight enough – in the face of a mining investment and terms of trade boom – but being “saved” by the international recession. The Australian story puzzles me: rates are well below previous cyclical peaks, the unemployment is still extremely low (including far lower than just pre Covid), but……the data (see above) show that core inflation has turned down (and while there is still a way to go, Australia’s target is a bit higher than some other countries’, including New Zealand). If I wanted to be “confident” I’d done enough, one can see a good case for higher rates (perhaps later today), but there are plausible counterarguments.

Much less so for New Zealand. We don’t have core inflation falling, we don’t have unemployment rising much (and last week’s employment indicators still looked quite strong), unlike most previous policy rate cycles there is no disinflationary support from a rising exchange rate, and the OCR is miles below the 2008 peak. (One could no doubt add in points Westpac in particular has been making about a bit of rebound in confidence, but I’m not trying to review all the data.)

Were I in the Fed’s shoes or those of the Bank of Canada I might by now be feeling somewhat more secure. Were I at the Norges Bank (as far I can see) I’d be very uncomfortable. The Australian data are perplexing but there seems nothing in the New Zealand data – considered a cross country or across time – to give any central bank decisionmakers any particular reason for comfort (let alone “confidence” at all). Macro forecasting is something of a mug’s game, and it is always possible the RB MPC may have done enough, such is the uncertainty, but it is very hard to see at this point (and the Committee has provided no analysis in support of their stated “confidence”, continuing a fundamental dereliction (no speeches, no serious research, no serious analysis) that dates back at least to the creation of the MPC). Things may be just about to break, and there are a great many uncertainties here and abroad, about how this cycle is unfolding, but the sort of “confidence” the MPC is asserting risks seeming more political (eg life seems like to be easier for Orr if Labour is re-elected) than grounded in secure economic analysis.