I’m a bit puzzled as to quite what has gone on in the New Zealand economy over the last year.
Of course, to some extent Statistics New Zealand must share that puzzlement. On their two real GDP measures – and there is no particular reason to favour one rather than the other – they aren’t sure whether by the December quarter last year real GDP was a bit higher or a bit lower than it was a year earlier. One measure shows a 1.2 per cent increase, and the other a 0.9 per cent fall. I tend to average the two measure, so a best guess now might be the GDP in December 2020 was about the same as in December 2019.
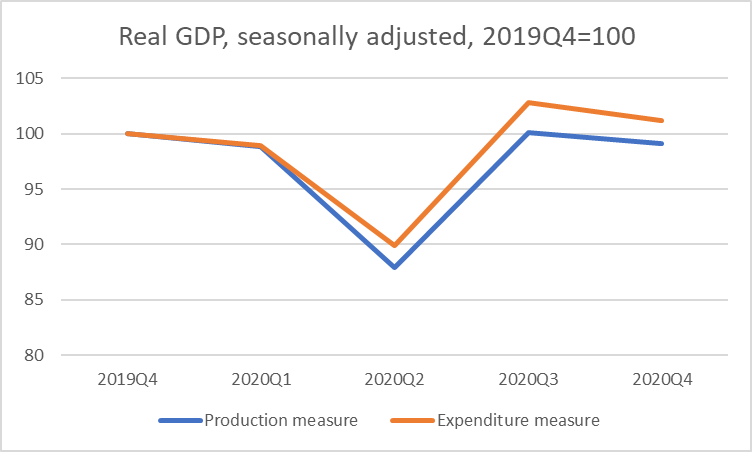
The difference in the New Zealand GDP measures is almost the least of my concerns. Unfortunately there is always some difference in these two measures (trying to measure the same thing) and things have been a bit more difficult than usual during 2020 (especially so in the June quarter). We’ll keep getting that history revised for several years.
In Australia, the (generally highly-regarded) ABS reconciles their two real GDP measures: according to them Australia’s real GDP in the December quarter was 1.1 per cent lower than in the December 2019 quarter. On the face of it, such a difference seems plausible. We both had closed international borders, but Australia had more intensive sustained closed internal borders, and a few more Covid restrictions in place. (As it happens, if one looks at 2020 as a whole the falls in real GDP in New Zealand and Australia were more similar, reflecting our horrendous June quarter.)
But dig a little deeper and things get more curious. I’m really interested in labour productivity, and have regularly run here charts of labour productivity growth (and lack of it). So I checked out the hours data. We have two measures in the New Zealand: the HLFS measure of (self-reported) hours worked, and the QES measure (based on sample surveys of firms) of hours paid.
According to the QES, hours paid in the December 2020 quarter were 0.3 per cent higher than in the December 2019 quarter. That didn’t sound too implausible, especially if GDP (see above) hadn’t changed much over the period as a whole.
Unfortunately, the HLFS reports an increase of 3.9 per cent in hours worked over the same period. And while there are always differences in the two measures (a) over a full year they aren’t usually anywhere near that large, and (b) there was nothing like such a difference in the first year of the 1991 and 2009/09 recessions. Oh, and if one was going to expect a difference in 2020 one might have thought hours paid would have held up better than hours worked (between government wage subsidies, employers trying to hold onto staff, and public servants (eg immigration and biosecurity staff who don’t have much to do, but who couldn’t be laid of, by government decision). And since the HLFS employment rate – reported by the same people – fell by 0.8 percentage points over the year (and the unemployment rate rose) it really doesn’t seem very likely that the hours worked really jumped by 4 per cent.
In Australia, by contrast, the employment rate also fell by 0.8 percentage points last year and hours worked fell by 3.5 per cent. Which sounds fairly plausible: some job losses and a wider group of people working fewer hours than previously.
So what does all this mean for productivity? In the ABS official series, real GDP per hour worked rose by 2.5 per cent from December 2019 to December 2020. That seems plausible, not because Covid and closed borders were good for productivity but because tourism and related sectors (including eating out) have been particularly hard-hit, and those are typical low wage/low productivity sectors. Even if no individual worker is any more productive, the temporary loss of those lower-skilled jobs/hours will have averaged up real GDP per hour worked over the whole economy. A clue that this is what is going on is that the lift in average reported productivity was much larger in the June quarter (more Covid restrictions), unwinding to some extent subsequently,
What about New Zealand? I usually report an indicator of labour productivity growth calculated by averaging the two GDP series and the two hours series. If I do that for last year, we experienced -2.1 per cent average growth in real GDP per hour worked. And I simply do not believe that. But even if I just use the QES hours paid measure, we end up with a 0.1 per cent fall in real GDP per hour worked for the year, much worse (on those estimates, which will be revised over time) than Australia.
Closed borders etc should be bad for productivity. If we had true estimates, adjusted for changes in capacity utilisation, we might expect to see a fall in both countries. But there isn’t really a credible explanation for New Zealand doing quite so much worse than Australia last year (in December on December comparisons), other than problems with the data.
But then I’m also left with doubts about the GDP numbers themselves. Partly because in putting together quarterly estimates of GDP – and they really are just estimates at this stage – Statistics New Zealand needs to have some sense of how many people are here, as something to calibrate their sample surveys with. And there are oddities there too, highlighted by comparisons with Australia.
Recall that both countries have had largely closed borders since about this time last year. In the year to December 2019, Australia’s population was estimated to have risen by 1.5 per cent, while ours was estimated to have risen by 1.9 per cent. And yet in the year to December 2020 our population is estimated to have increased by 1.7 per cent, and Australia’s by 0.7 per cent. Both countries have rates of natural increase, that don’t change much year to year, of currently about 0.5 per cent per annum.
Of course, as we know people have continued to cross the borders, but in greatly reduced numbers. In New Zealand, for example, a net 39000 more people left New Zealand from the end of December 2019 to the end of February 2021 (more than the natural increase over that period). There have been net outflows (mostly quite small now) each month since March last year (125000 outflow from March to February). And yet the SNZ estimate is that the official (resident) population measure has grown almost as rapidly in 2020 as in 2019. Now, of course, lots of holidaymakers went home/came home – they were always “resident” at home, wherever they were spending at the time. Lots of temporary dwellers went home/came home. But the rate of population increase SNZ is reporting doesn’t make very much sense. Again, especially relative to Australia, which has had a 180000 net outflow over the twelve months to February (and presumably quite similar dynamics to New Zealand – lots of people leaving and really only Australian citizens and permanent residents coming in).
Perhaps both numbers are right, perhaps one country’s is and the other’s isn’t. Both are using (what I thought were similar) model estimates. But on the face of it, the Australian change in resident population looks a lot more plausible than New Zealand’s (and I’m not even reporting here GDP per capita numbers).
It isn’t obvious that we have any really good, timely, independent checks on these New Zealand numbers. I’m not offering answers, just highlighting questions and uncertainties. Unfortunately it might be a few years yet until we have a really good steer on what went on last year (if ever re the June quarter specifically) and what the new emergent trends are, including re relative productivity performances of Australia and New Zealand.

I’ve never got straight answers out of Stats NZ in the past about other stats that were relevant to my prior job. I got the impression a lot of fiddling and fudging goes on.
LikeLike
I’ve had different experiences, often quite helpful. My prior is (a) good intentions, (b) under-resourcing of core econ areas, and (c) not a lot of standing back and thinking about the overall results (partly their role, partly that of users, but esp important in times like the present).
LikeLike