Much of this blog focuses on the dismal long-term performance of the New Zealand economy. A common benchmark is to compare our performance against Australia: once (and for a long time) we more or less matched them, these days we languish well behind, and as a result a huge number of New Zealanders have left for better opportunities abroad, notably in Australia – still, fortunately, a place where New Zealanders are relatively easily able to move, if not (any longer) to securely settle.
But how has Australia itself done?
Here is how things were 100 years or so ago, in 1913 – the eve of World War One, the end of the first great age of globalisation. And Australia itself had finally recovered from the devastating crash, financial crisis etc, after 1890. The data are real GDP per capita (in 1990 dollars) from the Maddison database.
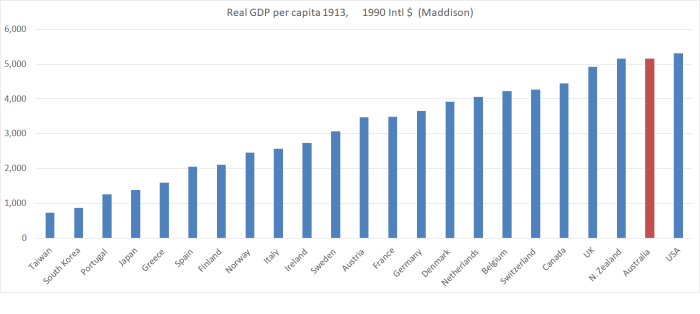
Australia (and New Zealand), far from the industrial heartland of the North Atlantic (recall that the Industrial Revolution had spread out from the UK, and then places like Belgium, Netherlands and northern France), in 1913 had per capita incomes twice those of places like Norway and Italy, 50 per cent more than France and Germany, 25 per cent more than Belgium and the Netherlands. Only the United States matched us (some years a touch higher, some a touch lower).
And here are the top 25 countries from the latest IMF WEO database.
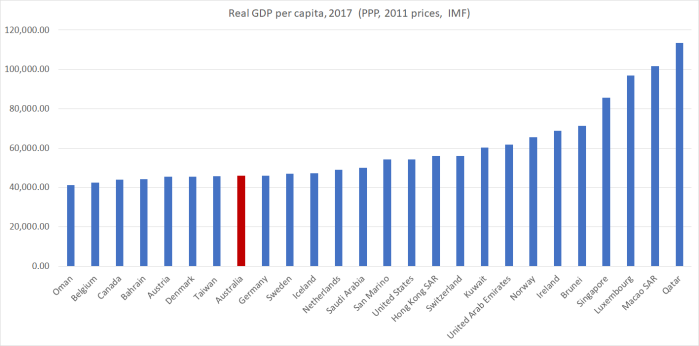
You could toss out some or all Macao (tiny, and really just past of China), San Marino (really tiny), Hong Kong (China), Ireland (numbers not really reflective of Irish incomes because of the corporate tax system) or Luxembourg (much GDP is produced by people living in neighbouring countries but working in Luxembourg) if you want, and Australia would still only just get into the top 15. Australian per capita is now less than that of most of the countries in the first chart – only just edging out Taiwan.
Comparable productivity data going back a long way are scarce. The Conference Board data on real GDP per hour worked start in 1950. There is only data for about 30 countries for 1950 (mostly the advanced countries). But of those countries, only the US and Switzerland were ahead of Australia.
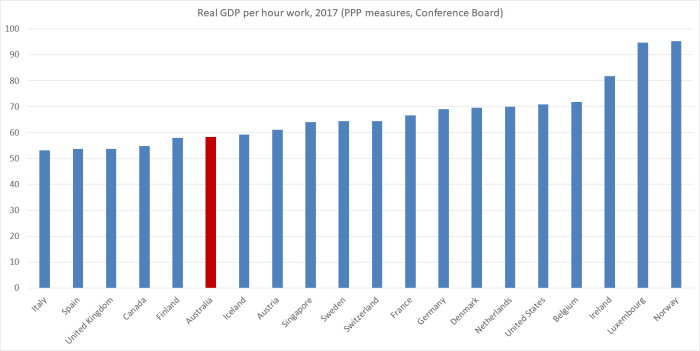
Again, you could safely ignore the Irish number, but doing so doesn’t change the story. Australia has slipped a long way back, and is now nowhere near (say) that bracket of Germany, Denmark, Netherlands, the US, and Belgium. (Taiwan – see previous paragraph – is just behind Italy on this measure).
Here is one way of looking at the performance over decades. Both Australia and Norway abound in mineral resources (in Norway’s case mostly oil and gas, in Australia’s a huge range). Belgium, Netherlands, and Denmark are three high-performing European countries, where the data aren’t complicated by tax systems (Ireland), absorbing a failed communist state (Germany) and the like.
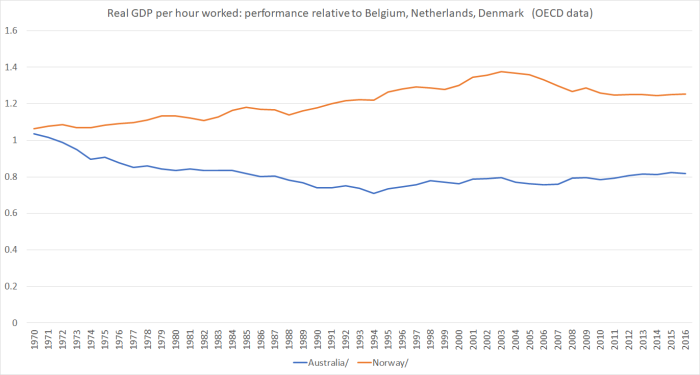
Back in 1970, both Australia and Norway (before the minerals booms really got underway) had slightly higher average levels of productivity than the average for those other three northern European countries. In Norway, the development of the oil and gas resources from the 1970s seems to have contributed to a marked widening in average productivity (and incomes) in Norway’s favour. That margin has narrowed a bit in the last decade – oil itself is past its peak in Norway – but there is a still a large margin (over Europe’s other high productivity economies). And what of Australia? Even now, after a decade with the challenges of the euro crisis, the marked slowing in productivity growth at the global frontiers, and with the huge new mineral resources that have been opened up and brought to market by Australia, Australian average productivity still languishes a long way behind. Even now – after their reforms (80s and 90s) and their new resources – the margin between Australian productivity and that of these northern European countries is only about where it was in the mid-80s. At that time, there was a great deal of angst (similar to NZ) about Australian’s relative decline. In fact, Paul Keating’s “banana republic” line dates from then. There has been no reconvergence since then.
With staggering volumes of newly-economic resources able to be brought to market, it is really a quite remarkably mediocre economic performance. One might quibble about things like Australian labour market laws, but Australia is a functioning market economy that still scores quite highly on economic freedom indices. This is no Venezuela.
And yet, for all its riches – and you see (in the second chart above) the difference natural resources can make – Australia is no better than a middling performer among the (old) OECD countries it once mostly far-outstripped.
I’m not here to scoff – New Zealand has, after all, done so much worse, and the embarrassing exodus stems from that – but to analyse and learn. I’ll offer some thoughts on reasons why in another post, probably next week.

If we go back 100 years with your productivity charts then we could just as easily argue that Australia’s and NZ white only policy has resulted in great leaps of productivity and since then with the dilution of our White supremacy policies we are now worse off??
LikeLike
I response I would note only that Australia’s relative decline happened almost entirely in the period the White Australia policy was in place and (after removal) before removal had much practical effect (numerically). I doubt there is any causal connection in either period, in either direction,
LikeLike
Quibble about our labour market laws?? . I would think the data on employment/.Unemployment. Industrial Relations and wages means there is little to quibble about as our RBA has shown
LikeLike
NAIRU estimates in Australia are typically higher than those for NZ, and we didn’t have/need a Royal Commission on governance/corruption in the union movement.
But all i was really doing was giving a nod to those on the right in NZ who believe the state of regulation in Aus is less good than in NZ, and suggesting that even if true in some areas (in pre Uber days when i used to travel to Aus a bit, i used to contrast taxi industries, not to Sydney’s favour), it isn’t likely to be the explanation for the long-term underperformance.
LikeLike
“we didn’t have/need a Royal Commission on governance/corruption in the union movement”
That is pretty selective. Check out the corruption that has occurred in NSW government circles and shonky political donations and ICAC hearings and the moves to nobble ICAC’s powers, and the growing demands for a Federal ICAC and the resistance on both sides of the aisle to such a move and now the furore over a $440 million government grant to the Great Barrier Reef Foundation which in turn is one of the largest political donors to the Liberal Party. Members of the committee is an honour roll of the big end of town
LikeLike
I think there is little real doubt that corruption, while not unknown here, is still less severe in NZ than in Aus, but the comment I was responding to was about my specific passing reference to the labour market.
Overall, my assessment would be that Aus regulation is about the same quality as NZ’s (and OECD Going for Growth indicators are consistent with that). Same goes for macro policy – perhaps we do a bit better on fiscal and they a bit better on mon pol.
LikeLike
NZ is riddled with corruption. We just call it legal corruption. The term is called “Contract variations”. In most countries it is unacceptable for a professional to quote on a job where variations are more than 15% of a contract. In NZ it is completely acceptable for Contract variations that can run to 100% of the contract price. Also Maori Iwi just have to litter any development site with a few seashells and to be able write up a contract for site monitoring. I know of one development that had to sign 20 contracts with 20 separate Maori Iwi groups from around the country. This is corruption.
LikeLike
I think it’s a very similar story to NZ: exchange rate too high, massive amounts of red tape around land use, tax system that favours property speculation, debased tertiary education system. Things that are worse than NZ include failed politically motivated infrastructure products (NBN,desal plants, tollways), the baleful influence of a cabal of cashed-up mining grifters, and any overly developed financial system.
For a wonderful screed against Australia, try this essay from tech entrepreneur Matt Barrie: https://medium.com/@matt_11659/matt-barrie-australias-economy-is-a-house-of-cards-6877adb3fb2f. Ignore the introduction and conclusions, it’s the little links and anecdotes of corruption, incompetence and 26 year old train driving property millionaires that make it amusing.
LikeLike
It is actually wrong to say that the tax system favours property speculation over any other investment. In fact property investment is unfairly treated when compared with other investments.
The main difference is not about tax. It is about banks being more prepared to lend against property compared to any other investment category because they perceice property as the least risk to generate lending income.
To hear Jacinda Ardern, Grant Robertson and NZ economists go on and on about tax 101 and getting it wrong is just so embarrassing for a country who profess to have smart people.
LikeLike
Australia also has quite high taxes on labour: a 45% top income tax rate, 2% medicare levy, 5-7% payroll tax, combined with quite high minimum wages. The investor community is pretty down on any business plan that involves hiring a lot of people in Australia. As a result, entrepreneurs are focused on hitting on the big scalable software/IP play that will let them scale globally without actually doing much domestic investment.
LikeLike
[…] A post from a couple of months back that made similar points, but with some different data and a longer […]
LikeLike