No posts here for a while as I’ve been bogged down in trying to make sense of some events – little more than one week in history – from 30 years ago, where the uncertainty as to what actually happened (a precondition for making sense of what the events mean) is greatly magnified by really poor documentation and recordkeeping by….the Reserve Bank.
I was planning to return with something a bit more longer-term (perhaps tomorrow) but wasn’t yesterday’s inflation number interesting? It seems to have taken almost everyone – notably the people who do detailed components forecasts, including the Reserve Bank – by surprise to some extent.
Almost all the media focus has been on the headline number – 2.2 per cent increase for the quarter, 4.9 per cent for the year – because (I guess) it makes good headlines. (Excluding the two quarters when the GST rate was increased) it was the largest quarterly increase since June 1987 – an unexpected rise of 3.3 per cent, at a time when the Bank thought inflation was falling away, and when the Bank’s chief economist, Grant Spencer, was interviewed about the number that night he declared himself “flabbergasted”. That one number helped prompt an overhaul of, and marked improvement in, the Bank’s short-term inflation forecasting (not previously much of a priority).
But in annual terms, it is only 13 years since we had an inflation rate about this high. It was 5.1 per cent in the year to September 2008, a rate that may be beaten when the next CPI number is released in January, since last December’s (relatively modest) 0.5 per cent quarterly increase will drop out of the annual rate. Note that in the September 2008 quarter, the Reserve Bank had already (and appropriately) started cutting the OCR.
But my main interest is in core inflation. There are all sorts of different measures, from simple ones (useful for cross-country analysis at least) like the CPI ex food and energy, through varying degrees of complexity (and occasionally even special pleading by the people constructing them). For New Zealand though, my favourite measure – and the one the Bank openly favoured for some years (it is less clear how the current Governor and MPC see things) – is the sectoral factor model measure of core inflation. It was developed a decade or so ago by one of the Bank’s researchers, and initially got little attention even inside the Bank (mostly because the Governor and his advisers on the then Official Cash Rate Advisory Group were not really advised of it). I’ve been something of a lay evangelist for this measure ever since I realised it existed, and had some small role in getting this explanation of the measure published. The gist of what is going on is this
The sectoral factor model estimates a measure of core inflation based on co-movements – the extent to which individual price series move together. It takes a sectoral approach , estimating core inflation based on two sets of prices: prices of
tradable items, which are those either imported or exposed to international competition, and prices of non-tradable items, which are those produced domestically and not facing competition from imports.
Using very disaggregated data, it is an attempt to get at the systematic elements in the annual inflation numbers, recognising that tradables and non-tradables can be influenced by different systematic influences (notably the exchange rate in the case of tradables).
But the best argument for the series has been its usefulness – in some sense it “works”, telling useful stories, not subject to much revision, about what is going on in ways that square with what is going on with other things (notably capacity pressures, but also expectations) that are thought likely to be important influences on the trends in inflation, abstracting from the noise.
And the “noise” can be considerable. Here is annual headline inflation and the annual sectoral factor measure for the period since 1993 (as far back as the sectoral factor measure has been taken).

Big deviations have not been uncommon (although less so in the last decade), and spikes in headline inflation have never (yet) foreshadowed a commensurate increase in core inflation (as,say, stickier prices caught up with more flexible prices). If you did want a prediction of where core would be 12-24 months from now, historically today’s core inflation has been a much less bad (far from perfect of course) predictor than today’s headline inflation.
And so from here on I’m focusing solely on the core inflation measure. There are a few observations worth drawing from simply this chart.
First, the range in which core inflation has moved over 28 years has been 1.1 per cent to 3.5 per cent. And although the inflation target was centred on 1 per cent until the end of 1996 and 1.5 per cent until September 2002, the low in the series wasn’t then, but in late 2014 (a time when, curiously, the then-Governor was raising the OCR).
Second, over the 28 years not much time has been spent very close to the midpoint of the respective target range. In fact, the median gap between the core inflation estimate and the target midpoint has had an absolute value of 0.7 per cent over the history of the series. As it happens, yesterday’s core inflation estimate was 2.7 per cent, 0.7 percentage points above the target midpoint.
Third, for the first 15 years of the series core inflation was almost always at or above the target midpoint, and for the decade until last year it had been consistently below.
Now it is worth pausing here to note that prior to about 2012 the Reserve Bank (a) did not have the sectoral factor measure readily available to policy advisers, and (b) was not explicitly required to focus on the target midpoint. However, neither point really diminishes the usefulness of such comparisons because (a) sectoral core inflation was simply trying to put in a single measure something the Bank had constantly thought and written about since inflation targeting began, and (b) if Alan Bollard was personally disinclined to give much weight to the target midpoint, Don Brash certainly was (and revealed evidence – see those sectoral factor numbers from 2014 – suggests that Graeme Wheeler was more focused on where he thought in principle the OCR should be heading than on the target midpoint.
There are a couple more relevant observations. First, core inflation now (2.7 per cent) is about the same as it was (2.6 per cent) in the last year or so of Don Brash’s term (2001/02), and back then the target midpoint was 1.5 per cent, not the 2 per cent the Bank is now charged with. And, second, core inflation is still well below the 3.4/3.5 per cent seen in late 2006 and throughout 2007.
But perhaps the change in the inflation rate has been unusually sharp.
I put this chart on Twitter yesterday before the Bank published the sectoral core numbers.
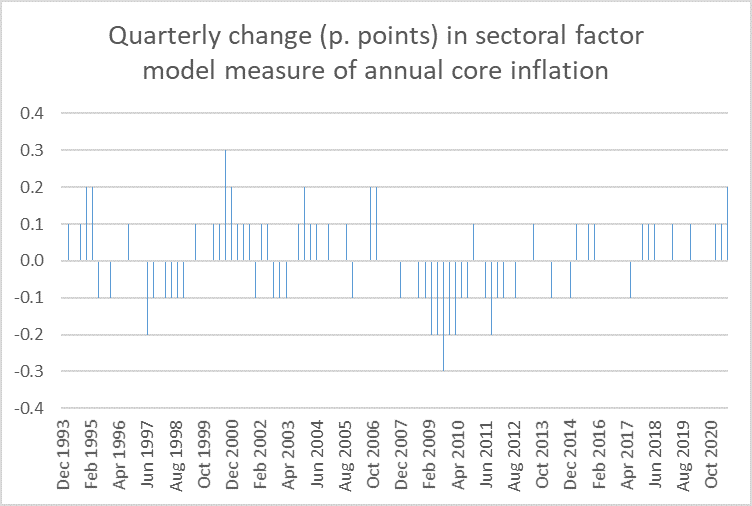
On the series now published, the sectoral core inflation rate rose by 0.3 percentage points in the latest quarter (so large but not exceptional). However, this sort of model is prone to end-point revision issues – new data leads the model to, in effect, res-estimate which recent prices moves were systematic and which were not. The previous estimate for sectoral core inflation for the year to March 2021 was 2.2 per cent. But that has now been revised up to 2.4 per cent. I don’t have (but the Bank should really publish) a database of historical real-time estimates, but a change from a previous estimate of 2.2 per cent in the year to March to one of 2.7 per cent for the year to June is likely to have been large by any standards.
What about changes from year to year? Again, I don’t have a real-time database, but here is how the annual rate of core inflation has changed from that a year earlier.

What we’ve seen so far – on current estimates which are subject to revision – is not exceptional. The rise in the rate of core inflation over the last year has been less than we saw around the turn of the century, and the magnitude of change is less than than the fall seen over 2009. But it isn’t a small change either.
When (last quarter, per the Bank’s published estimates) annual core inflation was estimated at 2.2 per cent, I was prepared to say (and did) that that rate of core inflation was unambiguously a good thing, given the target the government had set. After a decade of core inflation below the target midpoint, it was good to finally see an outcome on the other side, which would help to underpin medium-term expectations near the goal set for the Bank. That was doubly so because 2.2 per cent inflation went hand in hand with an unemployment rate right back down to pre-Covid levels (4 per cent) and probably pretty close to the NAIRU (itself a rate the Bank can’t meaningfully do anything about). I’d not have been uncomfortable with a core inflation rate going a bit higher still – not as a desired outcome, but not something to be too bothered about for a short period (as the MPC raised the OCR, which works with a lag). 2.7 per cent is somewhat less comfortable.
But quite a lot might have depended on where the unemployment rate (or other measures of excess capacity) was going. There have been two previous troughs in the unemployment rate. The first was in the mid 1990s, when the NAIRU appeared to be around 6.2-6.5 per cent. Core inflation reached its cyclical peak then at much the same time unemployment dropped into that range, and showed no signs of going higher. The second was just prior to the 2008/09 recession, when the unemployment rate was in the 3.4-3.9 per cent range. Core inflation had risen as the unemployment rate fell, but core inflation was not going higher in 2007, nor was it forecast to into 2008. In both cases, the Reserve Bank had been raising interest rates (or allowing them to rise) and things stayed more or less contained (before core inflation fell away in the two following recessions).
One of the great unknowns now is how things might have unfolded here without the Delta outbreak and the ongoing restrictions and lockdowns. We will get the HLFS numbers for the September quarter early next month, and the unemployment rate there is unlikely to have been much affected yet by the lockdowns etc. Most likely, the unemployment rate will be lower than 4 per cent, but how much?
But the outbreaks and restrictions did happen, and so even if the unemployment rate for the September quarter was in fact 3.6 or 3.7 per cent, it probably isn’t safe to assume anything of the sort as a December quarter starting point. Yes, most likely economic activity will eventually rebound when controls are finally lifted but (a) there isn’t the fresh policy impetus there was last year, and (b) for those who believe in house prices stories, the worst of this particular house price boom has most likely passed. It isn’t implausible that the unemployment rate for December and March could be back at or above 4 per cent.
What does it all mean for policy? No doubt the MPC is feeling vindicated in having raised the OCR at the last review, even amid the-then extreme Covid uncertainty, and even though the MPC is likely to have been very much taken by surprise by yesterday’s core inflation number. Absent Covid there was a strong case for a robust tightening of monetary conditions – reversing the LSAP bond purchases, ending the funding for lending programme, and getting on with OCR increases – and that case would have been considerably strengthened by yesterday’s outcome.
Perhaps fortunately, the MPC does not need to make another OCR decision until late next month, and that review will come with a full MPS which will allow them space to provide some careful and considered analysis of their own. We might hope that by late next month, something close to normality has returned or is on the brink of returning. There are no guarantees, but if that is the situation, the MPC should be starting to sell off the bonds, and ending the FfL programme (most likely they will do neither), and should probably still be considering seriously a 50 basis points OCR increase (albeit with one eye on the emerging China slowdown). We were told they had considered the option in August. There isn’t a need for panic or headless-chookery about the Bank having lost the monetary policy plot. But a fairly robust response does seem likely to be warranted next month, especially as the MPC has (most unwisely) scheduled decision dates in a way that gives them a long summer holiday with no OCR review at all in December and January.
Finally, I have been highlighting for a long time how the market-based indications of inflation expectations (from the indexed bond market) had consistently undershot the target midpoint for some years. Yesterday’s data seems to have prompted a move to (or above, depending on maturity) 2 per cent for the first time in a long time. That isn’t concerning – rather the contrary – but it will be worth keeping an eye on how those spreads – the breakevens – develop over the period ahead.

Nice comment Michael. I produce a CPI excluding the main items influenced by covid (health insurance, petrol, international airfares, domestic accommodation, restaurant meals, used cars) and it’s tracking the sector factor model very closely suggesting a sharp up move in inflation but still well shy of headline. I do a detailed forecast, there were several eye popping moves such as a 65.7% quarterly move in international airfares ! Hard to forecast that sort of volatility.
I don’t see them selling bonds as the domestic bond market is reeling right now and that would just inflame things, and wouldn’t really impact monetary conditions in the key short end of the curve. They could end FLP, which makes no sense today, but I think they’re continuing it for legal and reputations reasons but the uptake isn’t that strong and I’m guessing there’s some arm twisting going on to discourage its use. So that leaves a 50bp hike on 24 November and that seems most likely.
Interesting times to say the least.
LikeLike
Thanks Peter. Hard to see that an announced programme of $1bn a month of bond sales, combined with letting maturities run off, could be that disruptive (and I agree the mon conditions impact would be slight) : I keep putting in the call mostly to draw attention to the Bank’s claims that the LSAP is a highly potent instrument.
LikeLike
My Australian mates tell me that there is a $100million luxury boat for sale for $50million. The alternative suggested was a rekitted Boeing 737 going cheap also. Either on international waters or in international skies the intent is to become an international citizen.
Inflation in consumer goods but mainly due to supply chain disruptions and massive devaluation in others.
LikeLike
Reblogged this on Utopia, you are standing in it!.
LikeLike
How high would inflation have to go for Mr Orr to be fired?
LikeLike
Hard to see such a scenario, altho he is up for reappointment in early 2023. Core inflation would have to go beyond 2007/08 levels, and there would have to be a widespread market loss of confidence that the Governor was serious about pulling it back. For all his flaky wokeness, he is fairly conventional in his macro,
LikeLike
If it was obvious to lay people like me that inflation rising over the target band was inevitable,
What can Mr Orr’s excuse be for missing his target so badly, and doing nothing about it until now? This is his job. He is paid a lot. Not good enough.
The woke nonsense is irritating, but in the final scheme of things, isn’t the worst of his crimes, by a long shot.
Alas, his QE is best viewed as economic vandalism on a grand scale.
Living in UK, I saw huge rounds of QE. Suffice to say, in NZ, the subsequent asset price inflation hasn’t surprised me.
It has made me millions (as a fulltime property investor), but I still view it as idiotic policy making. Absurd property valuations lock in a huge underclass with no hope, reliant on selling their labour at meagre rates to keep their heads above water. I can accept some QE may have been justified with Covid – the scale he completed was, as I said above, simply vandalism.
I’m rather tired of NZ institutions failing us.
Treasury (QALY anyone?), the Courts (illegal lockdowns are a laugh apparently), the police (transformed from bullies to woke, neither of which work for me), the media (corrupt) and the RB have all been pretty much useless to date.
Woe is me…
LikeLike
I’ll push back a little. The Bank is supposed to focus on something like core inflation, which at present is still within the band.
More generally, there was never a serious move to remove Wheeler (when core inflation fell to 1.1%, when he tightened on no good basis) or Bollard when core got to 3.5%..
On QE, my view remains that it did little or nothing (good or ill) altho the MTM losses the taxpayer has run up are not small.
Entirely agree tho re the general quality of NZ public institutions. THere is v little accountability for inadequate performance, and thus the NZ relative decline – on economic and other counts – continues.
LikeLike
Cakeface, i don’t think you can blame the pandemic driven supply chain disruption on Adrian Orr. He is certainly guilty of being stupid and pandering to calls for higher interest rates but there is nothing the RBNZ can do to stop rising prices. Raising interest rates can only jump kick inflation up even higher. The First 0.25% interest rate raising already have made inflation worse.
Businesses operate on cost plus margin. Interest rates are a cost and therefore higher interest rates jump start higher prices.
LikeLike
Unfortunately, I’ll have to disagree with a couple of your views.
I’m not really bothered whether Mr Orr keeps his job, or not. My point is that it seems to me that the RB have failed recently.
I also believe headline inflation is important. The common man finds the price of food and fuel to be pretty crucial to their wellbeing, so it shouldn’t be disregarded by policy-makers. It helps set future inflation expectations amongst the public, as well as wage demands. And headline inflation could hit somewhere high five or even near the six percent mark? Not good. You say:
“On QE, my view remains that it did little or nothing (good or ill)”
I suspect QE had a massive impact on both asset prices (house price inflation) and the economy in general (wealth effect). Do you not attribute some of the massive house price rise of late to this programme?
Without it, the Covid recession would’ve been far, far worse, I believe. However, the long term impact of the house price boom exacerbated substantially by QE will be very bad, in my view. There has been a huge misallocation of resources. The redistributive effect of this enormous relative price change creates truly staggering inequality.
We do, however, agree about New Zealand’s failing institutions. I think there has been recent deterioration.
My impression now is that when I went to school and university in NZ (finishing circa 1992), the schooling was much better in general then, than it is now. It’s not only schooling where I have rose tinted glasses. My feeling is that all the NZ institutions were better back in this time period, than they are now. Perhaps a behavioural economist would attribute this to various biases that I am suffering from.
If the institutions have worsened – why? I may mull this over…
LikeLike
Re Orr, in a sense what should matter isn’t what either you or I think, but what the target the govt set for him says (and it is clearly focused much more on core than headline concepts, and has been since the dawn of inflation targeting).
Re institutions, there is always the temptation of middle age or (in my case) late middle age to view the past with rose-coloured glasses. Watching my kids go through school, I think there are one or two areas where things are clearly better now (creative writing is one example), others where it is just radically different, and some where it seems materially worse.
As for the govt institutions, it is hard to think of any that are better now than then, but I sometimes wonder if that period was not a temporary high-water mark, and many institutions in earlier decades (and here I include the RB) were not particularly strong or deep at all.
LikeLike
With most of our consumer goods imported, rising interest rates will cause the NZD to rise making imported goods cheaper but at the cost of decimating local producers. Time to allow local producers to increase prices and produce local instead of raising interest rates.
LikeLike
Hi
Mark is retiring from Westpac on 5 Nov. Wondering if we could please update his email for these subscription emails to markweenink@hotmail.com
Could you please confirm.
Kind regards
Tara
Tara Barlow
Executive Assistant to Stephen OâBrien
Acting General Manager Regulatory Affairs, Corporate Legal Services and General Counsel NZ
Level 4SS, 16 Takutai Square, Auckland 1010, New Zealand.
M +64 21 614 465 | E tara.barlow@westpac.co.nz
[cid:image001.png@01D7C68C.5AF0CA90]
LikeLike
Tara
There is a box on the right of the front page of the blog (www.croakingcassandra.com) and if you fill in Mark’s email address there it will ensure he can continue to receive my posts.
LikeLike