Still on health matters, I’ve been intrigued for a while at what was happening to vaccination rates stratified by age. For all that politicians and the media burble on, emote even, about differences by ethnicity, the data on Covid itself seem crystal clear: by far the biggest demographic risk factor for getting seriously ill or dying of Covid (and thus of resulting in pressure on the health system) is age. The Hendy et al modelling used this data (from this 2020 paper).
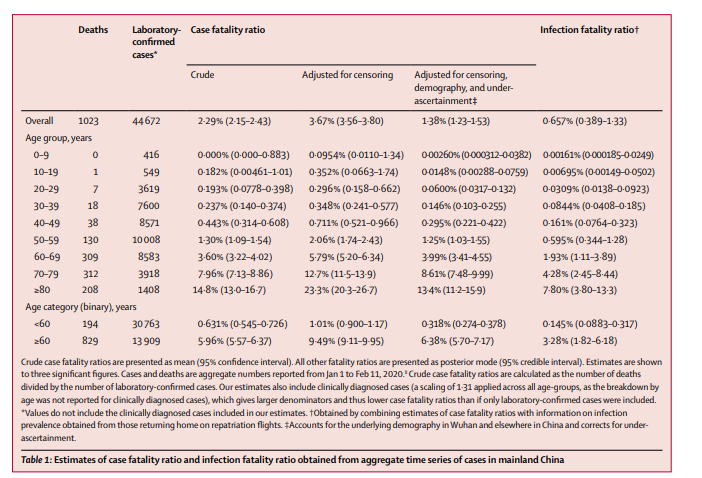
I’ve seen people suggest these absolute numbers may be out of date, and epidemiologists can argue about that, but my point simply is that no one seems to dispute the significance of age. It isn’t just a linearly increasing risk: the risks for (say) the over-80s are far far higher than those for even people in their 50s.
The government of course recognised this initially in allowing old people to get vaccinated before (progressively) most of the rest of us. If you are my age, it is only about six weeks since one could get a first dose, and so many (like me) will be getting second doses only in the next few weeks. But the very elderly have had a lot of time to have had both doses of the vaccine. And, so you would think, people in that age range would generally have a strong personal incentive to get vaccinated – and their children to encourage them to do so. Public spirit might be necessary to help encourage the young, but for the very old death from Covid is a non-trivial risk (and thus the strict rules one hears rest homes have in place). The rest of us have a strong interest in these old people getting vaccinated because pressure on the health system is one of the key perceived constraints on opening up.
And so I’ve been a bit surprised that the vaccination rates among the elderly have not been higher. The Ministry has come and gone a bit on how much information it makes available, but for now it seems to have settled on promoting this chart.
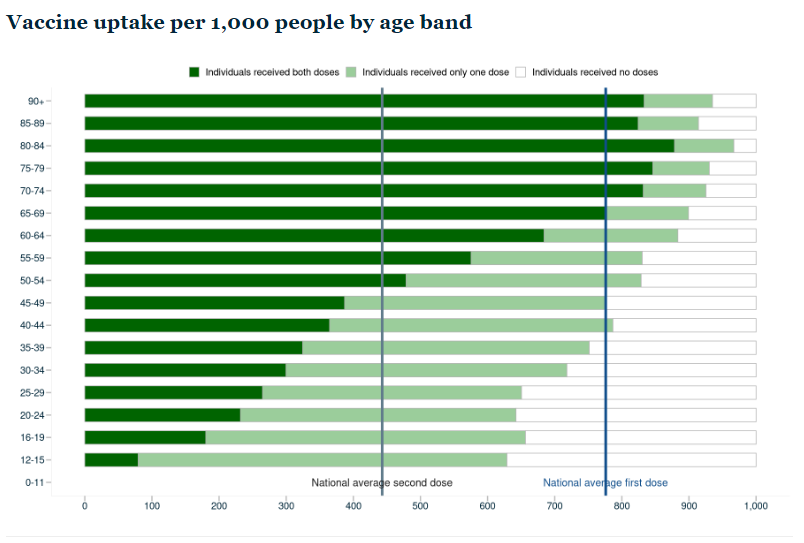
None of the elderly age bands have yet got to a 90 per cent second dose vaccination rate, and only one (the 80-84 group) has got to 95 per cent for even a first dose. And these people have had months.
But the real situation seems to be even less good than the Ministry of Health portrays it. The denominator they use in all their charts and tables is not the population in that age group as estimated by our official statistics agency, SNZ, but something called the “Health Service User population” (HSU), which is defined thus
The Health Service User population estimate counts the number of people who received health services in a given year. Someone is counted in the population if their associated National Health Index (NHI) number received public health services; or was enrolled with a primary health organisation (PHO).
I suppose they must have their reasons, but using this HSU measure seems to assume away part of the problem – people unknown to the health system seem, all else equal, less likely to be turning up (to the health system) for a vaccine. Of course, it is a hard count (administrative data) and the SNZ population numbers are only (informed) estimates. But some people just don’t go to the doctor very often (I know in my 20s I prided myself on not having been for a decade).
Anyway, here is the difference it makes
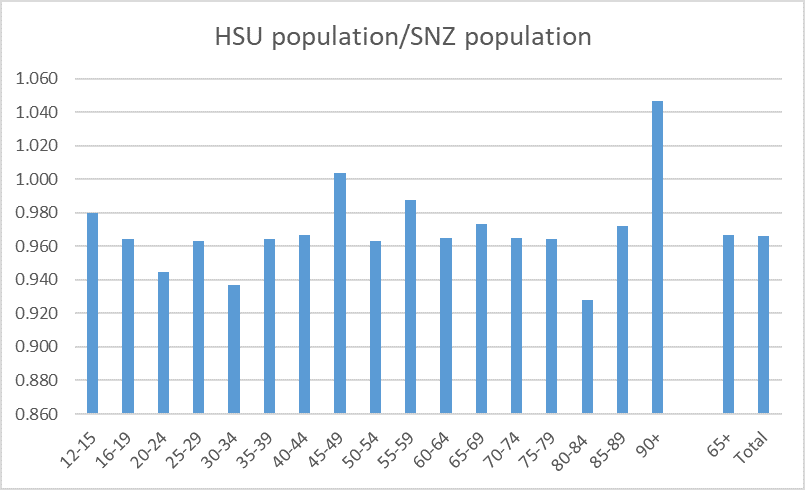
There are some anomalies. I’m not sure how there can be so many more 90+ health service users than SNZ think there are in the country (and they keep track of deaths, and there can’t be that much migration among the over 90s), and the 80-84 band is a bit of a surprise too, but the key point is that both for older ages (65+) and the the 12+ population as a whole, the HSU appears to undercount the population by 3.5 per cent. All else equal then, vaccination rates are a bit overstated.
Here is how the two measures look for first doses for the older age groups

Using the SNZ population numbers, not quite 90 per cent of the elderly have yet had a first dose. And yet we hear almost nothing about this from our government, our health bureaucrats (who seem to champion the messaging of politicians) or even – so far as I could see – in the perspectives provided by the opposition political parties.
Here is the same chart for second doses.
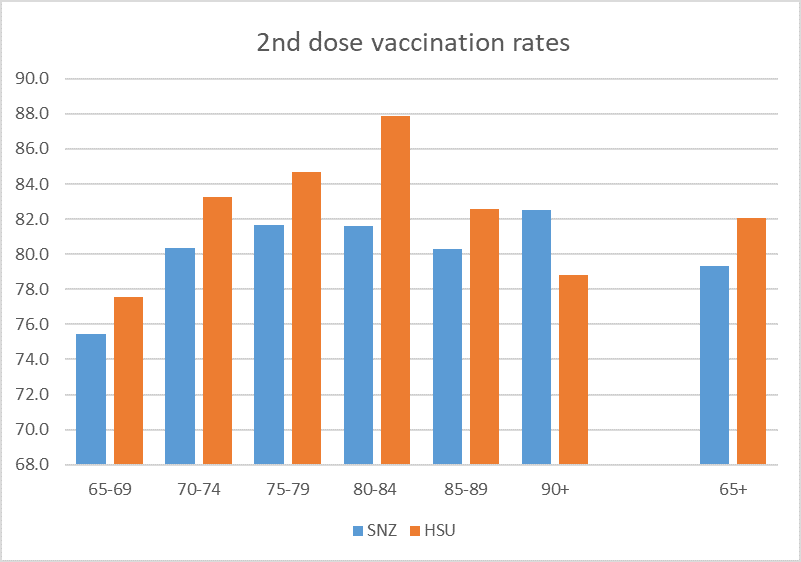
Not much more than 80 per cent of even the 75+ population have had two doses, many months into the programme. And this is the demographic most exposed to serious illness death, and the demographic that thus poses the greatest threat to the health system if/when Covid gets more established here.
Using the SNZ population estimates here are the vaccination rates for each age-band.

Can better be managed? Well, it would appear so from the experiences of other countries. At an aggregate level, for example, Portugal has about 85 per cent of the population with two doses (about 95 per cent of the 12+ population). I’ve been keeping an eye for some time on NHS data for England (and remember that a lot of people in England have already had the virus itself), and they appear to be showing close on 100 per cent of those 70-74 having had two doses (albeit rates tail off somewhat above that age band).
But when it comes to Covid, Australia still appears to be the country most similar to us, including in that they were slow to get their vaccination programme going. This is the latest set of charts

Of course, Australian states and territories have a quite diverse range of experiences with Covid (ACT, NSW, and Victoria with ongoing outbreaks) but their record in getting the elderly vaccinated seems to be consistently (NT aside perhaps) better than New Zealand’s, with particularly impressive numbers in ACT (where all but one age-band over 40 have 95 per cent first dose rates, and most second doses done).
Perhaps there are denominator issues in those other countries too, but even if so the bottom line remains one in which the New Zealand elderly vaccination rates are just not that good, given the risks (to their own health, and – indirectly – to the wider freedoms and opportunity of the community more generally).
And there is no sign our politicians are taking this very seriously.
On a final note re age, the Hendy et al modelling released last week (and touted by the government) assumes the same vaccination rate for all eligible age bands. That seems somewhat unrealistic, even if at some point in the middle distance all age bands were to eventually converge to very similar vaccination rates. It seems unfortunate that model estimates using a range of different assumptions about the age pattern of vaccination rates have not been published. Superficially, it would seem that very high vaccination rates among the very old might be more valuable – in reducing death and serious illness, and facilitating opening up – than very high rates among some of the younger cohorts. In a brief exchange on Twitter last week with one of Hendy’s co-authors, he indicated that (a) they had done some such modelling, and (b) that sometimes one could get counter-intuitive results. Which is fine, but it would be helpful for the public to be able to see this sort of material, especially when the government itself if touting the modelling of these particular researchers. In its absence, it looks as though the government should be putting a lot more emphasis on getting elderly vaccination rates well up than is evident at present.
