My quick post on Saturday, in response to someone’s comment, was designed simply to illustrate what should have been quite an obvious point: looking across countries in any particular year, countries with large populations don’t tend to be richer (per capita GDP) than countries with small populations. Just among the very big countries, the United States is towards the top of the GDP per capita rankings (beaten by a bunch of small countries), and China, India, Indonesia, Pakistan, and Brazil are not. Since both the physical sizes of countries, and their populations, are the outcomes of all sorts of historical factors, it wasn’t an observation about immigration policy or (wince) “population policy”. And, of course, GDP per capita isn’t everything: moderately well-off large countries are typically more powerful (defence or offence) than small rich ones.
But, continuing to play with the same data download from the IMF WEO database (190 or so countries and territories) for the period since 1995, is there any obvious relationship betweeen population growth rates, and growth in real per capita GDP?
Here is the chart
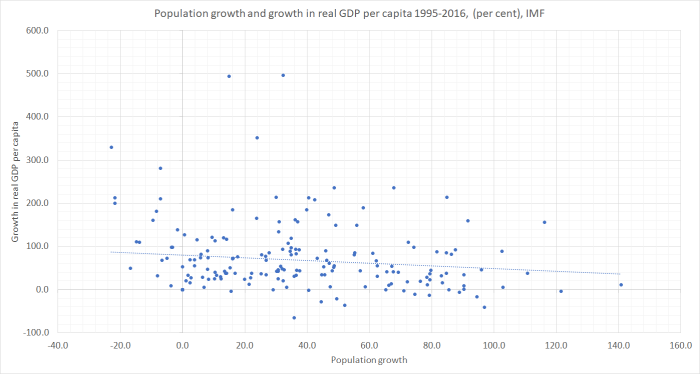
Actually, I’ve left out three extreme outliers – all oil producers. Equatorial Guinea had growth in real GDP per capita of about 2500 per cent over the period, and UAE and Qatar had population growth of 300-400 per cent (in one case, with falling real GDP per capita, and in the other with a moderate increase).
There is basically no relationship between the two series – again, each dot is a country. The simple linear regression line is downward-sloping but that probably wouldn’t be a statistically significant relationship. Bear in mind though that simply charting population growth and per capita GDP growth for the same period could have shown an upward-sloping relationship even if there was no causal link from faster population growth to faster per capita economic growth: countries with rapid growth in real GDP per capita might be expected to attract more people (immigrants flow towards opportunity) and perhaps even induce higher birth rates. But there is no sign of even that sort of relationship, across all countries, and over this period of 20 years or so (this sort of reverse causality is a big problem looking at annual data, but much less so looking at long periods).
The full sample of countries includes a huge range of types of countries – from war-torn poverty stricken basket cases (Syria, Somalia, Afghanistan) to tiny remote islands (Tuvalu), as well as places with strong institutions, good connections, and an established record of economic performance. How do this simple bivariate relationships look if we focus just on these latter countries?
In various posts over the years, I’ve used a sample of about 40 fairly advanced countries, encompassing the members of the OECD and the EU, as well as Taiwan and Singapore. There is still a lot of difference among these countries: places that were non-market communist economies only 30 years ago, the odd place (eg Mexico) that is more like an honorary member of the group of advanced countries, as well as the places with very high productivity (France, Germany, United States, Ireland, Norway). And there are countries as small as Malta or Luxembourg, and as large as the United States. This group leaves out countries that appear to be rich only because of oil.
Here is the simplest plot: of the levels of population and GDP per capita in 2016.
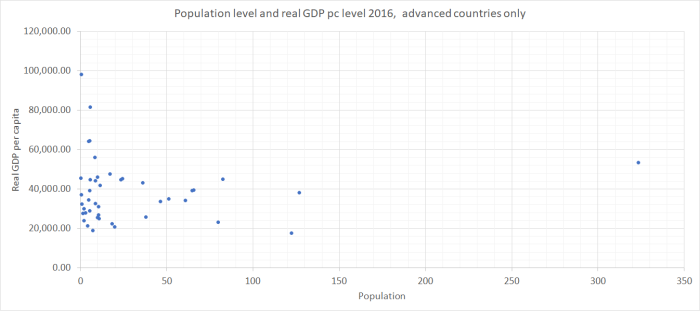
This time, the simple regression line is very slightly upward sloping. Remove the US and it changes sign. Remove all the countries with more than 50 million population and it is still downward sloping.
But what about growth rates? For quite a few of these countries, GDP per capita is pretty shaky before about 1995 (communist-era and immediate post-communist transition). That’s why I’ve done all these charts for just the last 20 years or so. But that also happens to be a period when there has been a lot more population movement between advanced countries (especially in Europe).
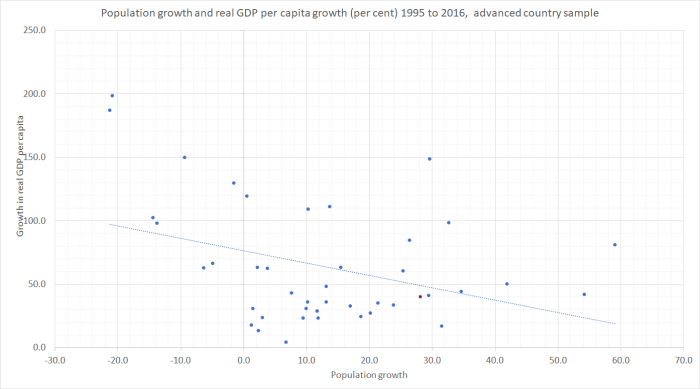
Recall that even if there was no causal relationship running from population growth to growth in real GDP per capita, there was a possibility that we might have seen an upward-sloping relationship simply from any link between successful economies drawing in more people (as happened in Ireland most obviously – net immigration rising well after the boom in per capita GDP and productivity). But, in fact, across these 40 or so advanced countries, any relationship is downward sloping. Across these countries in this period, faster population growth has been associated with slower real per capita GDP growth. (For the eagle-eyed among you, New Zealand is the red dot.)
And in this final chart, I’ve broken the period in two. I’ve charted, for each country, population growth in the first 10 years of the period (1995 to 2005) against real GDP per capita in the second half of the period (2005 to 2016). In other words, none of the population growth variable is directly caused by the growth in the real per capita GDP variable.
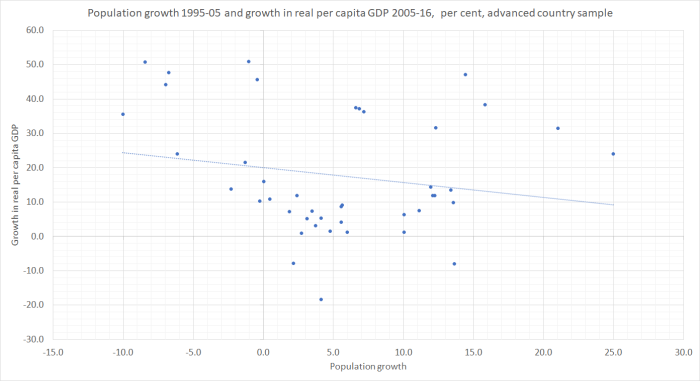
The downward-sloping relationships is weaker this time – less of the variance in GDP growth is explained simply by prior population growth – but again it is downward-sloping, and not the upward-sloping line many of the immigration-policy boosters in New Zealand would like us to believe. I forgot to mark New Zealand on this chart – we are one of the dots a bit below the line with 12 per cent population growth – but there is nothing unusual about New Zealand’s place on either chart.
If one wants to get more sophisticated, one could look at growth in labour productivity or total factor productivity, rather than just real GDP per capita. Especially for TFP, one becomes dependent on the model used in estimating TFP and the available sample of countries drops away, As for labour productivity, in earlier posts I’ve illustrated the lack of a positive relationship between population growth and productivity growth (and recall that New Zealand has managed better real per capita GDP growth than productivity growth, by working longer hours), and that – for example – if anything business investment as a share of GDP has been negatively correlated with population growth across advanced countries. That is the opposite of what might been expected if population growth – and immigration – was typically boosting the productivity and per capita income prospects of recipient countries.
It is past time we started backing our own people, not looking to replace or augment them with a mythical group from across the water. Part of that involves the government getting serious about facing up to the disappointing economic outcomes of our long-running Think Big economic and social experiment with large scale immigration. As part of that, in turn, a serious review of immigration policy by the Productivity Commission – there have been two in Australia in the last 15 years – would be a good place to start.
