The results of the Reserve Bank’s quarterly survey of expectations were released yesterday (in a curious change of timing, the Bank now collects the data before the Monetary Policy Statement, but doesn’t release it until a few days afterwards).
There wasn’t a great deal of interest in the headline numbers, except perhaps for a pretty large increase in the extent to which respondents (all 56 of them) think that monetary conditions are very easy at present: a net 64.3 per cent think conditions are more relaxed than neutral (45.7 per cent three months ago), more than at any point in the 30+ years the question has been asked. There was also a pretty big change, in the looser direction, in expectations about future monetary conditions. I’m not quite sure what led to that reassessment. One obvious candidate might have been the surprise in the most recent CPI but, as it happens, there isn’t much change in the headline inflation expectation numbers. Perhaps the answer doesn’t really matter that much, but it would still be interesting to know why a bunch of able people have change their assessment quite that much this quarter.
Once upon a time the Reserve Bank’s two-year ahead measure of average inflation expectations lined up pretty well with trends in core inflation. In this chart, I’ve shown it plotted against the sectoral factor model measure of core inflation, the Reserve Bank’s preferred indicator.

Notice that I used the term “lined up”. In this chart I’ve simply shown expectations as surveyed in a particular quarter (but about outcomes two years ahead) and core inflation outcomes in that particular quarter. If one does the chart with the expectations numbers shifted two years ahead (to tie up with the date the survey actually asks about) the relationship is a bit weaker.
The Reserve Bank used to use this two year ahead measure as a proxy for how wage and price setters – and, at least notionally, borrowers and lenders – took account of inflation: these numbers directly influenced the base inflation forecasts. They’ve since moved away from that. But my interest today isn’t so much the Bank’s own forecasts, but the answers to the expectations questions themselves. Why, for example, have so many otherwise able people gone on predicting that (core) inflation would be around 2 per cent when it has actually kept on coming in at 1.3 to 1.5 per cent? Perhaps part of the story is “laziness” – if the Reserve Bank, with all its analytical resources, keeps telling the public core inflation will be getting back to 2 per cent perhaps respondents (mostly busy people) just take them at their word? If so, perhaps there is a troubling possibility that we might be a little better off if the Bank didn’t publish (consistently wrong) projections. Perhaps the answer is more ‘ideological’ – the deep conviction, shared by so many, that current conditions are ‘abnormal’, must soon “normalise”, and therefore (almost by construction) inflation must soon get back to target? Whatever the answer, at present the results of the survey seem to tell us more about the respondents than about the actual outlook for inflation.
The focus of analysis is on the mean (average) expectation, because that is the data the Reserve Bank makes readily available. But there is a richer array of data behind the headline, some of which the Bank sends out in a quarterly report to the respondents to the survey (of whom I’ve been one for the last couple of years). There is a median expectation – in some ways, in principle, a more useful measure than the mean, although over the last few years there have not been any interesting differences. But they also provide information on the highest single expectation, the lowest single expectation, and the upper and lower quartiles. I only have the data for the period since I’ve been a respondent (but it would be good if the Bank would make the data, for this and other questions, more generally available on their website).
Typically, there has been a range of about 1.5 percentage points between the highest and lowest individual expectations. If one looks at the actual variance in the core inflation series (chart above) that doesn’t unreasonable: economists (on average) never successfully forecast recessions, and probably don’t do that well on the surges or slumps in core inflation either. For what it is worth, here is a chart showing the highest and lowest two-year ahead inflation expectations, and I’ve shown my own survey responses as well.

I was a little surprised at how much the minimum expectations had increased (and perhaps at how low they got in 2016), but there has also been a visible step up in the maximum expectations. As for my expectations, I was a bit surprised to find that my expectations were the lowest of all 50 respondents in two of the last three surveys. It doesn’t greatly trouble me – my forecast methodology at present is that after seven years of very low and stable core inflation it needs something out of the blue (eg the Reserve Bank finally getting the right model, and attitude) to make me think things will be very much different two years from now than they’ve been for the past seven – but it is an interesting reflection of where crowd opinion (the semi-expert) version has moved to. If we end up with core inflation still hovering around 1.3 to 1.5 per cent, almost every single respondent to this survey (which includes many of the prominent market economists) will have been surprised. In fact, right now even the lower quartile response is 2.0 per cent – a (core) inflation number the Reserve Bank hasn’t managed to achieve for eight years now. Perhaps respondents will be proved right – there is certainly a growing tide of sentiment globally picking a return of inflation (and really reckless fiscal stimulus in the US will help, for now, in the world’s largest economy) – but it would be a turn up for the books if they were.
And I’m at least a little comforted in my own random walk (core inflation will be – best guess – what it has been) expectation, by the numbers thrown up by people actually putting money on these things. I showed this chart a few weeks ago – the gap between our 10 year conventional government bond and the two closest inflation-indexed bonds.
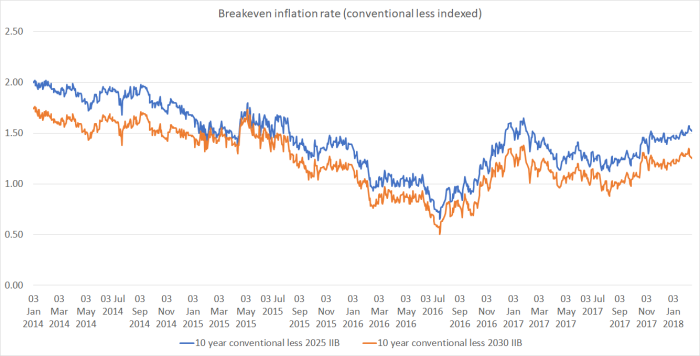
Nothing in those implied expectations suggests we are about to see a material change from the sorts of outcomes over this decade to date. Half-way between those two lines, and the latest breakeven inflation number is about 1.4 per cent – coincidentally (or perhaps not entirely) the current sectoral core factor model inflation rate).
Here is the same chart for the United States, from the St Louis Fed’s FRED database.

The short-term patterns are pretty similar – as you might expect, since there clearly are some common global forces at work – but the levels are now quite different. The market seems to expect US CPI inflation (not the variable the Fed targets) to average around 2 per cent over the next decade.
But not here.
