I’m not much of a rugby fan, but even I noticed a certain amount of enthusiastic coverage of the All Blacks’ comprehensive defeat of France last weekend.
If only we could match that performance in the economic comparisons.
Over the long haul, we’ve done rather badly relative to France. Our GDP per capita was well ahead of theirs, but is so no longer. And if you are inclined to take some heart from the performance over the last 20 years, pause for a moment.

A rather large chunk of that improvement in the relative GDP per capita performance has reflected the volume of labour input.

Hours worked per capita have carried on falling in France, while those in New Zealand have fluctuated around a fairly stable mean since 1950. In 1950, New Zealand’s hours worked per capita was in middle of the pack for advanced countries. Last year, among Western European countries and the offshoots (NZ, Australia, Canada, US), only Iceland and Switzerland had longer hours worked per capita than New Zealand. France, by contrast, has one of the lowest levels of hours worked per capita of any advanced country. I’m not making the case for more (or less) hours, just that in New Zealand’s case it looks as though we’ve needed to work more hours just to maintain our tenuous foothold on the GDP per capita rankings. All sorts of distortions – but notably high taxes – help explain the low levels of labour input in France, and no doubt there is a price for those distortions, but New Zealand is not an obviously compelling alternative model.
Relative to France, labour productivity growth has also been disappointing. And over the last few years, from 2007, neither country has recorded any material labour productivity growth. And the average level of labour productivity in France is now estimated at just over 50 per cent higher than that in New Zealand (in 1950 ours was more than 50 per cent higher than theirs).

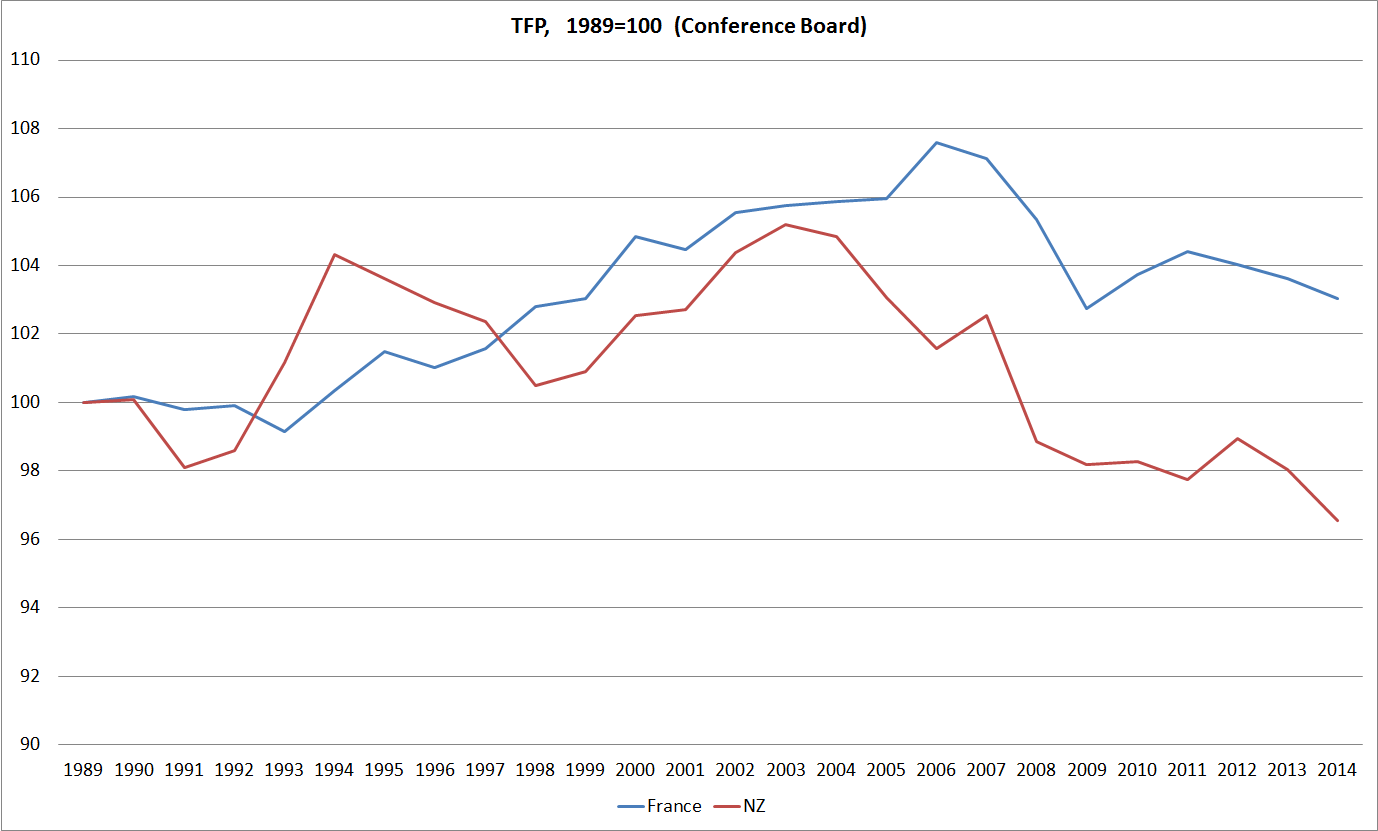
And if neither country’s MFP growth has been particularly impressive, over the period for which the Conference Board has published detailed estimates (since 1989), New Zealand’s has been worse than France’s. Indeed, France was almost the median OECD country over the full period.
Average real GDP per hour worked in France is among the highest in the advanced world – not too different from that in the United States for example. A common argument has been that the high average labour productivity is largely the mirror image of the low level of hours worked per capita, and low overall employment rate. The less productive people simply aren’t employed in France, while they are in some other OECD countries. The employment to population ratio in France is around 41 per cent, compared with over 50 per cent in, say, New Zealand, Australia and Canada.
Perhaps there is something to this story, but I’m not convinced it can explain all of what is going on. Over 50 years or more, labour productivity in France and Germany has tracked very closely together, the two economies produce similar things and are quite highly integrated. And yet Germany has an employment rate almost identical to New Zealand’s.
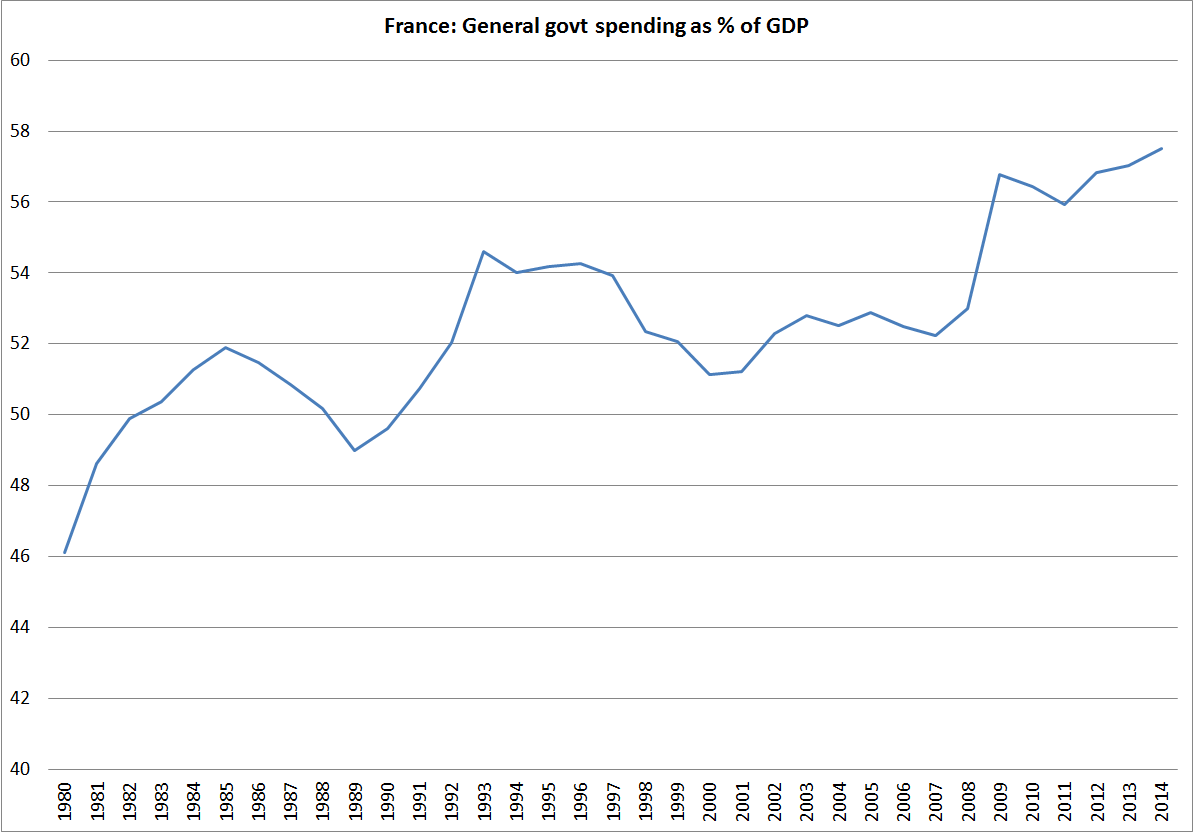
Of course, France has things going for it that New Zealand doesn’t. Being very close to other major rich countries means that France does not suffer any “tax” from small size and great distance. Then again, actual French taxes remain among the highest in world, and government spending as a share of GDP still seems to be edging upwards.
I’m left a little puzzled. I think I’ve worked my way to a story about why New Zealand has done as poorly (relative to the advanced world as a whole) as it has over the last several decades, but I’m still a bit puzzled as to why France has continued to be quite as moderately successful as the statistics suggest it has been. Perhaps the cracks are now showing?
