Some old documents (of no immediate interest)

This is really just a quick information post.

The Reserve Bank’s website has a complete set of Monetary Policy Statements from and including December 1996 onwards, but for some reason they have not put online the first few years of Monetary Policy Statements (which began being published, under the provisions of the Reserve Bank of New Zealand Act 1989, in April 1990). New Zealand’s inflation targeting regime (origins and early development here) took formal shape (with attendant legal obligations) when that Act came into effect, and the first Policy Targets Agreement between the Governor and the Minister of Finance was signed on 2 March 1990.

In the early years of inflation targeting there were (as the law required) only two Monetary Policy Statements a year. At the start, these documents were very light on specific forecast content. The Monetary Policy Statements were complemented by published Economic Forecasts documents, which had been released twice a year for some years (but which then had little impact on anything, and were once – in a meeting with the Minister of Finance I was attending – memorably disowned by the Bank’s Deputy Governor as “just the Economics Department’s view”). With the commencement of formal inflation targeting, and a growing recognition of the crucial importance of inflation forecasts in an inflation-targeting regime, the Economic Forecasts document took on a somewhat greater degree of prominence. For some years (until 1997) the Bank published both documents, in time on a schedule of alternating quarters (before eventually moving to the still-current model of four Monetary Policy Statements a year).

The Economic Forecasts documents for the period 1990 to 1997 are thus potentially of use to anyone seeking to study the entire New Zealand inflation targeting experience, and particularly the experience in the early years when we pathbreaking to some extent (often more like “groping in the murk”), and running a monetary policy implementation approach that was idiosyncratic to say the least. Neither they nor the early Monetary Policy Statements have been readily available.

I had had in my own files hard copies of some of these publications (with bits and pieces stuffed in them, including the September 1992 forecasts for which I was responsible and which the then Opposition Finance spokesman had described as “looking as though a public relations firm had written it” – on this occasion reality (notably fiscal reality) turned out better than the numbers he hadn’t liked)

But this complete set became available through the efforts of my son, who is doing an honours thesis in 2024 on some technical aspects of New Zealand monetary policy in recent decades. He requested the documents from the Bank and was provided with the full set from 1990 to 1997 (and my understanding is that it took a bit of work from the Bank, for which thanks). With his permission I am posting them here as a more permanent record and to make them generally available to anyone interested.

There is a full page, with a link on the front of this website, with links to all these documents
Two central banks

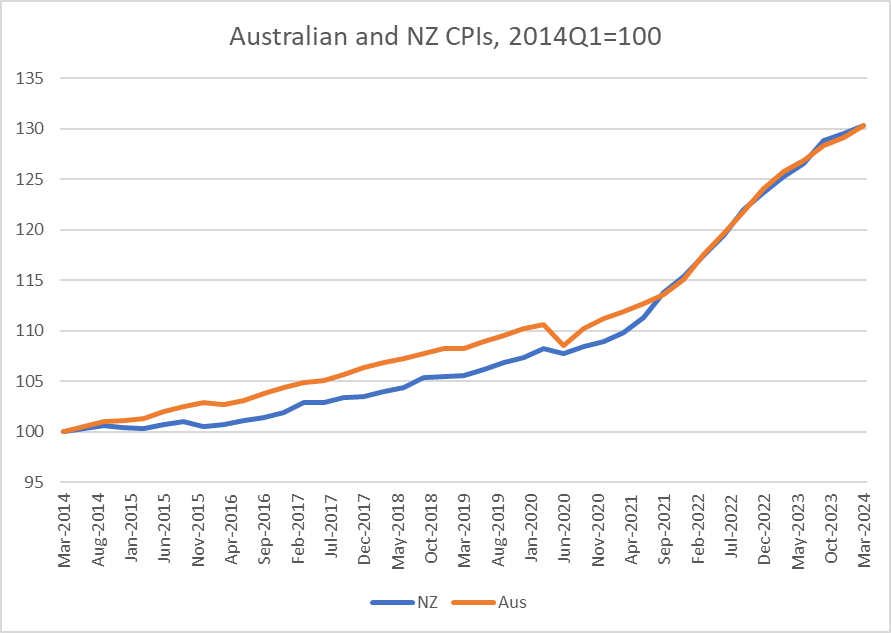
I got curious yesterday about how the Australia/New Zealand real exchange rate had changed over the last decade, and so dug out the data on the changes in the two countries’ CPIs. Over the 10 years from March 2014 to March 2024, New Zealand’s CPI had risen by 30.3 per cent and Australia’s CPI had risen by 30.4 per cent.

And that piqued my interest because the two countries have different inflation targets: New Zealand’s centred on 2 per cent per annum and Australia’s centred on 2.5 per cent.

So I drew myself this chart

Over the full 10 years, the two CPIs have increased by almost exactly the same amount, but they haven’t kept pace with each other steadily over that full period. Up to just prior to Covid, the Australian CPI had been increasing faster than New Zealand’s, as one might have expected given that the RBA had been given a higher inflation target than the RBNZ.

Now, before anyone objects, I should get in and note that in neither country is there a price level target. But if economies are subject to fairly similar shocks over a period of time one should normally expect a country with a higher inflation target to have experienced a higher cumulative price level increase than a country with a lower target.

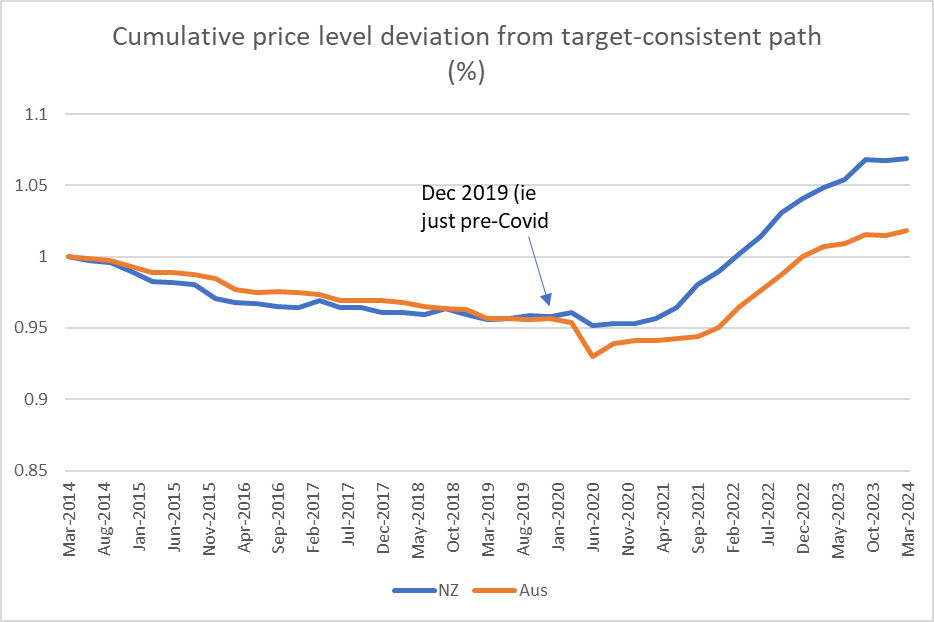
Over the 10 years here is Australia’s CPI relative to the price level that would have been implied by being consistently at target midpoint

and the same chart for New Zealand

And in this chart I’ve put it all together

Over the half-decade or so to the end of 2019, the RBA and the RBNZ had both ended up undershooting (on average) their targets by about the same extent. If you look closely, the RBNZ was undershooting more earlier, and the RBA more towards the end of the decade, but there wasn’t a great deal in the difference.

But where the difference really becomes apparent is in the years (four of them) since Covid hit. Over that period, the RBNZ has generated/tolerated much more of an increase in the price level, in excess of what is implied by their target, than the RBA did. (And for those – like Orr – who like to try distraction with things like oil shocks, wars and rumours of wars, and supply chain disruptions, Australia faced all those too.)

There is a lot of focus in Australia – and apparently reasonably enough – on whether the RBA has yet done enough with monetary policy. It has certainly been puzzling that they reckoned they could get away with materially lower policy rates than in other Anglo countries, in the face of (still) near-record low rates of unemployment and a quite stimulatory fiscal policy. But so far, and overall, they’ve done a bit less badly than the Reserve Bank of New Zealand through the last four years taken together.

It remains somewhat remarkable how little serious accountability there has been for serious Reserve Bank policy errors, for which now pretty much everyone (except them) is paying the price. in one form or another.

(By the way, for anyone interested, the NZD/AUD exchange rate averaged 0.933 in the March 2014 quarter and 0.932 in the March 2024 quarter, so over that particular 10 year period there was no change in the real exchange rate at all.)