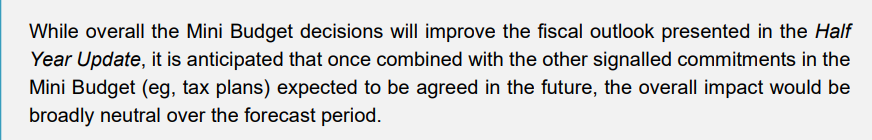
[NB: I wrote a few quick paragraphs here before fully appreciating that nothing of the government’s own policies were being allowed for in the numbers (which itself seems unsatisfactory). Nonetheless I am leaving the post up because (a) I don’t want to pretend it wasn’t written, and b) the Treasury’s own comment (see below) that, to a first approximation, government plans to date do not seem likely to improve the outlook, and c) the fact that the Minister’s statements give no particular reason to think actual policy will be better than what is allowed for in these numbers. Fiscal policy has been badly mishandled in recent years and we should not be looking at deficits for the next few years.]
As I wrote prior to the election, both in the PREFU (reflecting Labour’s plans, some plucked from the ether just in time for Treasury to do the numbers) and in National’s Fiscal Plan, there was a strong element of either wishful thinking or vague “trust us, we’ll do it” about the numbers. Both parties talked up getting the operating balance (OBEGAL) back to surplus by 2026/27, but neither gave us any specifics as to quite how the substantial structural deficit was going to be closed. There were lines on a graph, and that was about it. In its pre-election plan National indicated that by 2026/27 it would deliver a slightly large surplus than Labour (in PREFU) had foreshadowed.
That was then. In their pre-election fiscal plan, National’s numbers were for an OBEGAL surplus in 2026/27 of $2.9 billion. In the first EFU of the new government, incorporating the new government’s fiscal plans [UPDATE: the government’s plans are not included, but - see note below - Treasury’s best guess so far is that for things foreshadowed or announced they would make little difference], that surplus has been revised down to $140 million, basically zero (Treasury shows it as 0.0% of GDP). Recall that under the previous government, the date for a return to surplus was always just somewhere over the (rolling forward) horizon. Is it any different now? And the revisions aren’t just to that one year: for 2025/26, the Fiscal Plan foreshadowed a deficit of $1.0 billion, but the HYEFU numbers now show a deficit that year of $3.5 billion.
Core Crown spending was, unambitiously, supposed to fall to 31.0 per cent of GDP by 2027/28 (the only year for which the Fiscal Plan gave us numbers), but HYEFU has spending that year of 31.4 per cent of GDP. Perhaps unsurprisingly, net debt by 2027/28 is also a couple of billion higher in 2027/28 than National’s plan had portrayed.
In the grand scheme of things, these dates are quite a long way away, and the changes are, in isolation, perhaps of only middling significance. But from a starting point of (a) years of structural deficits (when one, just possibly two, years of deficits might have been warranted by Covid), and (b) repeated revisions which pushed further into the future the return to surplus, it is hardly an encouraging sign from the new government and its Minister of Finance (whose comments on the HYEFU bottom lines seems to take them for granted, rather than foreshadowing something materially less bad).
And all this in a “mini-Budget” (perhaps itself an ill-advised pre-election promise, which put the Minister against very tight deadlines) that seems to offer nothing any more specific about how the government proposes to return to surpluses, and what (at scale) it proposes to spend materially less on.
It was all rather underwhelming, and the slippage relative even to what National was promising just over two months ago is disappointing. It is though perhaps consistent with the pre-election rhetoric from National that seemed very little bothered by the size and duration of the run of fiscal deficits Labour had run, and proposed to carry on running. Sure, they have to deal now with coalition partners, but when the first fiscal numbers have a worsened outlook it hardly speaks of a strong and demonstrated commitment to “getting New Zealand back on track”. On these numbers, we’ll have had eight years in a row without an OBEGAL surplus…..and even those numbers rely on high-level wishful plans rather than concrete specifics.
On the economic numbers, much will have been superseded by the surprises in the GDP numbers last week. But it is perhaps worth noting that - working with much the same information the Reserve Bank had for its MPS late last month – the Treasury reckoned that the economy was still runnjng excess demand to a greater degree than the Reserve Bank (a positive output gap on average for the year to June 2024), but that the Treasury also envisaged earlier room for OCR cuts (having the OCR at 4.9 per cent by June 2025, while the Reserve Bank was projecting 5.4 per cent), with a weaker exchange rate too.
UPDATE
From the HYEFU document.
UPDATE:
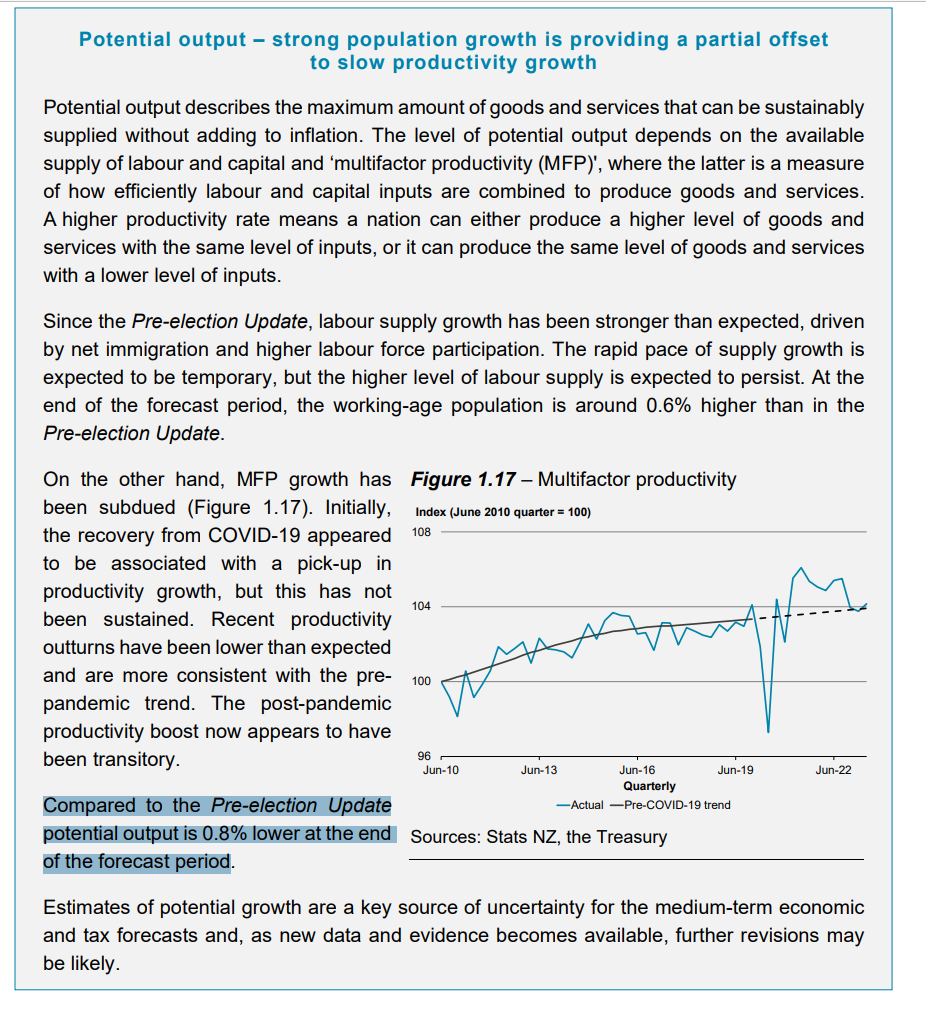
Notwithstanding the Treasury headline, the highlighted sentence is probably more pertinent. With a higher than previously forecast population, potential output has still been revised down, so mediocre is the NZ productivity story. Treasury should probably have been more careful earlier about believing that somehow productivity growth had accelerated in the wake of Covid, something for which there was never any a priori reason to expect/believe.