It is election season, and since the performance of the economy enables (or disables) so much of what political parties want to do, or to spend, it is worth having a look at a few charts. There have been plenty on inflation this year, and plenty of fiscal policy in just the last few weeks.
I had an op-ed in The Post and The Press the other day, which touched on some of the old and new economic challenges, the greatest of which – and longest running of which – is the dismal productivity performance of the economy.
I had in mind this, from a post a few weeks ago

I’d wondered how New Zealand had done over just the last 10 years – half spent under National governments and half under Labour governments.
We’ve dropped six ranking places in a club of only 37 members in just a decade. It took me a little bit by surprise, and I think partly because the New Zealand debate (such as it is) rarely focuses on the countries that are now most similar to us in productivity terms.
And for those wanting to play crude National vs Labour partisan games on this one, probably best not. Here is our quarterly data up to Q2 this year, with a simple linear trend through the data. The last few years have been a lot noisier, as you might expect, between (a) Covid disruptions, and (b) the fact that recent data are somewhat provisional and will keep getting revised for the next few years. Note that whatever influence political parties’ policies and practices have on economywide productivity, outcomes don’t just change the day a different party takes office.

A line I’ve banged on about quite a bit over the years is the unbalanced nature of the New Zealand economy, in which growth in production in the tradables sectors has tended to lag behind that in the non-tradables sectors, going back at least 20 years, and the opposite to what one might expect to see in a successful economy gaining ground on other countries it had dropped behind.
Here is the latest version of the summary chart I’ve used for that purpose.
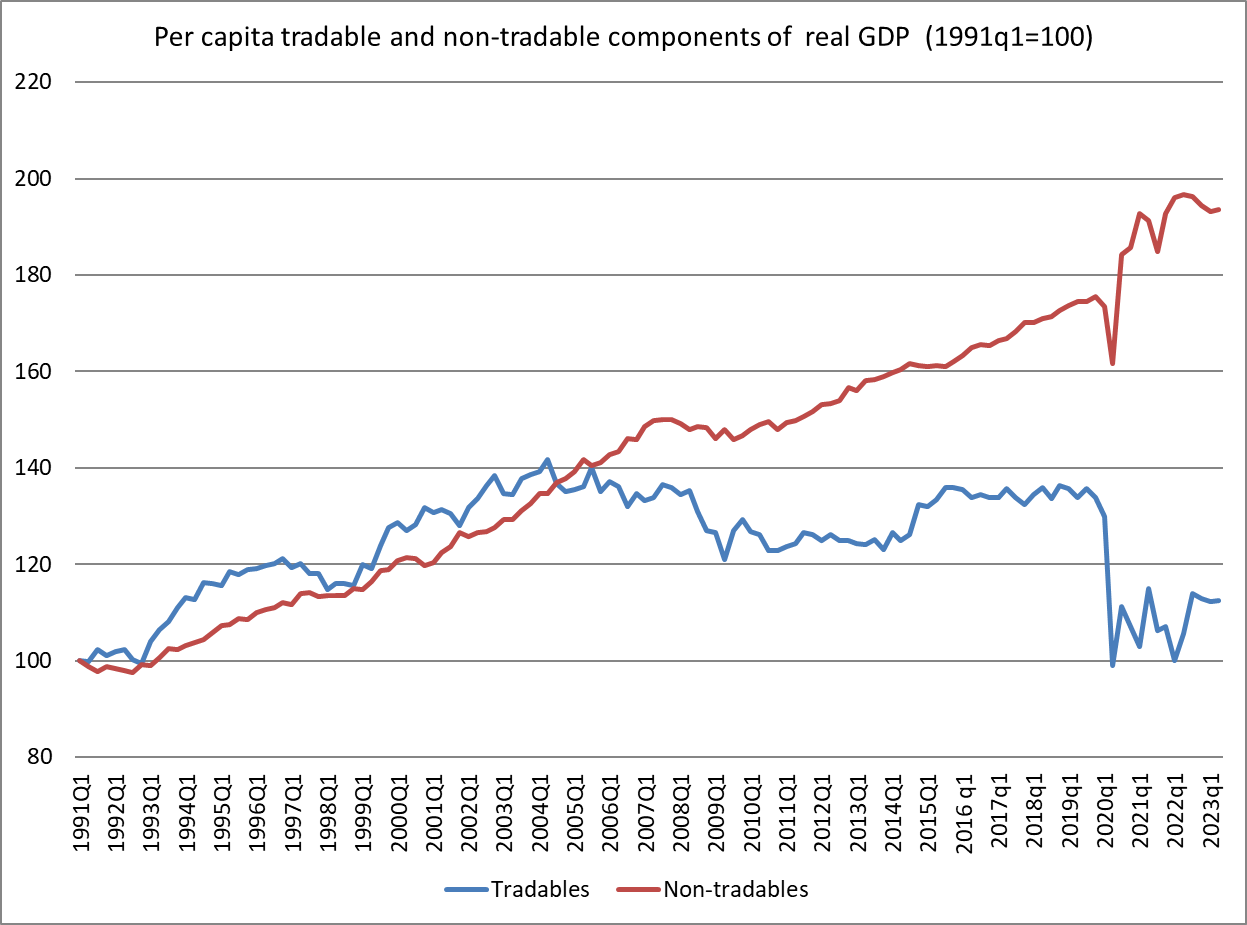
Tradables sector output, per capita, is about where it was 30 years ago. Even if tourism magically quickly recovered to pre-Covid levels, the pre-Covid picture wasn’t really much more encouraging.
In last week’s column I noted
Productivity isn’t primarily about individuals working harder. It is mostly about having an economy where more firms find it attractive to invest in producing new and better products, to produce old products in better ways, tapping new markets, and by doing so supporting higher incomes across the board. But business investment here has been weak, as a share of GDP, for a long time. Nowhere near enough firms are finding anywhere near enough opportunities to enable New Zealand to reverse its sustained relative economic decline.
I hadn’t checked the comparative business investment numbers for a while but I did this morning

Sure enough, in a country which has had much faster population growth than most OECD countries – and high labour force participation – business investment has been lower as a share of GDP than in most advanced economies. That isn’t what you’d expect to see in a country making any progress at all in reversing the decades of decline. It is, however, consistent with New Zealand’s own dismal record.
And while for a decade or so we managed to support growth in living standards on the back of a rising terms of trade, that was almost a decade ago now. The terms of trade haven’t gone consistently backwards, but they aren’t supporting any further growth in material purchasing power (or the tax base)

I also touched on house prices in that op-ed, observing
House prices are rising again, from levels that are still punishingly high. In real terms they are materially higher now than when the current government took office, a pattern we’ve seen with successive governments for decades. Political parties talk about improving housing affordability, but market prices speak louder than politicians’ words.
What I had in mind was this chart, drawn from the BIS cross-country database of real house prices, going back many decades (in our case to 1970). Assuming Labour loses office this month we won’t have the final data for their term for a while yet, but I’ve allowed another 2.5 per cent real drop from the last published value for the March quarter this year.

Terms of government differ (3, 6, and 9 years) and of course background economic circumstances differ a lot. Often within terms of government there have been both periods of flat or falling real prices and ones of quite material increases. But for more than 30 years, real prices have been rising……really for no other reason than the combination of regulatory and structural policy choices successive governments have made. Parties approaching office like to suggest they have some sort of answers, but they haven’t delivered…..and current market prices (remember, houses are asset prices, trading on all information about the expected future) don’t suggest the likely next government is likely to be much different. Land prices in peripheral areas around our cities certainly aren’t collapsing. (And all this latterly after the steepest quick increase in interest rates for many decades – probably since 1984/85.)
Which brings us back to productivity. Neither main party – one of which will lead the next government – seems to have any serious idea or policies (not even an underlying narrative) that might turn things around and offer a much better (relative to the other countries we increasingly lag behind) tomorrow for our children. Judging by how little the words (“productivity”) or ideas have appeared in debates, manifestos, campaign appearances, it isn’t obvious they really care much. Squabbling over which baubles to offer the voters, and how to pay for them (at a time when the budget is deep in deficit) seems to be where the game is at.
Our poor next generations……

I am more hopeful this time that the new government will do more than minor tinkering.
LikeLike
Serious question (because I wish I could share that optimism), what do you point to as the basis of any greater optimism?
As someone who was never a huge Key fan, I still remember some positive strands in their 2008 manifesto and pre-election talk. Some of those good things even happened, but it was all at the margin, just not sufficient to the scale of the challenge.
LikeLike
My basis is the influence of Act and that Luxon seems more motivated to follow through on his promises than Key.
LikeLike
Time will tell I guess. I hope you are right.
LikeLike
Re ‘investing in new products..’ etc, perhaps this is a cultural problem in New Zealand.
Mention ‘investment’ and people immediately think of Government. We are constantly told by all parties what they will ‘invest’ in.
The concept of private parties investing with Govt involvement is foreign to us, certainly compared to US, Germany etc (the countries with highest growth).
But in my view private companies are more likely to identify real market opportunities and product development potential than Govt committees and Finance Ministers.
LikeLiked by 2 people
Is investment in housing regarded as business investment? If not, it seems fairly obvious where much of the difference comes from. That said, the gap between NZ and the OECD median doesn’t seem that large?
Recently I’ve read about the “housing theory of everything” which is the idea that high housing prices have a much greater impact than we realise. I would be interested to hear what you think of it: https://www.fastcompany.com/90941016/the-housing-theory-of-everything-why-the-future-of-innovation-depends-on-housing-affordability
LikeLike
No, housing is not in this measure of business investment (which is total GFCF less housebuilding less govt GFCF). The difference in the chart is large, especially when you bear in mind that with a higher avg population growth then all else equal we’d require a larger share of GDP devoted to both business and housing real investment.
Will take a look at that piece.
LikeLiked by 1 person
Ah, I see the piece was short. It is a story that has quite a bit of power in places like San Francisco and NY – and London for that matter – where GDP per capita for those cities/regions is far far higher than the average in the rest of the respective countries. More people would take advantage of it, and contribute to making it, if housing markets were freed up.
I’m all in favour of freeing up housing markets elsewhere (eg NZ, Aus, Canada), but as it happens our biggest cities (Akld, Sydney, Melbourne, Toronto, Vancouver) just generate anything like the SF/NY/Ldn margins of GDP per capita over the rest of their countries. So I strongly favour freeing up housing here because it is the right thing to do, and will make housing affordable again, not because i think we are suffering because more NZers can’t/won’t move to Akld (or more Australians to Sydney).
LikeLiked by 1 person
OECD diversity hires: so checked Colombia: gdp growth rate for 2022 was 7.50% and for 2021 it was 11.02%. Economic Co-operation and Development can apply to what have been traditionally 3rd world countries. The internet has changed the world – a minor effect on productivity but a major effect on the aspirations of impoverished communities. A rapid growth in economic migrants crossing the English Channel in inflatable boats or living in self-built sheds in Auckland. But also rapid growth spurts in places Bangladesh. If NZ had matched Colombia with 20% growth in wealth over the last two years then we really wouldn’t be much different – new cars, more yachts, more expensive holidays but I’m sure that 20% in Colombia is changing lives with refrigerators, foreign travel better education, improved medical facilities.
You have experience working in developing countries; an article on how you see their prospects would be interesting.
LikeLike
Bear in mind that even now Colombia has average productivity about 1/3rd underwhelming NZ has. (I have a v large pile of books on the floor beside me, about to start a structured study on why it is that Chile – prob the best of Latam countries over the long haul – has always been so much poorer and less productive than NZ,
LikeLiked by 1 person
Productivity in NZ is largely crowded out by regulation. This is reflected in the balance of payments.
Tradable producers are in trouble Primary production has fallen away .Examples are the once great sheep industry. Now 20 million sheep v 73 million 50 years ago. The sheep industry can not now compete with the highly subsidised forestry and Carbon industries. NZ is a nett importer of pork.
Manufacturing is little better with most disappearing offshore.
Tradeable producers are in trouble. Even simple road maintenance is choked by environmental, social and bureaucratic impost’s.
Increasing GDP has largely been driven by local disasters ,government spending and immigration.
The political suggestion of “Export led recovery “ is a myth..Export volumes are down , prices are collapsing for forestry and the winds of change are starting to blow on viticulture..
Dairy does remain but seldom has an industry had to suffer more punitive regulation! ,Some of which is so complex even the regulators do not understand the regulation.
There is more regulation coming for forestry, more taxes and other regulation on those producing carbon credits.Indeed the carbon market itself does not stand up well as Government auctions continue to fail.
NZ does not have the needed volume of tradable exports !
It would also be interesting to compare the efficiency of capital use to GDP in NZ.
Given endemic bureaucracy ,NZ must be well down the list on that metric as well!
LikeLike