Time moves on. This post was going to be run late last week once the last OECD inflation data for the June quarter (that for Australia) came out, but a bad cold ran through the house and not much got done. Last night, July inflation numbers were released for the euro-area (remember that NZ only recently got mid-May’s numbers), but this post is going to focus just on the numbers to June.
This is annual CPI inflation ex food and energy (the only core measure available for a wide range of countries) as at the end of June. The sample of countries is the OECD countries/regions with their own monetary policies, excluding Turkey (with off the charts crazy monetary policy and inflation) and the OECD’s poorer Latin American diversity hire countries (but note that two of those latter countries’ central banks have already started cutting policy rates). Of two other advanced countries not in the OECD, Singapore’s (headline) inflation peaked at 7.5 per cent, and Taiwan’s at 3.6 per cent.
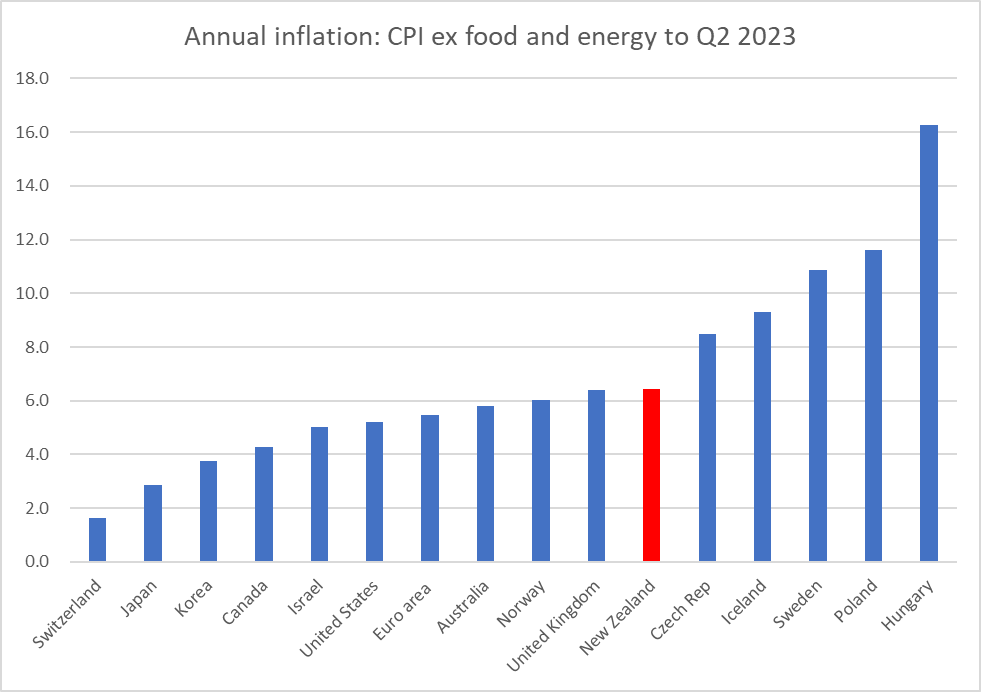
The diversity in outcomes across countries isn’t often recognised. Politicians and central bankers have both tended to go along with lines about “everyone is experiencing much the same thing” (which is a convenient line for avoiding specific and localised accountability). But they aren’t.
Pre-Covid, inflation rates across countries were very tightly bunched (in 2016q4 for example, the lowest core inflation rate for these countries was -0.4 and the highest was 2.9 per cent, at present the range is from 1.6 per cent to 16.2 per cent)
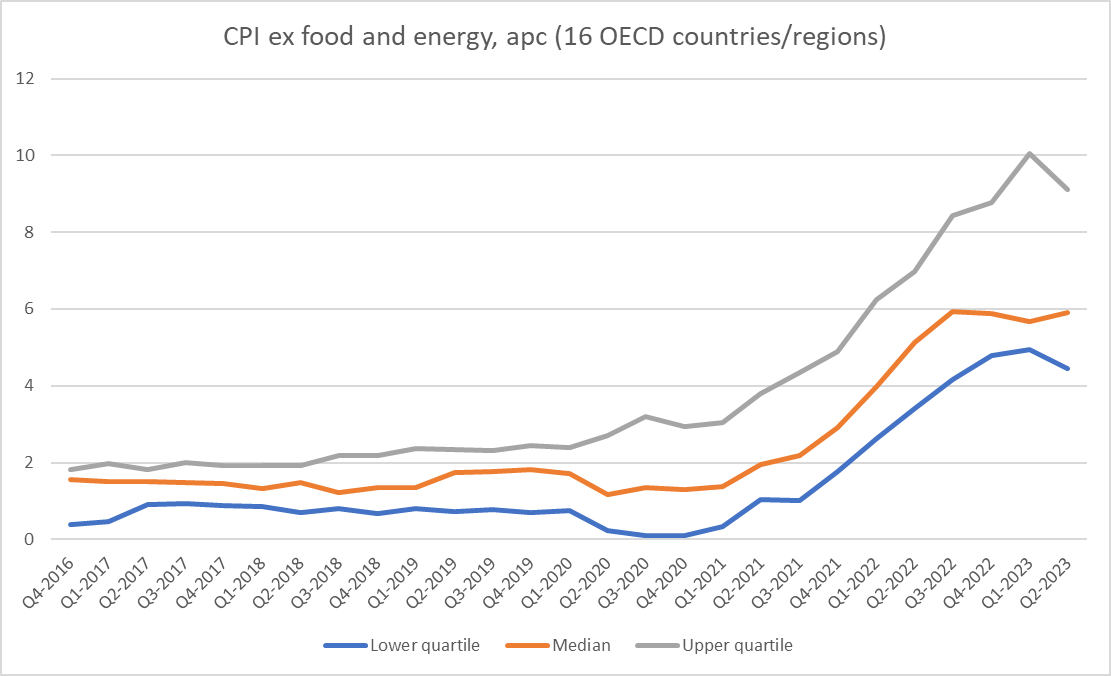
And here is how New Zealand has gone on this metric over the same period relative to the median of these 16 countries/regions.
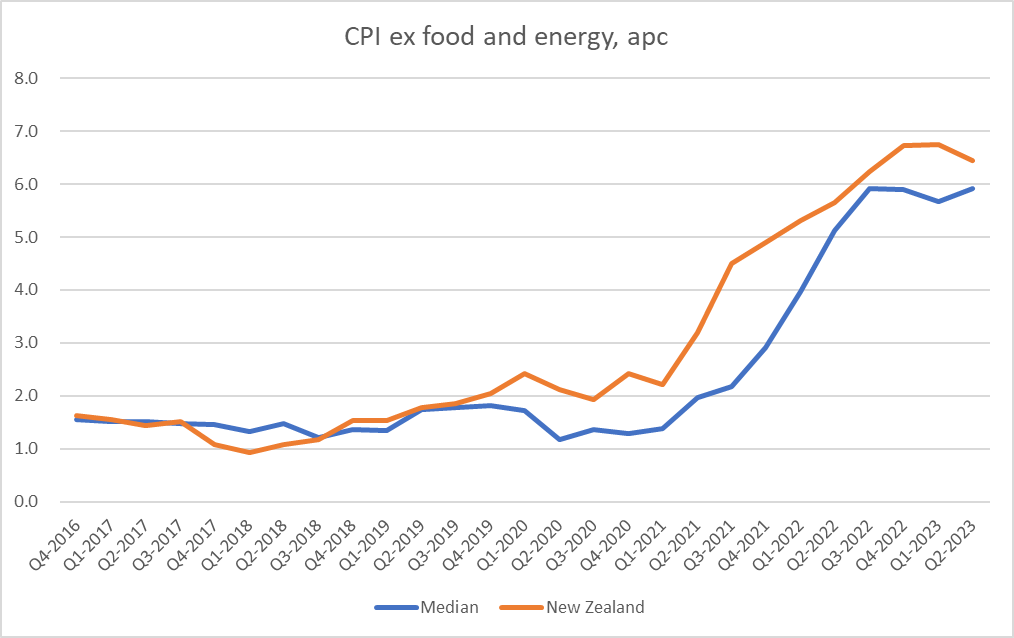
Pre-Covid our core inflation rate was around the median (altho perhaps showing signs of beginning to pull away) but over recent years core inflation in New Zealand has been consistently higher than in other OECD countries (and of course now miles above target). That is on the Monetary Policy Committee. Note that at least on this measure there is no sign yet that the median country’s core inflation rate is yet falling.
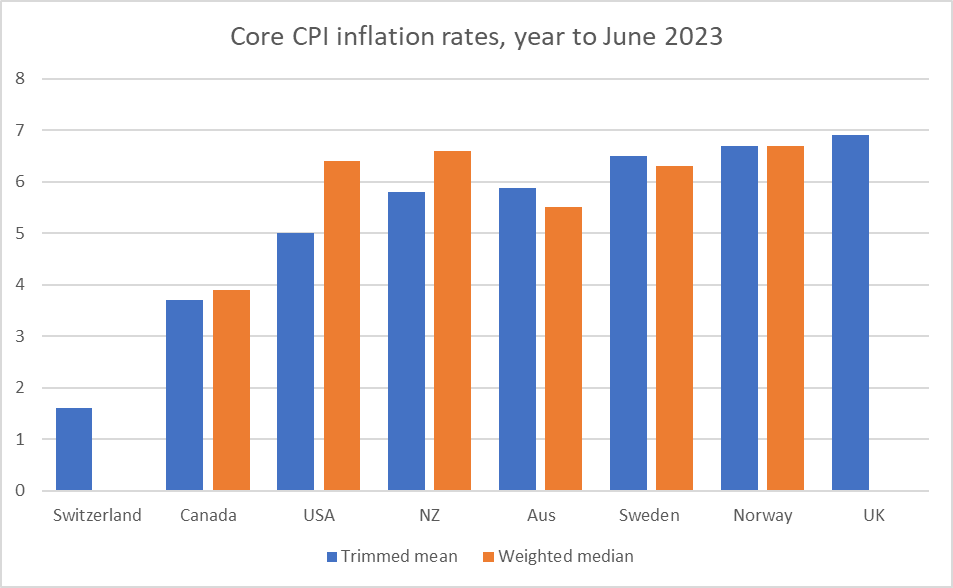
There are other core inflation measures, and each country or central bank often has favoured or specific ones, sometimes ones best suited to particular idiosyncrasies at the time. But a fair number of countries or central banks have and publish either trimmed mean or weighted median measures (others have and use them – seen at times in speeches etc – but don’t seem to make the data series routinely available). It would be great if there was a consistent collection of these (generally superior to crude exclusion) measures across advanced countries, but there isn’t.
I did what I could and found trimmed mean and/or weighted median data for eight of the countries above (NZ, Australia, US, UK, Canada, Switzerland, Sweden, Norway). Even then it is complicated by things like having only a chart for one country, and inconsistencies in whether there is monthly/quarterly or just annual data available, and in whether or not seasonally adjusted data is used (NZ doesn’t). Oh, and the US has fuller data for PCE inflation – the Fed’s focus – than for CPI inflation.
Here is where the annual rates of core inflation stood for these countries at the end of June (there are no weighted medians for Switzerland and the UK)
And here is the time series for the five countries with both weighted median and trimmed mean annual rates
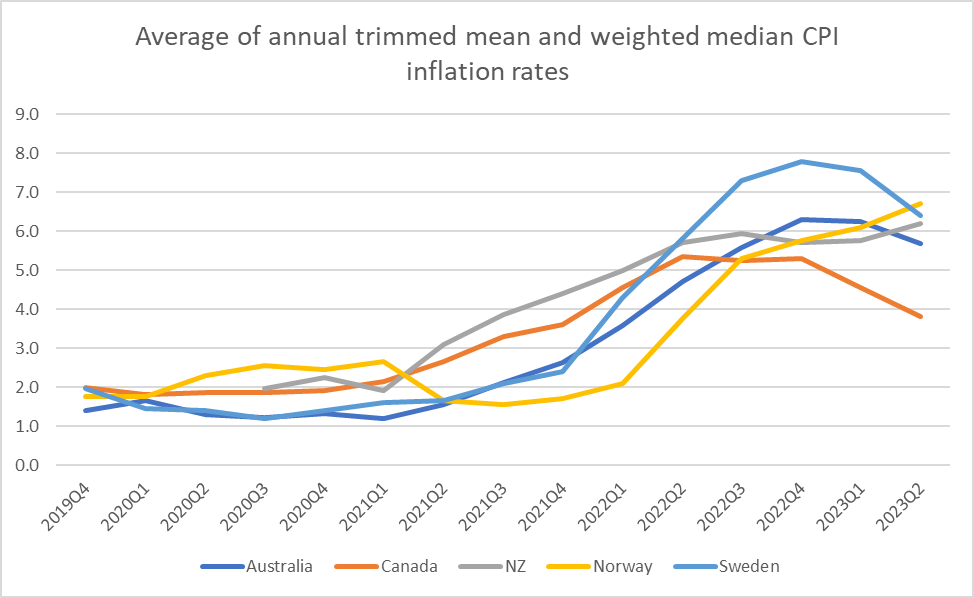
It is a mixed picture. Core inflation in Sweden and Canada has clearly fallen, and Australia seems to have as well, although to a lesser extent. Things are still getting worse in Norway, and in New Zealand things are probably best seen as going sideways. Of the other countries, the chart of trimmed mean inflation in the UK suggests they are still very near a very recent peak, and Swiss trimmed mean inflation is now down a little from peak.
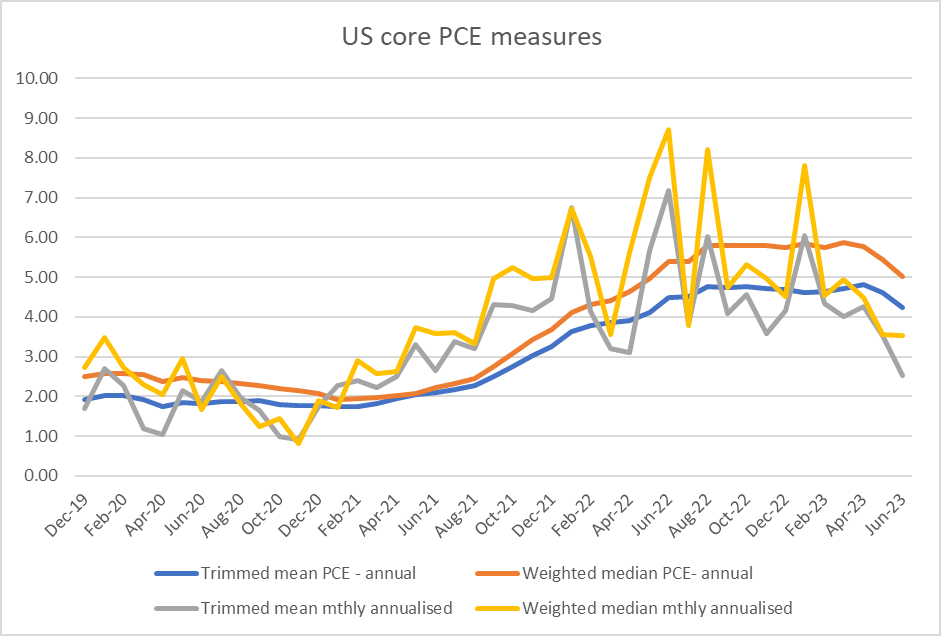
What of the US, which gets most coverage? Focusing on the PCE measures, core inflation is clearly falling
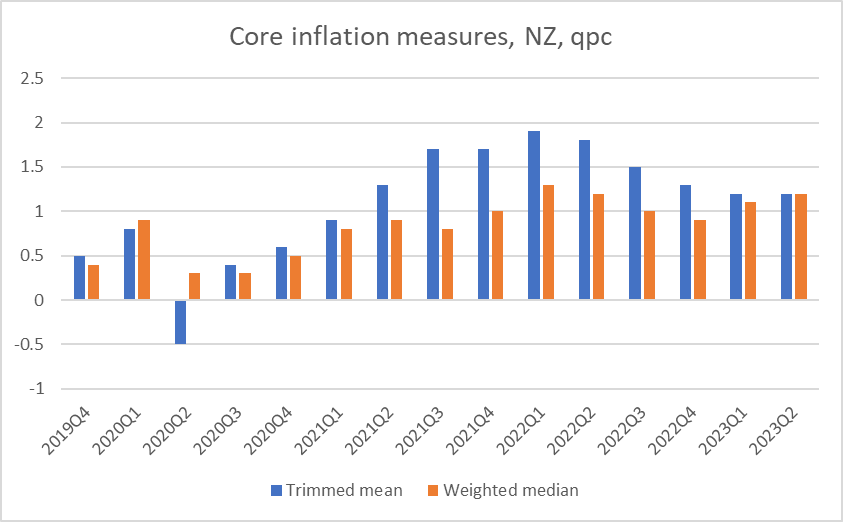
Most countries don’t provide quarterly or monthly percentages changes, but we do have that data for New Zealand and Australia (in New Zealand’s case complicated because SNZ does not – for some inexplicable reason – use seasonally adjusted data to do the calculations. There isn’t much seasonality in the resulting series, but using raw data tends to skew downwards the quarterly changes – when, eg, there are things that reprice once a year.) Here is the NZ chart
and the Australian one
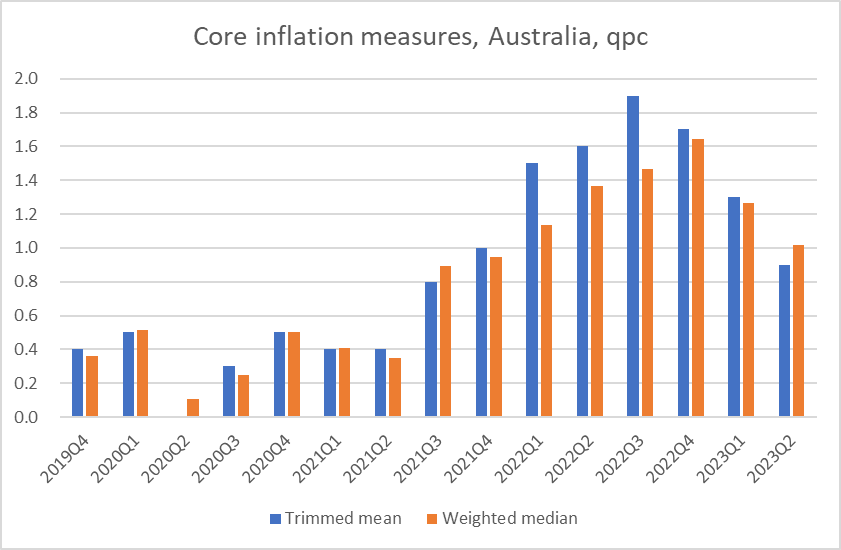
For Australia, the falling rate of quarterly core inflation is now pretty clear. Both measures now paint much the same picture. But for New Zealand while the trimmed mean suggests quarterly inflation has peaked (quite some time ago), a) there is no hint of that in the weighted median, and b) in the last couple of quarters there is no sign the trimmed mean is falling further. The fact that the two series have re-converged suggests not much grounds for comfort about New Zealand core inflation (especially when put together with the simple ex food and energy measure). On balance, perhaps we could say that the worst may have passed, but none of the series are yet suggesting anything like a quick convergence back to target (recall, the MPC is required to focus on the 2 per cent annual target midpoint).
Which brings us to monetary policy.
At their last review – incredibly, scheduled deliberately a week BEFORE New Zealand’s rare and infrequent CPI data came out – the MPC declared itself thus.
It isn’t clear to me how (a) any central bank can credibly claim to be legitimately “confident” about anything much at present (if your models got inflation so wrong over 2020-2022, why would you be confident things were working just fine now, and b) how the RBNZ MPC any particular had found any reason in the data (let alone the CPI data they chose not to avail themselves of) for their particular breed of “confidence”.
I checked the RBA and Bank of Canada statements last month: they didn’t seem confident (much more, as you might expect, data-driven). Nor did the Bank of England or the FOMC. And there was no apparent confidence that they had done what needed doing in the SNB, Norges Bank or Riksbank statements either. In fact, the Swedish Riksbank’s latest statement captured nicely what might have been expected here, on the data as it stands
This from a central bank with the same target as the RBNZ, similar current core inflation, but clearer evidence core inflation has already been falling.
It leaves a distinct sense that, as so often, the RB MPC was engaged in spin, lacking in substantive analysis.
There will some important further data out before the MPC again sets the OCR later this month (notably tomorrow’s labour market suite, and also the Bank’s Survey of Expectations – the one that so far this cycle has done a less bad job than the MPC of picking future inflation), so what they should do in August is still to some extent a question for another day (although they should, if they are at all intellectually honest, take that “confident” statement off the table). But how about where things stand now? And all bearing in mind that monetary policy works with a lag (although quite how long and variable those lags really are does seem to be up for debate).
There are central banks where you really have to wonder what is going on. For example, policy rates haven’t been raised in Hungary and Poland since September last year and both now have double-digit core inflation (still rising in Hungary). Less extreme, the Norwegian central bank has core inflation still rising, and although the central bank has raised the policy rate by 100 basis points this year, it is still only 3.75 per cent (and Norway’s latest monthly unemployment rate is still very low). Iceland also has core inflation steady at around 9 per cent.
On the other hand, when one looks at the Bank of Canada’s increase in the policy rate last month (to the highest level in more than 20 years), in conjunction with the already-falling and fairly moderate core inflation you get the sense that, if they are still too sensible to say it, that they might have good grounds for being increasingly confident of being back to target before long.
It would all be a lot easier if we had robust estimates of the neutral real and nominal rates for each country. But we don’t (neither the real rates nor the implicit inflation expectations that are actually shaping behaviour of firms and households).
And there is lots of differences across countries. For the period since 1999 (when the euro started, and the NZ OCR began) here is the median policy rate in each country (differences would be a bit smaller done in real terms, but still substantial).
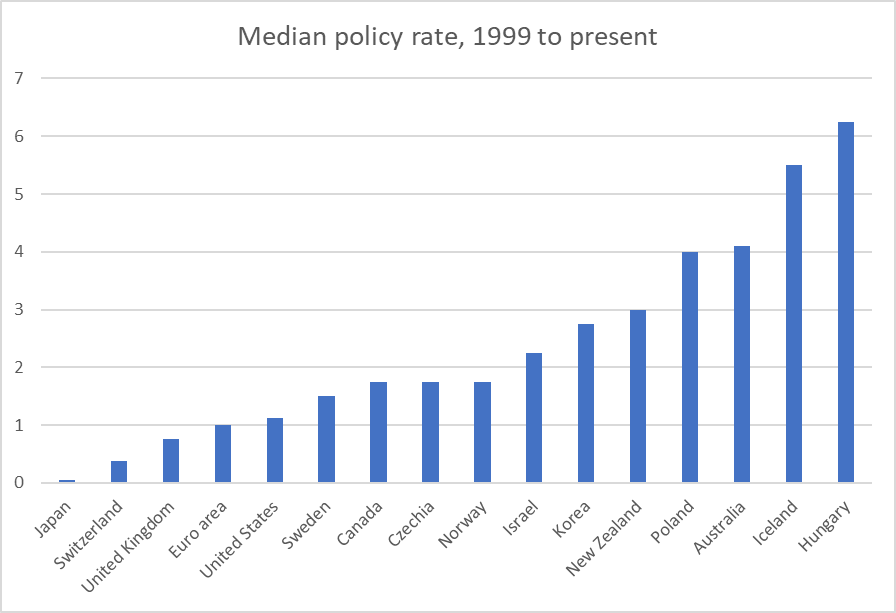
All countries, except Australia, now have policy rates above those medians.
I took a look at how current policy rates compare to the peaks in each country in and around 2008. The median difference across those 16 countries is under half a percentage point (eg both the US and the euro-area now have policy rates almost exactly the same as that pre-crisis peak).
But four countries stand out, with policy rates now well below that previous cycle peak. There is Iceland. Now, the pre-2008 peak was in the context of one of the most staggering and destructive credit booms in modern times. Still core inflation is 9 per cent, and the policy rate even now is only 8.75 per cent. There is Norway: as above, core inflation is high and rising and (from a distance) it is hard to be confident things are in hand.
And then there are New Zealand and Australia, both with policy rates around 3 percentage points less than the 2007/08 peaks (and there is a pretty common view about 2008 that the RBA got lucky, not having had policy rates tight enough – in the face of a mining investment and terms of trade boom – but being “saved” by the international recession. The Australian story puzzles me: rates are well below previous cyclical peaks, the unemployment is still extremely low (including far lower than just pre Covid), but……the data (see above) show that core inflation has turned down (and while there is still a way to go, Australia’s target is a bit higher than some other countries’, including New Zealand). If I wanted to be “confident” I’d done enough, one can see a good case for higher rates (perhaps later today), but there are plausible counterarguments.
Much less so for New Zealand. We don’t have core inflation falling, we don’t have unemployment rising much (and last week’s employment indicators still looked quite strong), unlike most previous policy rate cycles there is no disinflationary support from a rising exchange rate, and the OCR is miles below the 2008 peak. (One could no doubt add in points Westpac in particular has been making about a bit of rebound in confidence, but I’m not trying to review all the data.)
Were I in the Fed’s shoes or those of the Bank of Canada I might by now be feeling somewhat more secure. Were I at the Norges Bank (as far I can see) I’d be very uncomfortable. The Australian data are perplexing but there seems nothing in the New Zealand data – considered a cross country or across time – to give any central bank decisionmakers any particular reason for comfort (let alone “confidence” at all). Macro forecasting is something of a mug’s game, and it is always possible the RB MPC may have done enough, such is the uncertainty, but it is very hard to see at this point (and the Committee has provided no analysis in support of their stated “confidence”, continuing a fundamental dereliction (no speeches, no serious research, no serious analysis) that dates back at least to the creation of the MPC). Things may be just about to break, and there are a great many uncertainties here and abroad, about how this cycle is unfolding, but the sort of “confidence” the MPC is asserting risks seeming more political (eg life seems like to be easier for Orr if Labour is re-elected) than grounded in secure economic analysis.
