I don’t want to say much about yesterday’s Monetary Policy Statement itself. It was the last before the MPC knocks off for their very long summer holiday and the last for the temporary Governor, the last of the old MPC who were responsible for the inflationary mess (and all those LSAP losses). A 25 basis point OCR cut seemed like it was probably the right call, but it was good to see some evidence of a range of views (in the form of one dissenting vote).
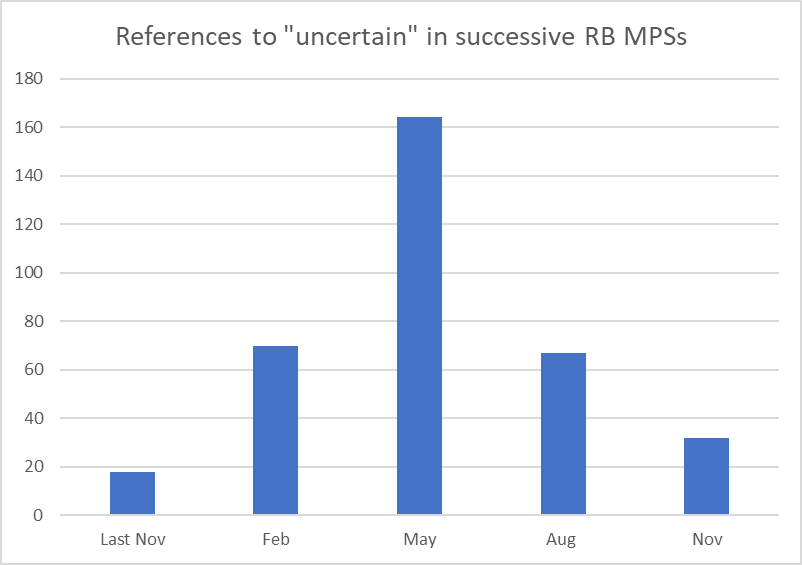
I didn’t watch the press conference yesterday (and the video of it doesn’t yet seem to be available). Someone who did watch it told me that Hawkesby had suggested that the dip in economic growth in the June quarter was mostly due to Trump and the extreme uncertainty about US tariffs policy (and, I guess, how other countries might respond). He is reported as having suggested that otherwise the recovery had been on track. Such a line would certainly be consistent with the very heavy rhetorical emphasis the MPC, and one of its members in speeches, has been putting on uncertainty in recent months, albeit the frequency of use of the term in the MPSs seems to be dropping back again.
I don’t know precisely what words Hawkesby used, so perhaps it wasn’t as stark as what was passed on to me (the MPS text itself is fairly non-specific, while correctly noting that the -0.9 per cent was almost certainly not representative of how deep the real fall had been).
[UPDATE: In fact both Hawkesby and his chief economist – the latter more expansively – ran this line, citing not a shred of evidence in support of their story.]
But I’m sceptical that the (very real) heightened uncertainty around foreign tariff policy had anything much to do with the overall performance of the New Zealand economy in the June quarter. There simply aren’t any particularly obvious channels by which there would have been such effects. We weren’t Canada (directly in Trump’s firing line for a while), we weren’t subject to unusually large proposed tariffs (and our government was fairly clear they didn’t support retaliation), we weren’t likely to be facing higher prices (if anything lower, if large scale trade diversion happened), and while uncertainty can be a killer for investment projects few/none will turn on a dime (in terms of actual real outlays) anything like that quickly. None of which is to say that Trumpian tariffs are anything but bad for the world, and us (and I’ve consistently agreed with the RB view that they are, if anything, a negative aggregate demand shock from the rest of the world to us).
And if there was a material tariffs-uncertainty effect on New Zealand in Q2, surely we’d expect to have seen such an effect across many other countries, and showing up to a greater extent in many of those countries (in April appearing to face much higher tariffs or more dependent on US markets – remember (my post yesterday) we don’t export much by advanced country standards)?
What then do the data show (bearing in mind that all recent data are prone to revisions)? The OECD has a database of quarterly real GDP growth for member countries. Here is how quarterly real GDP growth in Q2 compared with that in Q1 (I’ve left off the US itself – source of the issue – and Ireland where tax effects mean quarterly growth rates are all over the place.)
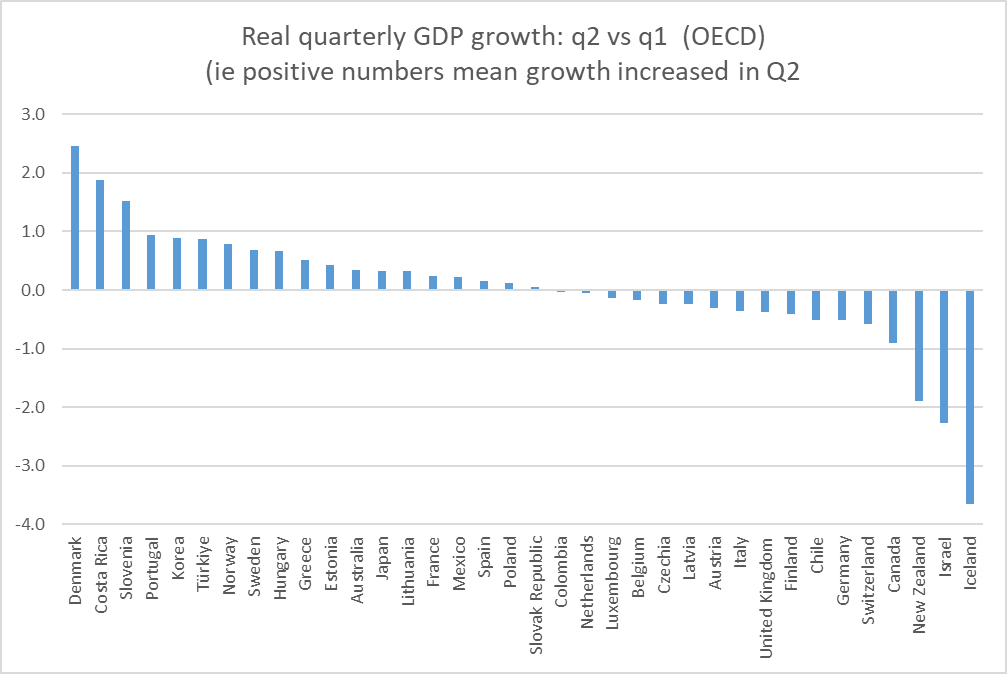
There is no consistent pattern, but actually slightly more countries saw higher growth (often only slightly) in Q2 than in Q1.
And here is another chart, this time comparing Q2 growth with the average growth rate for each countries over the previous four quarters. Still no consistent pattern (although this time slightly more countries had lower growth than higher growth).
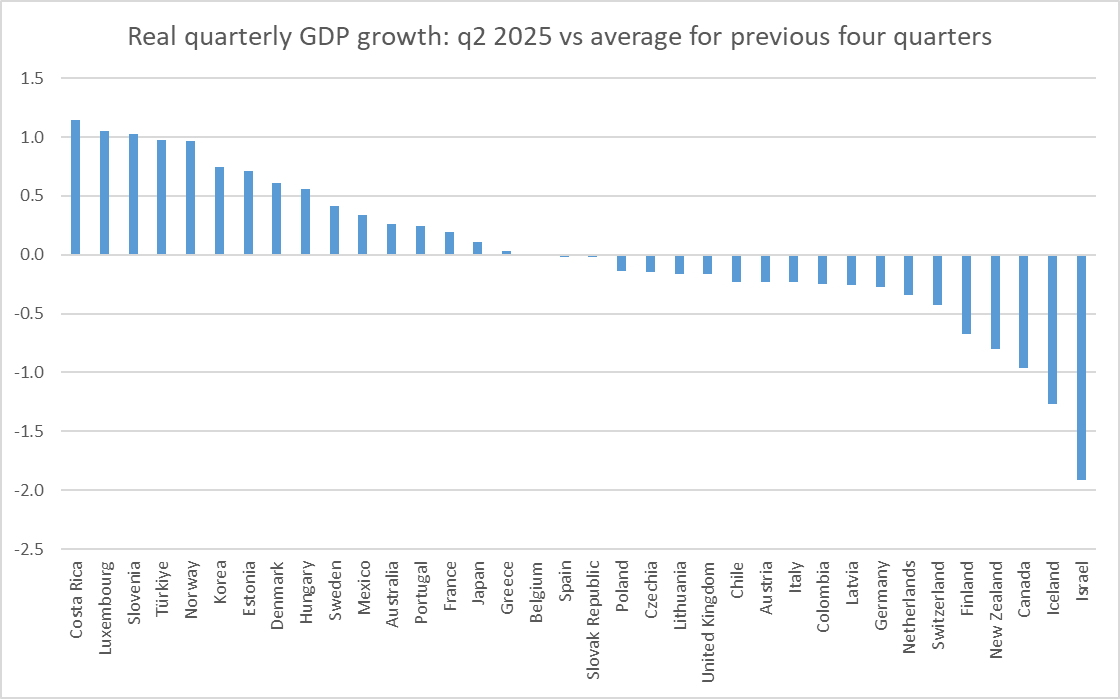
They are the sort of charts you might have thought the MPC would think to stick in the MPS. It may be – well, it is to me – a little surprising that global economic activity has held up as well as it seems to have this year in the wake of the tariff uncertainty, but…..for now, that is where the data seem to point. Perhaps effects begin to cumulate from here, but whether that happens or not, it is just hard to see much sign of Q2 New Zealand growth having been materially adversely affected. If the departing temporary Governor agrees, so much the better.
Since I was putting together this post I will add in here, as much for ease of future reference as anything, a few charts I put on Twitter yesterday, mostly going to one of my multi-decade hobbyhorses (dating back to 1997) of doubts about the merits, and value, of central banks publishing forward interest rate forecast tracks (not many do still).
This chart shows the Reserve Bank’s OCR projections through successive MPSs since late 2020.

They really had no idea what was going to be required. To be clear, I am not here bagging the RB MPC specifically (I’m pretty sure similar charts from the other central banks that publish endogenous forward tracks would look much the same). It is an observation about the (very limited) state of knowledge any and all central banks (and outside commentators) have, especially when anything interesting is going on with inflation.
To illustrate the point with just one date, here are the MPC’s successive forecasts for the OCR in the final quarter of this year (daily average).
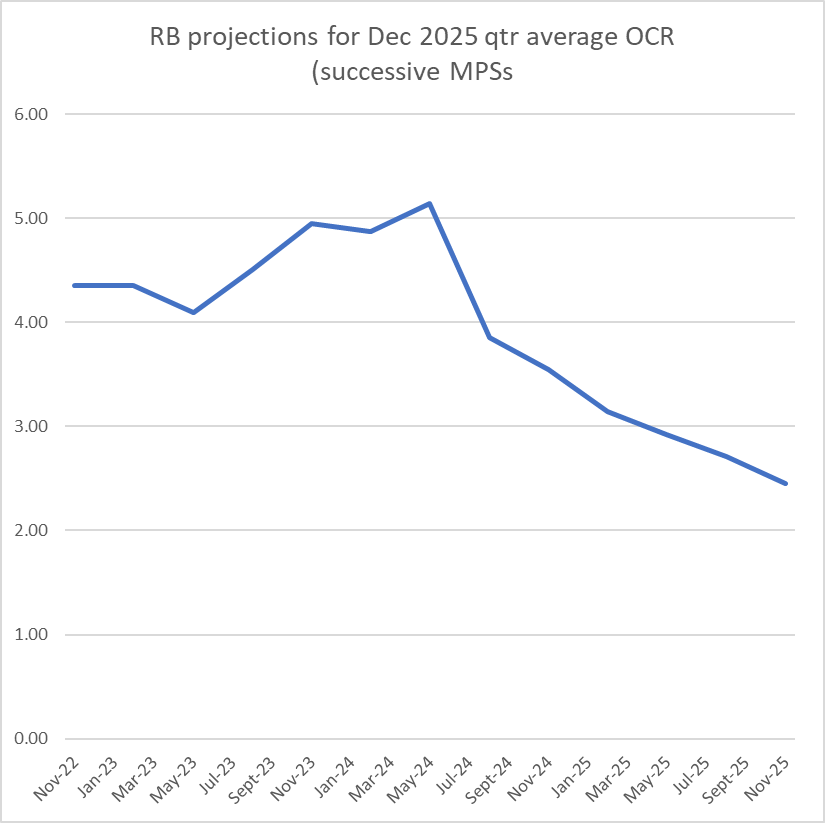
18 months ago they thought the OCR – which they set – would be around 5 per cent by now. Yesterday they actually set that rate at 2.25 per cent (and I could show you similar charts for various market economists, so again this is not about bagging our specific group of MPC members). Sometimes of course really nasty exogenous shocks happen: it would be unfair to look at MPC forecasts from early 2019 and compare them with what happened in 2020, since Covid was essentially unforeseeable (for central bankers in particular). But nothing very dramatic has happened in or to New Zealand in the last eighteen months. The Bank simply misread how much pressure would be needed to get core inflation near target.
You can also see that with this chart, showing the Bank’s successive estimates of how much excess capacity was going to be needed at peak to get inflation down. In the scheme of things – data uncertainty, revisions etc etc – those estimates have really been quite stable.
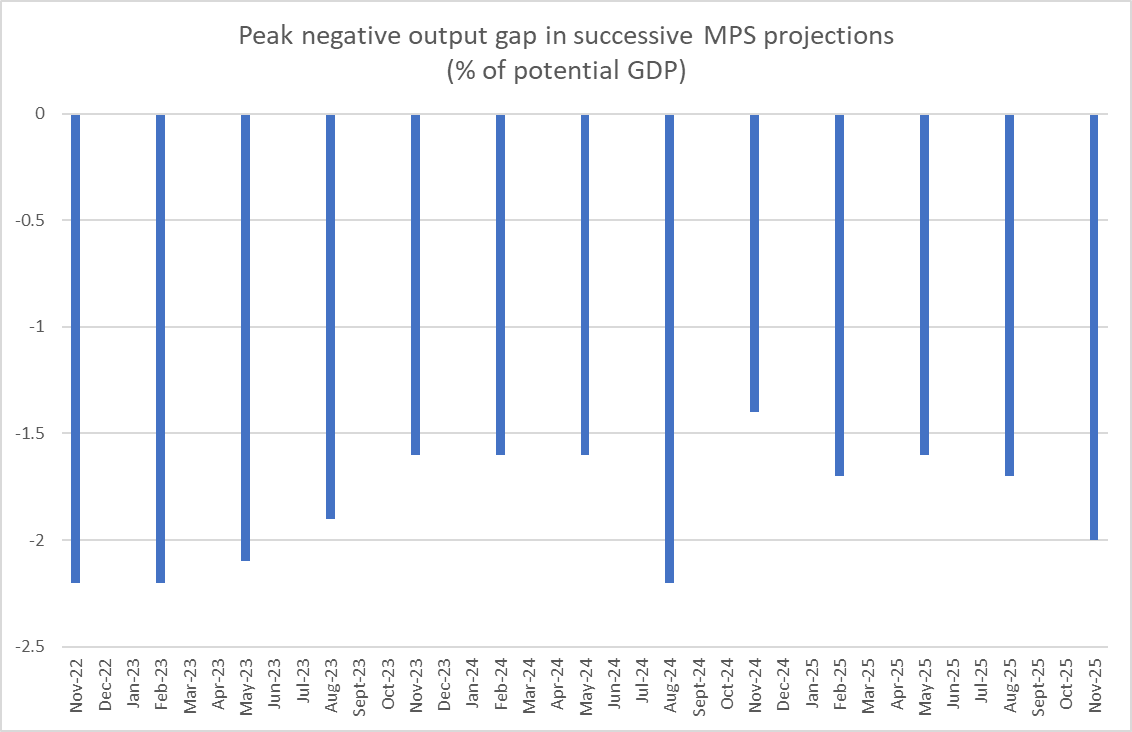
But – see the earlier charts – they had no real idea what monetary policy settings would be required to deliver.
As I noted in my post last week on the new Governor, she has talked about improving transparency, and if the Bank follows through then that would be a good thing. But there is distinction between things you can be transparent about – the views, arguments, votes etc in any particular meeting – and things where you can certainly publish numbers but really there isn’t much value at all. Now, to be clear, market economists pay attention to those future tracks because the MPC produces them, and – if things are anything like what they were in my day – large amounts of time and effort goes into producing them (precisely because the MPC will know markets look at the track because the RB publishes it). But there is no substantive value at all – the MPC just does not have any decent idea what will be required 12-24 months ahead. Often enough – as we’ve seen this year again – they often don’t have a reliable or consistent view on the next quarter. Much better to focus energies on this quarter and next, recognising that almost all the information new to the Committee each time it meets is about the (quite uncertain enough) recent past with just a few pointers to the very near-future. You need mental models to think about medium-term implications etc, and perhaps formal ones for research purposes, policy scenarios etc but….forecasting really is a mug’s game, and in a central bank context the medium-term forecasts, notably for the OCR, add very little value.
And I can’t face writing anything much about this morning’s dismal announcement from the Minister of Finance. When expectations are low, she still undershoots.

This Westpac commentary on the June quarter 2025 real GDP decline is likely relevant. Economic-Data_291025-GDP-adjustments_bulletin_29Oct25.pdf I have not had time to fully get to grips with it. Really need to get a viewpoint from SNZ.
The RB published a contribution in April 2025 on sources of forecasting errors relating to monetary policy here https://www.rbnz.govt.nz/-/media/project/sites/rbnz/files/publications/bulletins/2025/forecasting-and-monetary-policy-communication-in-new-zealand_april-2025.pdf
“Nowcasting harnesses a broad range of models to transform timely and/or high-frequency data into estimates of lagged economic indicators. These statistical models take in more timely data sources, such as business surveys, traffic movements, consumer spending, and other real-time indicators, and use them to predict outcomes like quarterly GDP growth. This strategy not only provides a more immediate snapshot of the economy but also allows policymakers and analysts to react more swiftly to economic changes. The use of timely data and statistical models to nowcast key macroeconomic variables has been a core part of the Reserve Bank’s forecasting framework for several decades.”
I need to search for literature on to what degree “nowcasting” has been found to improve forecasting accuracy.
LikeLike
Yes, certainly agree it is relevant altho I suspect everyone (other than purely political people) is now working on the view that real Q2 was negative just nowhere near as negative as the published number.
LikeLike
Yippee. Fresh off re-appointing Neil Quigley to RBNZ Chair who subsequently resigned in disgrace, and Coster as CEO of her Social Investment Agency, who’s now in limbo limbo land, the financial genius & architect of stagnation, Nic Willis puts an accountant as RBNZ Chair & ploughs yet another never-heard-of-her non-economist onto the Board. Chumocracy rules in NZ. Go for it Nic. It’s end of term and I will be telling every one of my students – leave this inbred banana republic & go overseas. I’m writing their references as we speak.
LikeLiked by 1 person
Their appointments, across so many roles/agencies, have been just depressingly awful.
LikeLike
On monetary policy Michael, let us rejoice. Hallelujah. Lux & Wills have got their way. Just as Orr wanted to engineer a bust, Punch and Judy are determined to engineer an election year boom, courtesy of monetary policy, just like in the finest tradition of Piggy Muldoon before them. Real interest rates are now close to -1 per cent in NZ (inflation around 3 percent and OCR close to 2.per cent) and we have had a hugely depreciating currency against the Aussie. Who cares should inflation go higher? Punch and Judy need that boom for their polling, even though the law says its a single mandate. Punch and Judy say the economy is already firing up. Well, a firing up economy and negative real rates means we’re fully on board for more boom bust. Good one Punch. Good one Judy. You’re so good at economics.
LikeLike
I’m not as convinced that the falling OCR is going to deliver the long-awaited recovery. Existing private sector debt is very high already and unemployment is still rising. The other big hand break is a deflating housing market – this is where most of NZ’s credit growth happens. There will likely be ongoing tight fiscal policy which will lead to a repeat of 2025 in 2026.
LikeLike
Just like your chart of OCR, the “outcome” the RBNZ inflation forecast, always heads back to the mid-point, just follows the same pattern as the OCR forecasts in that each update moves the path forward, before they either over or undershoot.
To me it says that their forecasting ability is woeful, and they are really responding to the “latest” information rather than any really attempts.
The “claim” that it is tariff etc related to me smacks of an AI search of what everyone else is saying.
LikeLike
When I was integrally involved in our mon pol setting I pointed out repeatedly that almost everything useful about what we were doing was, almost necessarily, just a reflection of “looking out the window” – the latest news, data, straws in the wind etc.
LikeLike
Good article. The total over estimation of NZ’s economic performance and consequent dramatic fall in the OCR have both been remarkable to watch. I think you can safely take the RBNZ and all other bank forecasts and shave off 0.5% to 1.0% and you’ll be on the money. That’s been my observation, and I think it still holds going forward.
LikeLike
Thanks for the charts Michael
However you look at it, we’re not performing well….
LikeLike
Michael
You note the output gap and hence potential for non-inflationary growth
But am I correct to see restraint on that growth to be a function of “animal spirits”. Government spending continues to be stimulatory. Ditto exports and imports. Businesses report optimism and are apparently investing. Which leaves household consumption as the presumed laggard.
I noted that NZ resident holdings of unit trusts (including Kiwisaver) rose $40B over the last year which is almost 10% of GDP.
From this I’d infer that the sluggish GDP is largely due to restrained household consumption and this in turn is more reflective of that sector’s preference to improve its balance sheet rather than the pop explanation “cost of living”?
Tim
LikeLike
interesting angle. On a very quick look, household consumption is v similar, as % of gdp, as it was just prior to Covid. Govt consumption spending is about 3 percentage points of Gdp higher than it was then.
Overall investment (business and housebuilding) is still v weak.
On the unit trust numbers, my guess is that a significant portion of the increase will be valuation effects (notably US equities, but possibly some currency depreciation effects too)
LikeLike