I put a range of charts on Twitter late last week illustrating why, from a macroeconomic perspective, I found the government’s Budget deeply underwhelming. I won’t repeat them but will just show two here.
The first is the Treasury’s estimate of how the bit of the operating deficit not explained just by swings in the economic cycle change from 2023/24 (which was largely determined by last year’s Labour Budget) to 2024/25 (influenced by this year’s Budget choices)

On both these Treasury metrics, things are expected to be a bit worse in 2024/25 than in 2023/24. Not a lot necessarily, but things are heading in the wrong direction: a larger share of the groceries are being paid for by borrowing. And, sure, the projections have the deficits eventually tailing off and returning to surplus eventually – as they have for each of the last few years – but those numbers rely on more fiscal drag and rather arbitrary indications of what future Budget operating allowances might be. Perhaps they will deliver, or perhaps not. We don’t know and neither really do they. At this stage, anything beyond 24/25 is little than aspirational vapourware.
And consistent with that, the Treasury’s fiscal impulse measure – designed to measure the overall of fiscal activity on aggregate demand (with the central bank in mind) – is just slightly positive. Fiscal choices for the coming year aren’t estimated to ease pressure on demand and interest rates at all.

When the starting point is quite a large structural deficit, that seems, shall we say, less than ideal. Perhaps the more so when history (and common logic) suggests that the first year of a new government is usually by far the best time for a government to make tough fiscal choices and adjustments. (I dug out some old Reserve Bank estimates the other day and way back in 1976, the first Budget of that new government had a fiscal impulse of around -6 per cent of GDP. Muldoon had inherited a bigger mess than Luxon/Willis did, but…..a deficit is a deficit, and inflation and interest rates have been a problem.) If the 24/25 Budget wasn’t the year for hard choices, which one will be?
But for this post, I was more interested in comparing some of the Treasury macroeconomic forecasts in the Budget documents with those published by the Reserve Bank the previous week. Here I should stress an important difference: the Treasury economic forecasts were finished on 5 April and the Bank’s weren’t finished until a few days prior to the MPS. But my impression is that there wasn’t much in the way of crucial or very surprising domestic economic data in that period.
First, compare the outlooks for real GDP per person of working age (the RB doesn’t publish per capita projections, so this is the basis on which we can do a comparison).
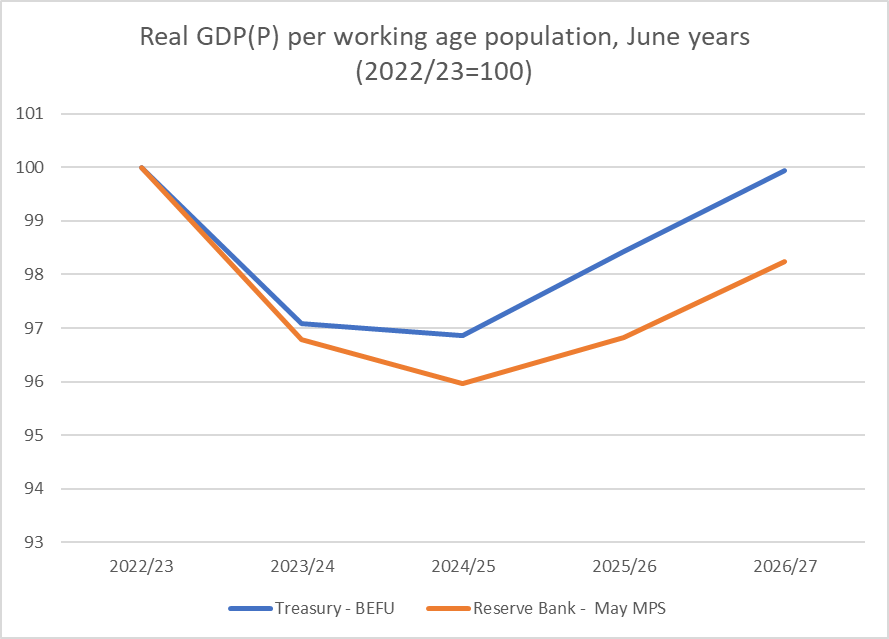
Neither line represents a particularly rosy outlook. Even Treasury has us just barely back to the 22/23 level of GDP per working age population by 2026/27, but over that full period the difference between the two sets of forecasts builds to something quite substantial (a gap of 1.7 percentage points by 2026/27).
After the MPS I wrote here about how there seemed to be nothing robust behind the recovery the Reserve Bank was forecasting for next year (given that interest rates stayed high, lags were long, net immigration was declining etc), but I think one important difference between the two sets of forecasts is nearer in time.

There are really striking differences in how The Treasury and the Reserve Bank see excess demand having evolved over the last couple of years. Output gaps aren’t directly observable, but the most recent hard GDP data is still for December last year, but whether for that quarter or the estimate for the March quarter the difference in the two estimates is almost 1 per cent of GDP. On the Treasury numbers there was a significant negative output gap – posing a powerful drag on inflation all else equal – while the Reserve Bank reckons that output gap was only around zero.
Perhaps Treasury would have revised their thinking after the CPI if they’d had been able to incorporate those numbers in their forecasts, but there is nothing in the BEFU document that seems to suggest so.
If inflation has been a problem and you think that the economy has recently been only at around capacity then it isn’t too surprising that you have rather weak real GDP forecasts for the period ahead (especially the coming year). Both agencies build their forecasts around inflation eventually getting back to target midpoint; the difference is about what doing that will take.

The Reserve Bank reckons the OCR next June quarter will no lower than it is now, and may have gone higher in the interim. The Treasury forecasts the 90 day bank bill rate, and they reckon that will already be a lot lower (4.5 per cent) by next June. Quite who is closer to right (or least wrong) will matter.
As I say, perhaps the difference mostly come down to timing – the Reserve Bank had the CPI and Treasury did not – but frankly it seems too large a difference to be explained by a single inflation number.
One uncertainty is quite how fiscal policy affects the Bank’s picture. As they noted, their numbers didn’t include the Budget numbers themselves, but Westpac has noted – presumably from something the Bank has said – that the MPC had been briefed on the broad direction of fiscal policy (as you would hope, since it is one of the reasons for having the Secretary to the Treasury as a non-voting ex officio member of the MPC), and speculated that perhaps the Bank’s hawkish tone might have been explained in some sense by that understanding of the fiscals. I’m not sure what to make of that, and after all, the Bank’s chief economist was then at pains to play down the apparent hawkishness in the days following the MPS, with his weird line that somehow it was all just “model output”. More generally, the Bank has been taking a weird approach to fiscal policy over the last year, since that awkward 2023 expansionary Budget, ignoring conventional conceptions of the fiscal impulse and trying to focus attention on real government consumption and investment (in turn very different from either total government spending or a deficit/surplus measure). But for what it is worth, as the chart above shows the fiscal impulse for 2024/25 is estimated to be very slightly positive, and at the time of the HYEFU it had been estimated to be about -2.5 percentage points negative.
At very least, whatever was in the Budget simply wasn’t any help in easing pressure on demand and interest rates. Quite where too from here is going to depend a lot on just how much disinflationary pressure was already building up in the system from a now fairly prolonged period of contractionary interest rates. Given how weak last year was, and how weak things like business surveys still are, my sense would be quite a lot. But time will tell.

There’s been a lot of weird data published over the past few years. One thing im currently struggling with is that the government is saying that their budget is austere and they’re laying people off, meanwhile the tax payers union is saying that the spend in this budget is greater than the year before. Contrary to the tax payers union, Spark is forecasting lower spend on projects from the government in their last results forecast.
if they’re spending more, but not on people or projects, then what? Who is to be trusted because things don’t seem to add up?
LikeLike