In my post last week on The Treasury’s recent note on productivity, I highlighted that the weak labour productivity growth evident in New Zealand over the last decade wasn’t something we’d shared with the OECD countries that were around our level of average productivity. This chart was from that post.
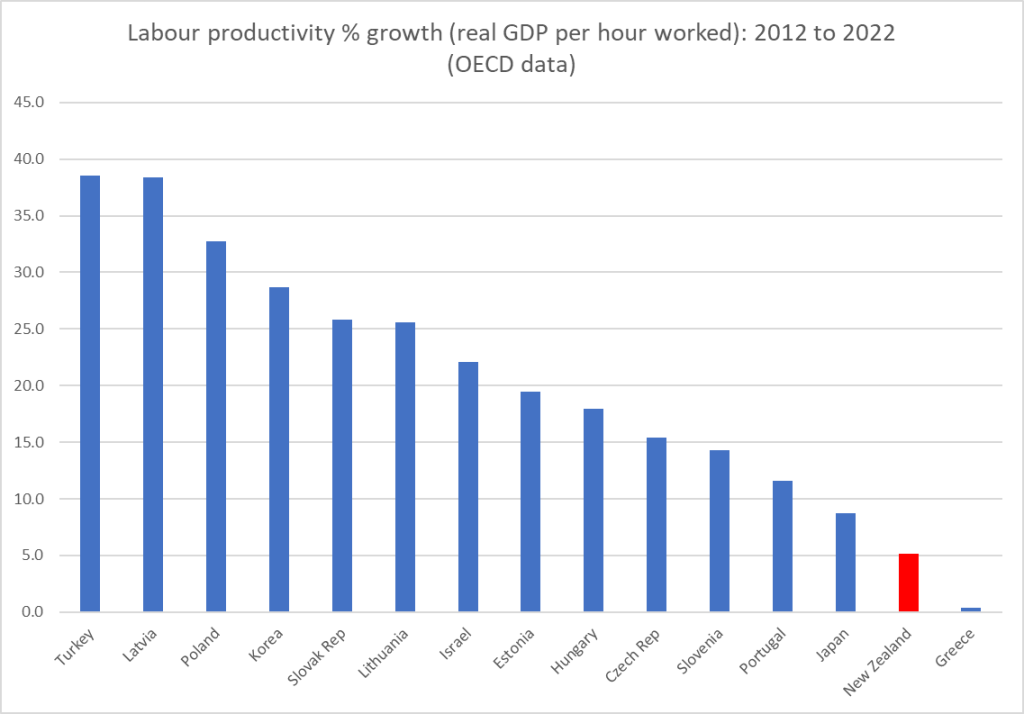
But as I also noted, it might have been worth Treasury having a look at Australia and Canada (richer and more productive than us, but with some important structural similarities, and neither in recent decades having been productivity growth star performers).
For many countries it is quite difficult to get whole-economy quarterly labour productivity data. But Australia, Canada and the UK publish such series, and I’ve done so for New Zealand (using the average of the two real GDP series and HLFS hours data). The data are all available to 2023Q4, although in all cases no doubt with the caveat of being subject to revision as fuller data emerge for the most recent periods.
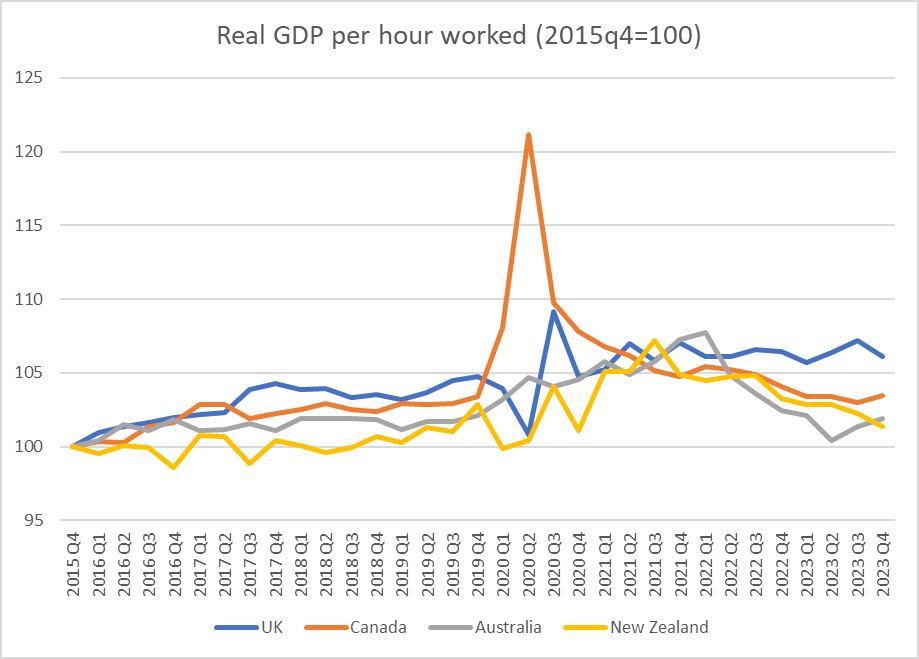
First, a quick quiz. Which of the four Anglo countries do you think is which in this chart (I went back to end of 2015 to start from before the Brexit referendum)? Note that none of the lockdown period numbers are likely to be very reliable, and may just reflect differing assumptions the various statistical agencies made. But in all four countries, lockdowns are now well in the past.
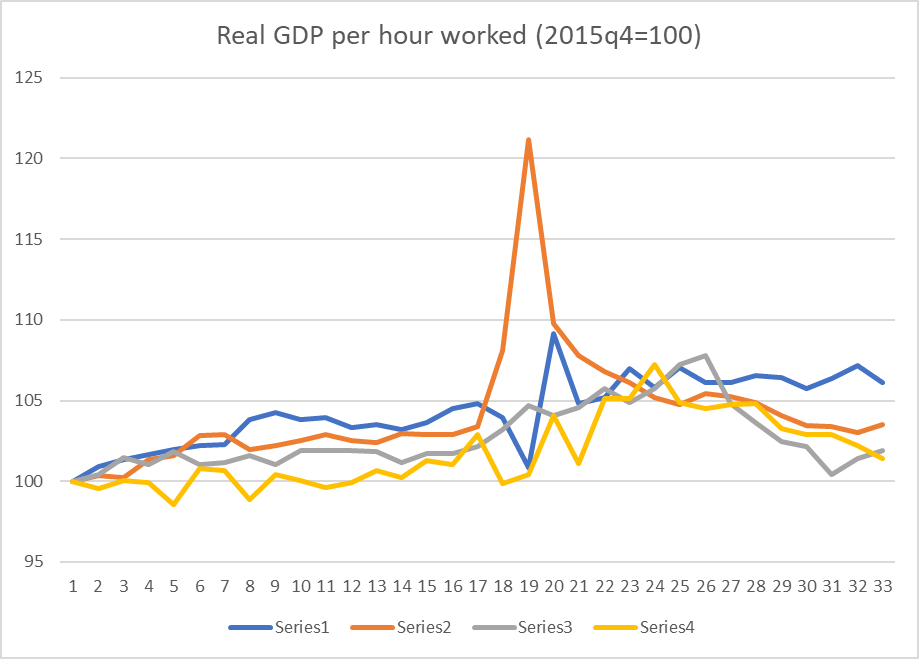
The answer? And somewhat to my surprise…..best of a poorly performing bunch of countries over this eight year period was the UK, Brexit and all.
And how about the period since just prior to Covid (there is some noise in the quarterly data so I’ve used the 2019 average as the base)?

I’d usually highlight New Zealand in a different colour, but….it is hard to highlight (exceedingly close to) zero.
Given the potential for revisions I wouldn’t put much weight on it, but……for what the data are worth…..there is no reason to doubt that the recent productivity performances of New Zealand, Australia, and Canada have been rather similarly poor, and especially so since Covid.
It is worth making these comparisons for various reasons, but including because it is all too easy for partisans to highlight their own country’s experience, blaming everything on the rhetorical predilections and headline choices of whoever happens to have held office in this period. Over the full Covid period (in the chart just above), we had a Labour government, Canada had a government that seemed similarly “left wing”, but then for much of the period Australia had a centre-right Coalition government, and the UK…. has had the Tories (who sometimes appeared very similar to Ardern, but are notionally at least of the centre-right).
But lest you are tempted again by thought that everyone is just as bad as each other and global forces mean productivity growth was just impossible over this period, consider the US

They don’t produce whole-economy real GDP per hour worked data, and you’d expect the business sector to do better than the economy as a whole (ie including government). But I had look at how large the differences might be (using the annual US GDP per hour worked estimates from the OECD) and it is pretty clear that the US economy as a whole – an economy very much closer to the productivity frontier – has managed materially faster labour productivity growth over recent years than the 4 Anglos focused on in this post.
Countries can still manage robust productivity growth. Perhaps especially countries that are well behind the productivity frontier (see first chart in this post), but….apparently not with the policy mixes of the New Zealand, Australian, and Canadian governments.

3 countries are largely extractive industry based (AU and Can minerals and mining, NZ land- based production)… isn’t that the answer? If you are in low productivity industries dominated by commodity returns rather than ingenuity industries how can it be any different?
PC
LikeLike
Key element in my story, altho note that those extractive industries in Aus and Can typically have high labour productivity (capital intensive). It can’t be the whole story tho, both because it doesn’t immediately explain why the extreme slowdown in productivity growth in just the last few years. And of course there have been natural resource based economies before – Denmark is an oft-quoted example, but just before WW1 the UK was the world’s biggest energy exporter (coal). My longer-term story emphasises a natural resource dependence, which decades on shows no sign of changing, combined with all 3 countries running large scale non-citizen immigration policies, in effect spreading the natural resource more thinly, and making it harder for more outward-oriented non-natural resource industries to develop. I find Canada an interesting, puzzling, story. In NZ and Aus case distance is a real obstacle, but eg the biggest centre of urban econ activity (Toronto) is a bit closer to New York than Wgtn is to Auckland.
LikeLike
Does adding to the population without restraint help or hinder?
LikeLike
Hinder, whether in Australia, Canada or NZ (all 3 now have fairly similar big-immigration programmes)
LikeLike
I am increasingly wondering how good these numbers are in the scheme of things. They measure what goes on in the old “market economy” but I don’t think they pick up much of the online activity. The statisticians know that I updated my phone recently, and they know what I pay my ISP. But they have no idea (I hope!) what I actually do online, which is a lot. And the growth of the productivity of our devices and the software/apps that run on them has been substantial. (The harm done has also been substantial). While I am talking personally, businesses will be having the same experiences. I am left at a bit of a loss as to hoe to measure …. whatever it is we want to measure
LikeLike
Hi Peter
I guess at very least there is some comfort in the fact that national statistical agencies use v similar methods to calculate real GDP, so cross-country comparisons are still likely to offer something useful. On your tech point, there is now quite an extensive literature attempting to assess the empirical significance of the point (can hard to measure tech issues explained measured productivity slowdowns?) and as I understand it the predominant finding is that any effects are (in the aggregate) less than they might seem.
LikeLike