Every three months or so the hard copy Herald comes with a hefty supplement, the OneRoof Property Report. Yesterday was the latest such supplement. I skip straight to the detailed tables at the back which report, at suburb and district council level, the numbers from the OneRoof-Valocity House Value Index. It is a measure of average (not median) prices, draws on “a range of sources, including settled sales data” and is described as “based on a composite of statistical models and are fully stratified”. The numbers are up to the end of October.
What caught my eye when flicking through the tables was that they had not just percentage changes for the most recent quarter and year, but also enabled comparisons to pre-Covid levels and to the Covid-era peaks.
First, a reminder of that extraordinary period (mostly in late 2020 and 2021) when house prices rose sharply almost everywhere. Since I was having to do all these percentage changes manually I mostly only did the larger population places.
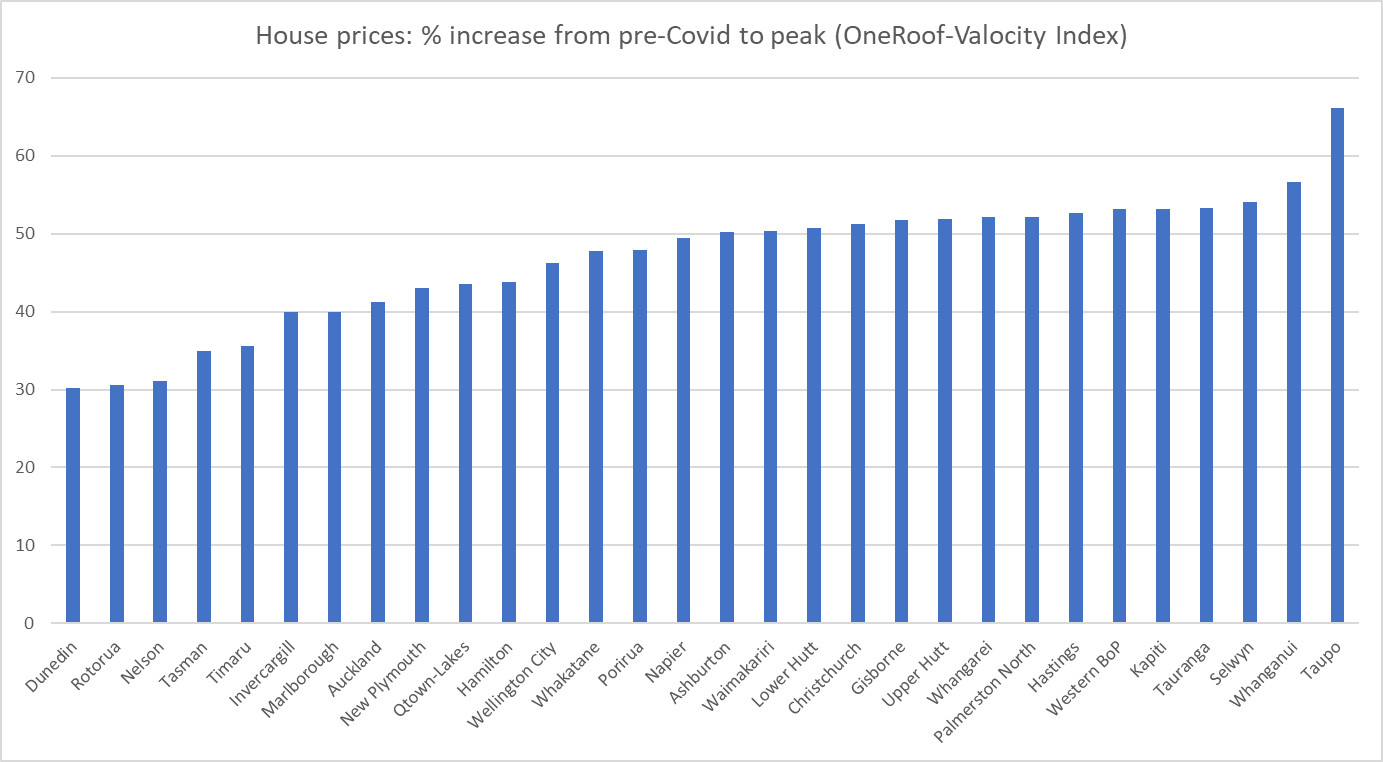
They really were staggering changes. There are a few surprises – I’m at a loss to know why the increase in average prices was materially larger in Taupo than anywhere else – but it is probably more striking just how consistently huge the price increases were, between 40 and 55 per cent, often in little more than a year.
Prices have generally fallen back from those peaks (except in Timaru where the latest observation is also the peak).
But what I was more interested in was where prices were now in real (inflation-adjusted) terms relative to those just prior to Covid. That’s this chart (with the Wellington districts highlighted in red, the Christchurch ones in green, and the mega-region Auckland shown in yellow).
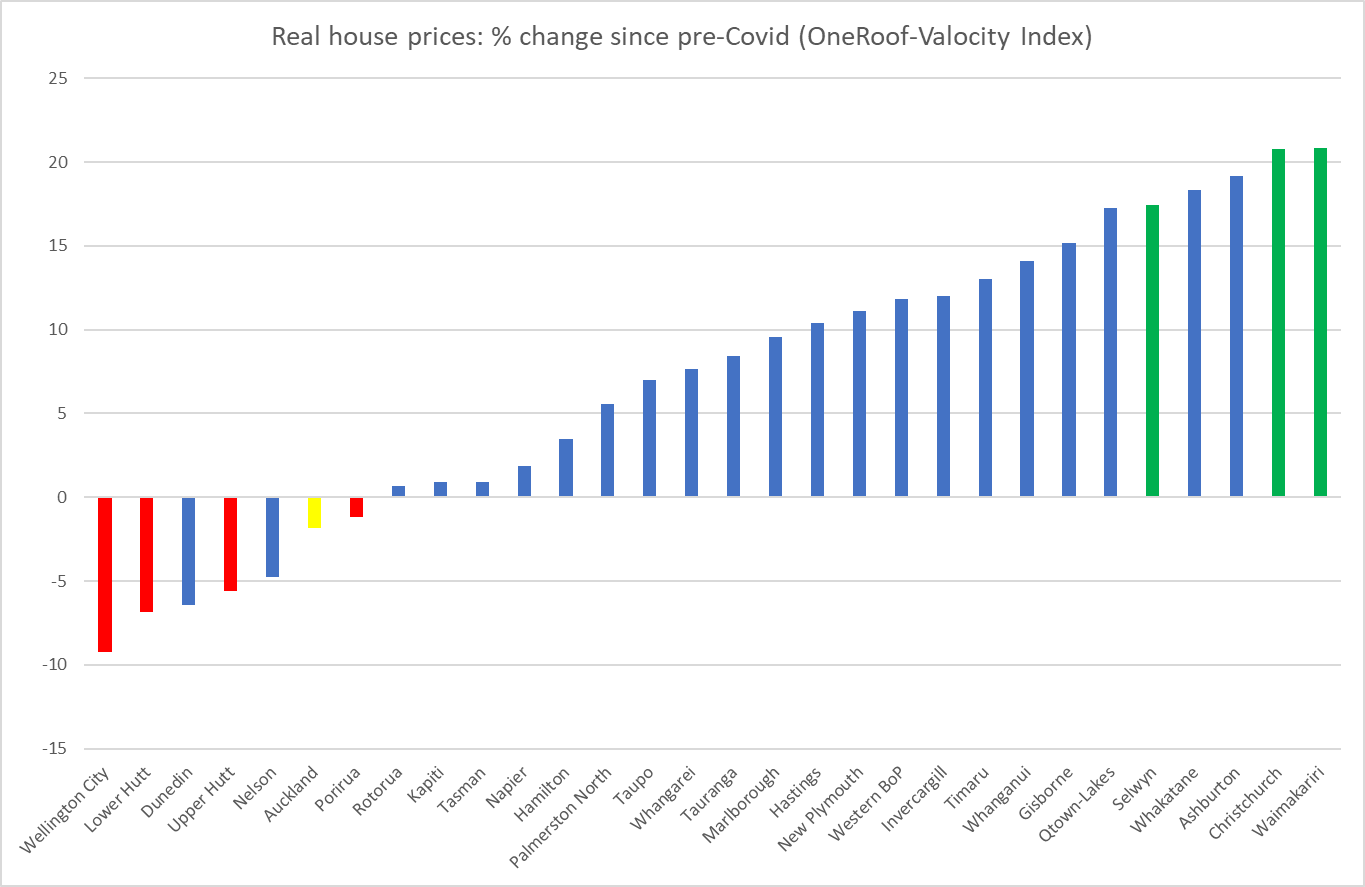
There are really big differences across towns and cities in just a (bit under) four-year period, and no particular bunching around some typical rate of increase (decrease), even bearing in mind that a third of the population is in Auckland.
The dominant story of the 2020/21 increase in house prices seemed to be the toxic combination of extremely low interest rates in a fully-employed and overheating economy in the presence of supply constraints on bringing new residential land and houses to market (all despite an unexpected negative population shock). That story makes a lot of sense, including in the contrast to the 2008/09 recession when much larger cuts in interest rates went hand in hand with lower nominal house prices (there were big negative output and unemployment gaps opening up then).
But as we emerge through the other side of the entire Covid period, it is less clear what explains the divergent pattern of real house price changes over the full period. A non-trivial part of any story about the overall market must be interest rates – the OCR was 1 per cent just prior to Covid and is 5.5 per cent now (with implications for all the retail rates) – but we have an integrated financial market and thus the same interest rates (and tax rates for that matter) in Wellington as in Christchurch.
Supporters of the incoming government might note that Wellington house prices have fallen most in real terms and point out that the prospects of reduced public service numbers might be playing a part. Except that over most of four years public service numbers were rising, often quite strongly, and over the latest three months, when a victory for a National-led government came to seem much more certain, Wellington house prices haven’t done anything materially different than those in Auckland (both up a couple of per cent).
Models which emphasise the importance of supply constraints, land-use restrictions etc (models I champion) suggest that for any given state of economic activity and resource pressure, one should expect to see more responsiveness of house prices to interest rate changes the more binding the supply constraints are. It is an appealing story for Wellington (especially Wellington city) – interest rates have risen a long way- but whether it is really the main explanation would take much more systematic analysis (including trying to take account of the bipartisan limited land use reform legislative change in 2021, and expectations that a new government will alter those measures). But it is hardly as if Christchurch is some paragon of liberal land use.
Perhaps too there is some convergence at work. After all, even now Christchurch house prices are far below those in Auckland, and non-trivially lower than those in Wellington, and people are potentially mobile within New Zealand, especially when the labour market is buoyant.
I don’t purport to have a fully convincing story. The point of the post was mostly just to put the chart out there. And to note that despite the large and rapid increase in interest rates (nominal, but increasingly real too, going by any plausible measure of inflation expectations) real house prices in most of the country are at best basically unchanged from the end of 2019 (in Auckland’s case) or are materially higher than they were then.

It would be good to see the difference in sales numbers over that time of apartments, townhouses, and free-standing dwellings and how the change in number and the value of each group affects the average.
Also the sales to foreign vs internal movement from say overseas purchaser buying into Auckland and the Auckland selling and then buying and moving to Christchurch.
LikeLiked by 1 person
Yes, would be great to have that wider range of data. Since they claim their index is stratified you’d hope the apartment vs townhouse vs detached house wouldn’t affect things.
LikeLike
What you might want to look at as well is the timing of re-valuations in the city/districts studied. My anecdotal impression is that those areas re-valued at, or just before the peak of market prices (Nov 2021 was the peak I believe) had a new ‘floor’ of expectations set by sellers and subsequent sales achieved built on that (i.e., growing to the eventual peak). Those city/district markets re-valued either well before, and/or after the peak have behaved differently. So, your odd effect may be a combination of both interest rate movements and the timing of re-valuations.
In the ‘old’ days, every bank required a professional valuation of each individual property prior to lending. Now, it seems banks just ‘go on’ the rates valuations – which just ‘go on’ recent past sales in the area. Very unfortunate/poor practice, I think.
LikeLike
interesting possibility altho the Wgtn city RVs are from sept 21 so v near the peak
LikeLike
I’ll have some wild guesses about what is happening.
1. Perhaps relatively expensive properties have fallen by a bigger percentage than cheaper properties.
(a) Pricing for the latter (affordable end of market) tends to be held up by higher rental yields.
(b) For cheap regional properties, a higher percentage build cost compared to market value means that supply is more constrained.
(c) Interest rates rises have a bigger impact on large mortgages, which are in the main centres, for pricier properties.
These theories if true means that the less affordable main centre properties will fall faster than the more affordable regions. Christchurch is the exception, because it was always more affordable than Auckland and Wellington anyway.
2. The atrocious under-performance of Wellington could be partially a consequence of the neo-Marxist Council there. I think potential rate rises effect market sentiment, and therefore property pricing. Also job losses may be coming soon.
I could, of course, be wrong about all of this.
LikeLike
On your 1, note that they claim their indices are stratified so that shouldn’t be the explanation,
LikeLike
Their data at first glance seems to show that house prices in relatively affordable housing (eg. the regions) is less interest rate sensitive than the unaffordable (high income to house price multiple) markets such as Wgtn / Auckland when interest rates were ramped up. However, I don’t understand how their index stratification works, because I was asleep all those years ago in econometrics classes. I’ll have to accept that my theory is likely wrong…
LikeLike
Auckland nominal prices rising 40% over the same time frame as real prices dropping by 2.5% implies 40% CPI inflation over the last 4 years. I simply don’t believe it. Can you expand on the basis for the chart calculations.
LikeLike
I think a key thing to consider here is what the earthquake did to the bid-rent curve in Christchurch Michael. Christchurch CBD is still a shadow of it’s pre quake self.
In Alfonso’s standard model, prices are bid up from the each of the urban area to the centre (simplified). Except in Christchurch your centre is undesirable. Over time as the CBD is rebuilt this desire to locate there increases. Couple of key anchor projects came on during the 2020 – 2022 period, and others are getting closer (new stadium in 2025). Also covid perhaps spurred a bit more relocation than usual leading to a bit of catch-up there.
I’d expect over the long run for CHCH prices to converge back to ~same ratio relative to AKL and WLG pre-quake once CBD rebuild is completed (subject to the usual caveats)
LikeLike
Interesting argument re Chch. My own story for why price/income ratios in Chch are likely to converge to those of Wgtn, Hamilton and Akld in the longer run is that I see little reason to expect the city council there to do better in terms of land-use regulation than whatever happens in our other cities.
LikeLike
One of the interesting aspects of the Christchurch earthquakes is that it laid to rest the adage that a city center is the heart and soul of a city and without that, the whole city has no soul and will die.
It only took a few days/week for most businesses to relocate to other areas and carry on, in many cases more efficiently than before with people being able to, and doing the same work from home etc.
So it is interesting to watch the ‘push’ to recreate the city center, including have the Central and Local Govts. using all taxpayers’ money to subsidize people into it, as they would not go there otherwise.
I need to go very rarely into the Christchurch CBD, and try to avoid it where I can. But yes when I do I enjoy it for the entertainment, which in most cases is not exclusive but just different, and really has no more value than the entertainment you get from going to the circus every time it comes to town, if that’s what you are into.
LikeLiked by 1 person
I don’t understand why house prices are still a mystery. It reminds me of the search for cold fusion?
LikeLike