Yesterday morning I was skimming through the online database for the OECD’s recently-released latest Economic Outlook when I noticed that their table for the labour force participation rate was for ages 15-74. Often tables and charts for the “working age population” are done for ages 15-64 but as a growing proportion of those 65 and over have continued working the 15-64 numbers have become increasingly unrepresentative. So I downloaded the data and had a quick look, resulting in this tweet. (2019 because last year’s numbers were thrown around for every country and aren’t necessarily that representative.)
I was a little surprised – not that we were towards the right-hand end of the chart, but that New Zealand was now highest.
But there I might have left it, except that Stuff’s Susan Edmunds got in touch. We had a bit of a chat, and she produced this article. The headline suggests that high house prices might be the explanation (but as I’d noted to the journalist a variety of factors will have affected a range of different demographics).
It is worth stressing here that a high participation rate is neither good nor bad in its own right. It depends. I’m not in the labour force these days, and since I’m fine with that and I’m not a burden on the taxpayer it isn’t really a matter for anyone other than me and my family. My mother was in the labour force for perhaps only two or three years of the 60 years between her wedding and her death. On the other hand, if people are deterred from working by very high effective marginal tax rates or by “overly-generous” welfare provision or highly inflexible labour markets that might be more of an issue. And in wars, states sometimes compel people into the labour force – there might be reasons of state for that, but it is hardly a first-best state of affairs.
But I was still a bit puzzled so dug about a bit more data. First, this chart showing (since 1986 when our HLFS began) the 15-74 participation rate for New Zealand relative to (a) the median OECD country, and (b) the highest participation rate of any country in each year.

(Technical note: it is only since 2002 that there is complete data for all today’s OECD countries. Using a fixed sample of the countries for which there is data for the entire period takes out much of the dip in the median after 1990, but converges back to the orange line in the last half dozen years.)
So we now have the highest 15-74 participation rate of any OECD country, but that is quite a new thing. Over the entire period our participation rate has been at or above the median (which was probably my impression), but the closing of the gap is striking. Note that back in 1986, the universal age pension (NZS) was paid from age 60, so from that change alone it is not surprising that our participation rate is now materially higher than it was 35 years ago (in 1986 32 per cent of 60-64 year olds were in the labour force, while about 74 per cent are now).
But where does this highest participation rate show up once we dig a bit deeper, by age and by sex?
It turns out that it is nowhere in particular. For not one of the age/sex breakdowns I looked at did New Zealand score highest in 2019.
Here are the young people, aged 15-24
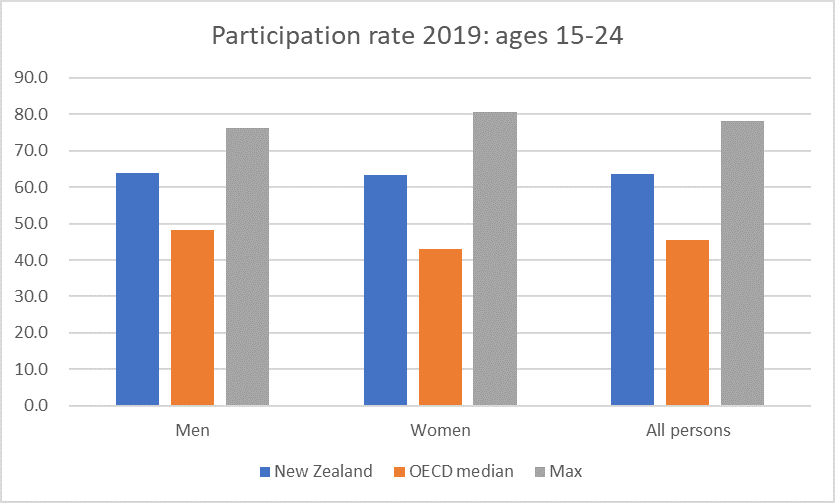
Well above the medians but also quite a bit below the highest participation rates, whether for men or women.
This chart, for what is often referred to as “prime [working] age” people (25-54) took me a bit by surprise.
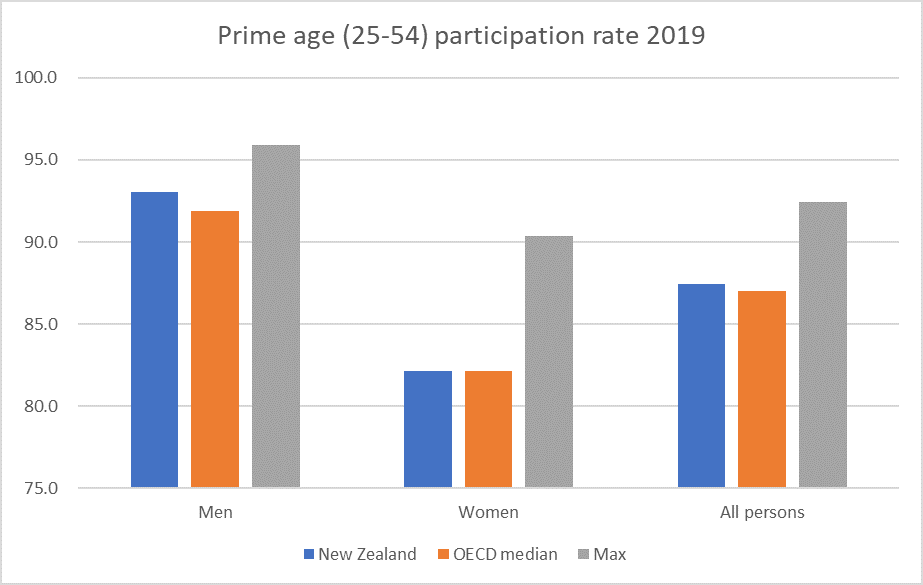
Not only are the New Zealand numbers not that near the maximum but for women of this age New Zealand was the median country in 2019. So much – it would appear – for the high house price story (at least as it is often applied, with both parents “having” to work even though they might prefer one to take more time out). Of course, house prices are high in some other OECD countries as well, but hardly any have quite the price/income ratios of New Zealand.
The next age group is the last before NZS eligibility now kicks in.
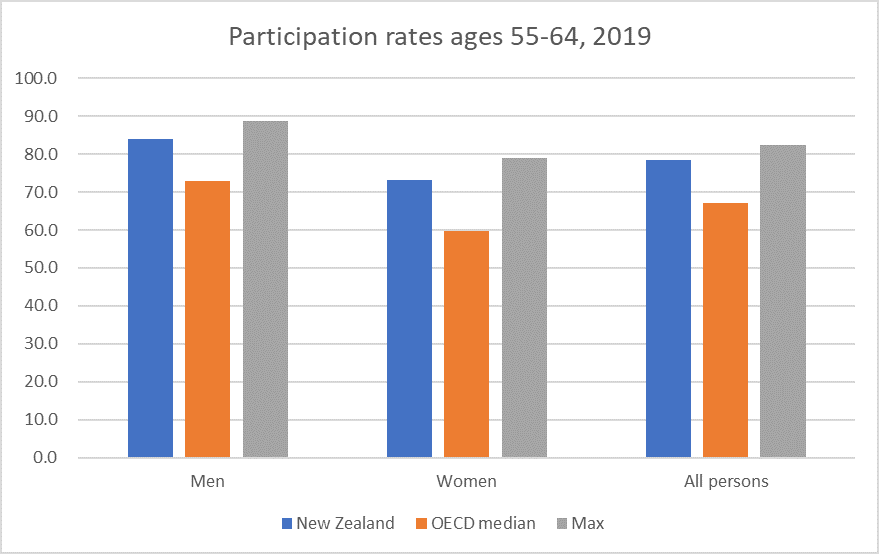
Here both male and female participation rates are well in excess of OECD medians, and not far off the highest rates (Japan for men, Sweden for women).
What about the 65-69 age group?
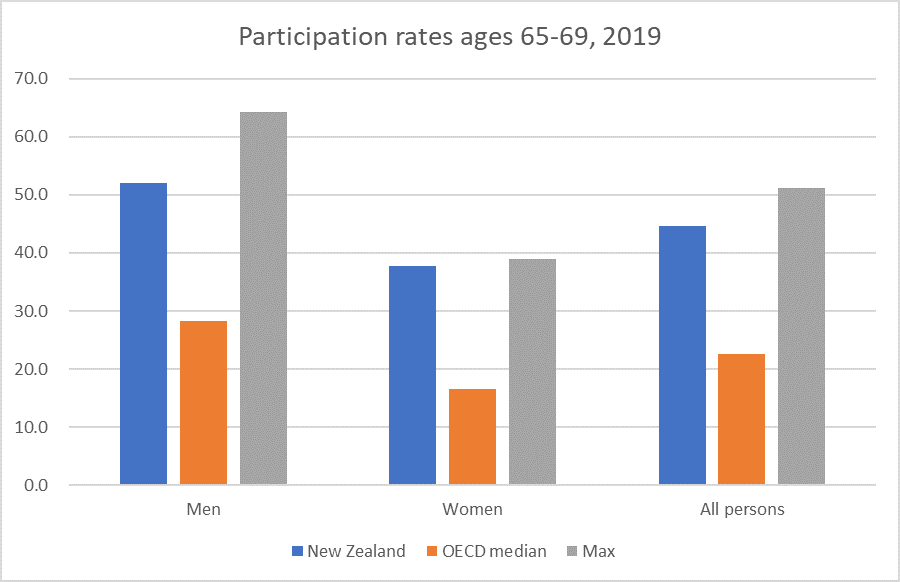
Again, well above the OECD medians for both men and women. but with a few countries higher than us especially for men.
And finally, the entire 65+ age group.

With much the same picture.
So standing back (and assuming the OECD did the 15-74 calculations correctly) we end up with the highest overall labour force participation rate for this working age band not by having spectacularly high participation rates for any particular age or sex sub-category, but from being well above the median in almost all categories, and at the median in a single sub-category (women 25-54).
(Note too that these are participation rates rather than employment rates – simply because that was the OECD table I started with – but note that New Zealand unemployment rates are typically below average among OECD countries.)
What should we take from all this? There are no doubt people who have dug into some of this stuff in more depth than I have here, but a few things strike me:
- There is no single cause, factor or policy that explains New Zealand’s current participation rate being the highest in the OECD,
- The high house price story seems unlikely to be that compelling, at least yet. For example, our working age participation rates are not particularly high (especially not for women), and today’s 65+ generation were already at least in their mid-30s 30 years ago (which is when real house prices really began to take off),
- Our NZS regime is relatively supportive to labour force participation (since there is no income-testing or abatement), but as other countries raise their state pension ages, the income effect will tend to dampen labour force participation here among the 65+ age group, relative to some other OECD countries,
- Much as I am not a fan of our high (absolute) rate of people receiving working age welfare benefits, or of the fact that our minimum wage is now high relative to median wages in New Zealand, it is only fair to note that our labour force participation rates are at or (mostly) above those in most OECD countries for every demographic shown here.
In the original tweet (above) I contrasted the high rate of labour force participation in New Zealand with the dreadful record on average labour productivity. In 2019 it would have taken a 68 per cent lift in average New Zealand real GDP per hour worked to have matched the leading bunch in the OECD (the US and some northern European countries). But by putting in more labour inputs (some mix of being employed and hours per job) we keep rather closer to the first world on average per capita incomes. The comparisons with the UK – not one of the highest productivity countries – is illustrative. UK average labour productivity is about 40 per cent higher than that of New Zealand, but UK real GDP per capita is only about 10 per cent higher than that here (both on OECD estimates). The UK does not have a low participation rate, but their participation rate (see first chart) is far lower than New Zealand’s (as are average hours worked per capita).
Sometimes the story is portrayed as one of employed New Zealanders working long hours. There is something to that story – working hours per worker in New Zealand tend to be in the upper quartile for advanced countries (only Lithuania was higher in 2019 among OECD countries – although Singapore, Korea and Taiwan are all materially higher). Some of that, in turn, doesn’t reflect long hours each week, but shorter annual leave entitlements than in many European countries. But equally important is long hours over a lifetime – our young people and our old people are simply more likely to be in the labour force than in the rest of the OECD, for a mix of reasons that can’t simply be dismissed as “good” or “bad”.
To the extent those reasons are “good” just think of the per capita incomes that could be sustained here if policies were ever adopted that once again delivered average productivity getting even close to the leading bunch in the OECD.

Really interesting analysis, thanks Michael.
LikeLike
I think Super is likely the biggest contributor here; there really isn’t an incentive to stop working just because you are old. And honestly I don’t think there should be, but there is only a limited amount of work to go around so it would be better if it was shared out more evenly.
LikeLike
Not really true that there is only so much work to go around. We have fairly low unemployment rates, quite high participation rates across all demographics, and (for example) those 65+ people still working will also presumably be spending most of the additional income they earn, adding to demand elsewhere.
LikeLike
Well, yeah, a lot of people have jobs but the productivity figures suggest that people aren’t doing a lot of work in those jobs.
LikeLike
Unfortunately services type jobs trade time for money. It requires a massive labour input with only marginal returns. When the RBNZ aggressively hikes interest rates, our local producers shutdown. We are only left with services on the aftermath of interest rate hikes that decimate our productive industries.
LikeLike
How are students treated in this data? Just as 65 no longer means stop work neither does 15 mean leave school. And then there is the definition of student – full time at a university or apprentice builder preferring classroom learning to on the job learning? What about full time students who are also working in fast food for two or three evenings a week? When my daughter studied social work at Aucklabnd Uni the course had only existed for one year – prior to that all social workers were recruited on the basis of being old enough not classroom educated. Without careful judgement of the above points I’d prefer 22 to 77 as the definition of working age with some adjustment for average lifespan when comparing countries and decades..
LikeLike
It is just a standard age-determined measure. Students will counts as participating in the labour force if they are in paid work for at least 1 hour a week or are actively seeking week and available to start straight away.
The 25-54 band used to get a lot of focus for some of the reasons you mention – an idea of “prime working age”.
LikeLiked by 1 person
At 77 I am still healthy, working and glad to be able to contribute to society, the personal reasons are partially because I want to and partially because I need to. Returns on capital invested are and have been for some time less than sufficient to top up state super to provide a decent living even with no debt, and property rental has become a dirty word by the current collection of clowns impersonating a Govt. In the short term I see no real improvements so choices for many will be seek higher yield with more risk or accept a lower standard of living. This is a worldwide issue as pension funds are facing a looming black hole in their future ability to pay pensions Calpers in California is a prime example and no doubt the NZ super fund will be impacted by any fall in stock and bond markets. Should stagflation take hold then the pictures gets worse and short of our historical solution of war I see no answer. We are currently in stage 3 of 4 parts on the road to destruction (Acknowledgement to Chris Rhea) – Frustration – Anger-Hate-Reaction and it as my Lawyer explained stage 3 to 4 is triggered by Hunger so NZ is unlikely to be first.
LikeLike
At a healthy 60 with a property portfolio currently valued upwards of $11 million, low debt and a paid wage of $200k a year, I have no retirement intentions. Fortunately for me as an accountant, this Jacinda Ardern government has made my job highly relevant with trigger happy and careless tax legislation. Rents have also escalated due mainly to a raft of healthy homes and health and safety regulation interference on landlords. Someone has to pay for all these extra costs.
I have already provided for my 2 daughters with transfers of cash and equity with the younger 12 year Old with already cash savings of $100k and her older 26 year Old sibling with a transfer of a $600k investment property with $350k equity and associated rental income.
My kiwisaver Balance Growth fund has escalated at a annualised last 12 months return of 30% making up for the negative Covid 19 lockdowns returns in the prior 12 months.
LikeLike
You are missing half the pensions analysis here which I imagine would make a significant contribution to the % of workers aged >65 – private pensions. KiwiSaver is a miserly scheme which unlike those in the UK for instance is taken from net and not gross income, and contribution rates from employers/employees are comparatively much lower. At a rough guess I would say I am putting about twice as much money into my pension in the UK than NZ. I think a lot of people will be getting nasty surprises when they approach 65 and realise that what they’ve accrued just won’t be enough to have a decent retirement on (+ superannuation) and that’s what keeps them working.
LikeLike
One can debate the merits of KiwiSaver (I’m not a fan) but for today’s over 65s it won’t have been significant in their retirement planning.
LikeLike
The lack of a decent private pensions scheme is absolutely a significant factor in anybody’s retirement plans. People who have accrued lots of money will be happier to retire at or in many peoples cases before 65. People who haven’t and rely on super + private savings will not.
LikeLike
Right but people my age will have assumed/planned on the basis of a basic NZS with their private savings on top of that. KiwiSaver is a subsidised form of private saving but it isn’t the only form by any means (and KiwiSaver probably changed the vehicle in which people save rather than necessarily/ wholly the total amount of savings). Recall too that NZ has the lowest or second lowest elderly poverty rate in the OECD.
LikeLike
Remember that people in countries with better private pension schemes will have made assumptions based on having more money at the time they want to end their working life. People in countries where they have less money at that point will extend their working lives. I don’t see why this is so hard to comprehend but I imagine it is because you have decided that you have the answer already and nobody else can add anything to it.
LikeLike
Not really sure the nature of the disagreement. Reasonable people can and do debate the implications of different retirement income regimes, and as you’ll note from the post our 65+ participation rates aren’t exceptionally high.
LikeLike
Your last chart shows NZ’s labour participation rate for >65s being 2.5x that of the OECD median. The difference is many times more in this age range that any other. So it is ‘exceptionally high.’ You’ve also decided that there is no explanation for this. I would assume that ‘how much money people have at age 65’ is a reason worthy of investigation beyond those which would hold steady across other countries (e.g being too knackered to work anymore, being afraid of being bored if you stop working). A key factor into how much money people have on retirement is…the quality of their workplace pension. All points worthy of further analysis. Perhaps your next blog could look into them? I don’t think the case is closed.
LikeLike
Actually i don’t think any case is closed in this area. I find the participation rates – across ages countries, time – really interesting, and was somewhat surprised myself by some of the data (notably the prime-age female rates). As I note in the post, there is no sense of “good” or “bad” about the numbers without a better sense of what is driving them, and in some cases without judgements about what society “should” be like.
LikeLike
People respond to incentives, and in many countries (most?), one cannot access retirement benefits or savings without actually retiring. This is particularly likely to be true of employer-based pension plans, while publicly funded plans are often means-tested, which has much the same effect.
But in NZ one qualifies for NZ Super and can access savings from Kiwisaver on turning 65, even if one continues working. (Defined-benefit employer pension plans normally provide pensions only after retirement, but there must be very few of those left.) So NZ workers are not pushed out of the labour market on reaching retirement age.
JW notes that the ratio of NZ/median participation rates for 65+ is higher than in other age groups (but it is still far below the highest in the OECD, so “exceptionally high” is too strong), and infers that this is because NZers do not have enough retirement savings. But poverty rates among the elderly are much lower in NZ than in most OECD countries, which suggests that we do not continue working because lack of savings compels us to. The alternative explanation is that we continue to participate at relatively high rates because we can, and this seems to fit the facts better. The implication is that other countries are throwing away a lot of potential production by encouraging workers to retire prematurely.
Michael’s original question was not about retirement, but about whether our best-in-class (worst-in-class?) participation rate was concentrated in one identifiable demographic. His answer is quite interesting, and implies that there must be a number of reasons which affect different cohorts in different ways, not one single reason. The part of the story related to retirement may be that other countries push older workers out of the workforce by the design of their pension systems, and we do not. There may well be other structural explanations for participation in the other cohorts: Germany notoriously provides huge subsidies for university study, thus attracting younger people out of the labour market.
LikeLike
So does this correlate with the historical kiwi trend of under-investment in automation?
Ie labour is relatively cheap (and potentially plant is extra-costly by virtue of distance and freight) so firms are not sufficiently incented to automate vs employing more labour. Which has resulted (in combination with other incentives) in workers remaining longer in the workforce, and thereby suppressing the wage rate which might incentivise automation (ie a vicious cycle).
A scarce workforce as per low employment might be expected to drive average wages up, but not if the workforce is elastic in terms of non-retiring older workers.
LikeLike
There is certainly something of a correlation, but I think the international literature on econ development would suggest that sheer availability of labour doesn’t hold back development and productivity growth (look at Japan post-war for example, or even the real gains made in the Soviet Union (50s and 60s) or China. My story is one of lack of profitable outward-oriented investment opportunities here, reflected in the flat to falling share of exports/imports in GDP. If it were simply a capital/labour mix story it would be less likely that foreign trade would be doing so poorly.
LikeLike
Another thought (a speculation, not suggestion) – could the flow-through effects of intergenerational lending manifest themselves this way?
Ie young cannot afford a property deposit. Elders work longer to uphold guarantees on their children’s or grandchildren’s property purchases.
They may have remortgaged/refinanced their properties to assist with deposits to children/grandchildren and thereby extended their liability/working life.
LikeLiked by 1 person
I also wonder whether whether a change in retail banking policies may have contributed to this. In previous years, my father’s bank refused to extend a loan to him beyond that which would be repaid at the age of 65. The bank’s position was that if he were unable to repay his mortgage after he turned 65, they would not willingly place themselves in the position of having to foreclose on him at that point (presumably the threat to their reputational image was too great).
Now it seems commonplace for banks to extend property loan terms to well beyond 65 years, which is sensible in embracing the practical reality that retiring people may well choose to trade down in their housing and apply the residual capital toward their retirement. OTOH, this opens up a range of other scenarios, both practical and perverse.
LikeLike
Would be interesting for someone with access to very detailed data to look into.
LikeLike
NZ has admitted many immigrant workers and their families in recent decades, in several surges, especially post-2014. I would guess that all such people would be more likely to work than the average New Zealander. Perhaps they are shifting the averages. Has our net immigration been higher than that of other countries?
https://www.interest.co.nz/property/95613/our-changing-migration-patterns-net-migration-numbers-are-falling-back-their-recent
LikeLike
Yes, most years now NZ has immigration rates similar to those in Aus and Canada. Israel is also often high but the rest of the OECD countries almost always have much lower rates.
LikeLike
Yes, generally.
LikeLike