As a parent I find it particularly disheartening to observe the near-complete indifference of governments and major political parties that might hope to form governments to the atrocious productivity performance of the New Zealand economy. If the last National government was bad, the Labour or Labour-led governments since 2017 have been worse. It is hard to think of a single thing they’ve done to improve the climate for market-driven business investment and productivity growth, and easy to identify a growing list of things that worsen the outlook – most individually probably quite small effects, but the cumulative direction is pretty clear. Before I had kids I used to idly talk about not encouraging any I had to stay in New Zealand, so relatively poor were the prospects becoming. It is harder to take that stance when it is real young people one enjoys being around, but…..at least from an economic perspective New Zealand looks like an ever-worse option, increasingly an inward-looking backwater.
One of the ways of seeing the utter failure – the indifference, the betrayal of New Zealanders – is to look at the growing list of countries that are either moving past us, or fast approaching us. Recall that for 50 years or more New Zealand was among the handful of very highest income countries on earth.
For doing those comparisons I prefer to focus on measures of real GDP per hour worked, compared using purchasing power parity (PPP) exchange rates. It is, broadly speaking, a measure of how much value is being added by firms – mostly in the private sector – for each unit of labour those firms are deploying. Real GDP per capita can be useful for some purposes – actual material living standards comparisons – but can be greatly, directly, affected, by demographics, in ways that don’t reveal much about the performance of the economy and the environment for business investment.
When I run charts here about productivity comparisons across countries I mostly use OECD data. Most – but not quite all – of what we think of as advanced economies are in the OECD (as well as a few new entrants that aren’t very advanced at all, and seem like “diversity hires”, incidentally making New Zealand look a bit less bad in “whole of OECD” comparisons). But once in a while I check out the Conference Board’s Total Economy Database, which has a smaller range of series for a rather wider range of countries, advanced and emerging. The latest update was out a few weeks ago.
As regular readers know I have highlighted from time to time the eastern and central European OECD countries – all Communist-run until about 1989 – that were catching or moving past us. I first noticed this when I helped write the 2025 Taskforce’s report – remember, the idea that we might close the gaps to Australia by 2025, when in fact policy indifference has meant they’ve kept widening – in 2009, so that must have been data for 2007 or 2008. Back then only Slovenia had matched us, and they were (a) small and (b) just over the border from Italy and Austria. The OECD and Conference Board numbers are slightly different, but by now probably four of the eight have matched or exceeded us (and all eight managed faster productivity growth than us over the last cycle). Turkey – also in the OECD – has also now passed us.
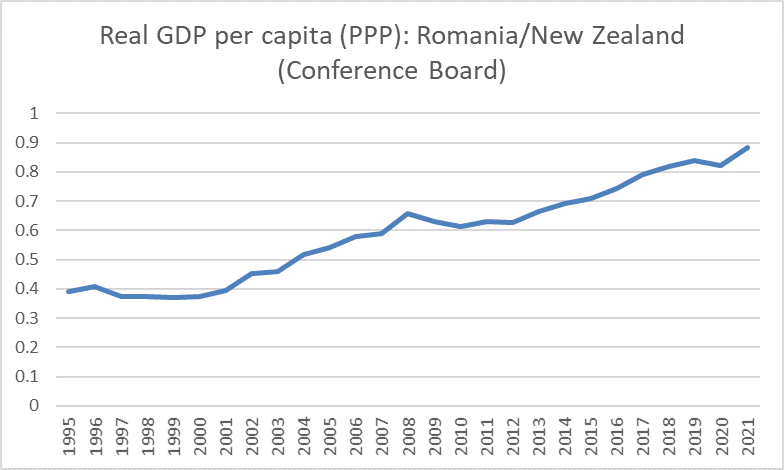
But what about the central and eastern European countries that aren’t in the OECD? As I glanced down the tables I remembered a post I’d written four years ago about Romania and comparisons with New Zealand’s economic performance. Romania had been achieving quite strong productivity growth prompting me to note
….one of the once-richest countries of the world is on course for having Romania, almost a byword in instability, repression etc for so many decades, catch us up. It would take a while if current trends continue. But not that long. Simply extrapolating the relative performance of just the last decade (and they had a very nasty recession in 2008/09 during that time) about another 20 years.
So how have things been going?
Even if we focus just on the last hard pre-Covid estimate (for 2019) they were up to about 84 per cent of average New Zealand labour productivity. If these trends continue, they’d catch us by about the end of the decade.
To be clear, it is generally a good thing when other countries succeed. It is great that these central and eastern European countries moved out from the shadow of the USSR and non-market economies and are now achieving substantial lifts in living standards. The point of the comparisons is not to begrudge their successes – which have a long way still to run to match most of western Europe – but to highlight the failure New Zealand governments have presided over. We were richer than all these countries for almost all of modern New Zealand history, and soon our economy will be less productive than all or most of them. We were also richer and better off than most or all of today’s most productive advanced economies, and now we just trail in the their wake. Even as the most productive advanced economies have experienced a marked slowing in their productivity growth in the last 15 years or so
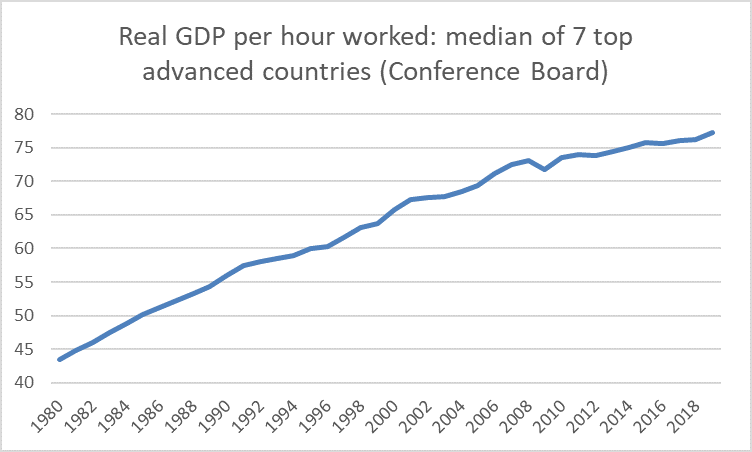
we’ve really only managed little more than to track their slowdown – and recall that the median of these countries has average labour productivity two-thirds higher than New Zealand’s so – as in the central and eastern European countries – there were big gaps that might have been closed somewhat. Most of those countries did so, but not New Zealand.
To revert to Romania for a moment, it is not as if it is without its challenges. It ranks about 55th on the World Bank’s ease of doing business index, and has been slipping down that ranking (although still doing very well on a couple of components). Corruption seems to be a major problem. The neighbours aren’t the best either – including Ukraine and Moldova. Reading the latest IMF report (pre-Covid) there were signs of some looming macro imbalances but the latest IMF forecasts suggests a pretty optimistic outlook still, including investment as a share of GDP climbing back to about 25 per cent of GDP. Perhaps something is going to derail that productivity convergence (with New Zealand) story but it isn’t there in the forecasts at present. And if corruption has to be a drag of some sort (but how large can that effect be?) government spending and revenue are both smaller as a share of GDP than in New Zealand.
In GDP per capita terms the picture (Romania vs New Zealand) is not quite as grim. That mostly reflects differences in hours worked

Some of that is demographics, some not. Either way, hours worked are an input – a cost – not (mostly) a good thing in their own right. New Zealand struggles to maintain upper middle income living standards for the population as a whole by working a lot more hours (per capita) than many other advanced countries.
And then of course there is the difference that must be quite uncomfortable for the political and bureaucratic champions of “big New Zealand” – those politicians (both sides) just champing at the bit to get our population growing rapidly again.
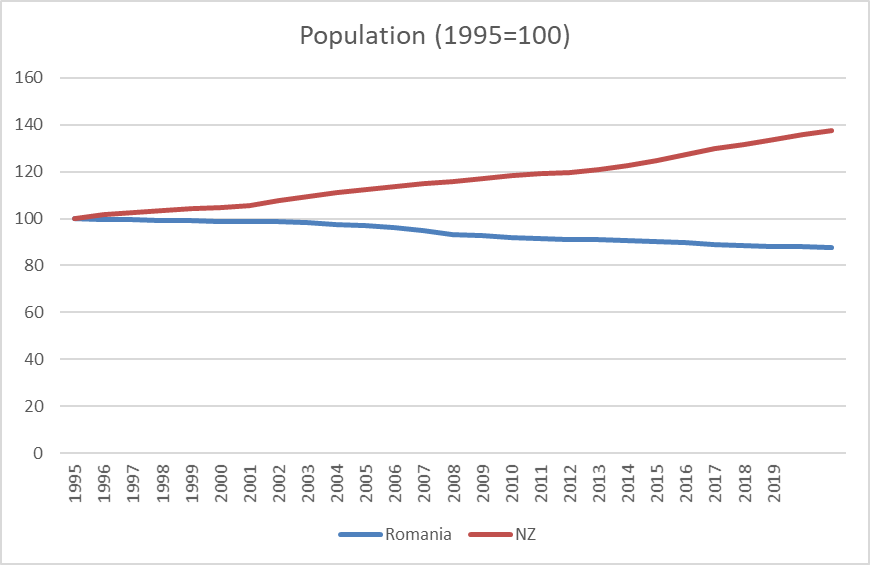
Romania is a pretty big country. When this chart started it had almost six times our population. 25 years on Romania’s population is a bit under four times ours. I mentioned earlier the investment share of GDP: Romania’s is averaging a little higher than ours, even with these massive population growth (shrinkage) differences, so just imagine how much more of those investment resources are going to deepen capital per worker (even public infrastructure per citizen). (For those interested the total fertility rates of the two countries are now very similar: the differences in trend population growth are largely down to immigration/emigration.)
Now, of course, I haven’t mentioned being in the EU or being located not too far from many of the most productive economies on earth (although Bucharest to Zurich isn’t much less than the distance Wellington to Sydney). Those are advantages. Of course they are. But then why do New Zealand officials and policymakers continue to champion a (now) purely policy-driven “big New Zealand” when (a) almost nothing has gone right for that story in (at least) the last 25 years, and (b) when so much else of policy choices only reduces the likelihood of the future under such a strategy being any better?
Romania really is a success story, and I’d like to understand a bit better why (for example) it has been doing so much better than Bulgaria and Serbia. But it isn’t an isolated success story: in addition to the OECD eastern and central European economies, Croatia isn’t doing too badly either.
But – and taking a much longer span – this chart still surprised me. It draws on different database – the Maddison Project collection of historical real GDP per capita data. Since it is per capita data it includes all those differences in hours worked per capita (data which simply isn’t available for most countries in the distant past). I’ve started in 1875 simply because that is when the Romania data start. I’ve shown only the countries for which there is 1875 data (the last observations are 2016 simply because that is when this particular database stops), with the exception of China and India which I’ve added in for illustrative purposes because there are a couple of estimates for years between 1870 and 1887 which I’ve simply interpolated. The chart shows the ratio of real per capita incomes in 2016 as a ratio of those in 1875.
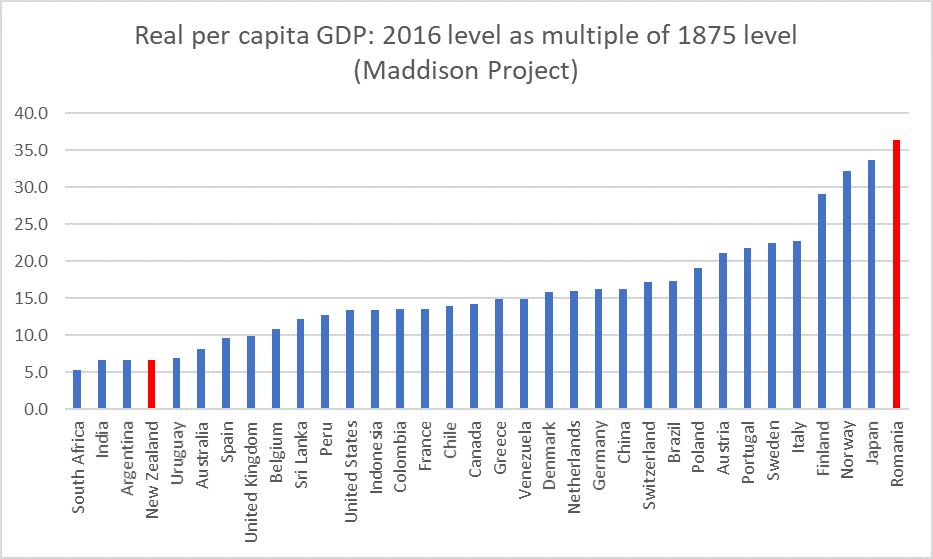
Best of them all. New Zealand not so much (and yes we were about the top of the class in 1875, but the New Zealand story is submergence not convergence, given how many of these countries are now richer than us).
To be clear, over the last 140+ years New Zealand has been a far better – safer, more prosperous, fairer, more open – country in which to live than Romania. Whether it will still be so for most the next century is increasingly a very open question. Our politicians seem unconcerned, and if any of them have private concerns they do nothing about them – no serious policies in government, so no serious policy reform options in Opposition. Nothing. They seem to just prefer nothing more than the occasional ritual mention.
Still on matters productivity, I finished reading last night an excellent new book on productivity: Fully Grown: Why a Stagnant Economy is a Sign of Success by Dietrich Vollrath, a professor of economics at the University of Houston. It is incredibly clearly written, and is a superb introduction to economic growth and productivity for anyone interested (I”ll be commending it to my son who has just started university economics). I’m not really persuaded by his story about the US, but it is well worth reading if you want to think about these issues as they apply to one of the highest productivity economies on earth. It suffers (as so many US books) do from being exclusively US-focused, even though there is a range of northern European economies with productivity levels very similar to (a bit above, a bit below) those in the US and one might think that their data, their experiences, might be a cross-check on some of his stories. To be clear, his focus is on a frontier economy, not ones – whether New Zealand or the central and east European ones, or even the UK and Australia – which start so far inside the frontier. But it is a very good introduction to how to think about sum of the issues, and a summary of many of the papers that the research-rich US economy generates.

Reblogged this on Utopia, you are standing in it!.
LikeLiked by 1 person
Excellent comparison as we approach Romania like conditions. Several years ago I learned an expensive lesson. If you don’t pay attention to your capital and tend to its growth it will leave you for a more rewarding environment. The persistent chip of socialism as it clips the wings of productive growth is leading to capital seeking a better reward. It would be interesting to see how productivety declines in relationship to the increasing dead hand of government’s share of GDP.
LikeLiked by 2 people
When the government invested to save Tiwai Point Smelter, productivity gained. When the government invested $11 million to save Bungee Jumping, productivity lost because the tourism industry requires people. Lots of people that are cleaners, drivers, waiters and retail attendants.
The productivity equation is actually simple to solve. More automated factories, productivity increases. Every factory NZ Inc shuts down equates to a loss of productivity.
The government must act to save Marsden Point refinery. This is a Strategic asset of National importance. Our air planes and 4 wheel drives need petrol. Shutting down Marsden Point means that we are dependent on Singapore which is in the hotspot region of the South China Seas which is pretty much a military conflict zone. Shutting down and banning oil and gas exploration was also rather silly as we have the largest ocean boundaries in the world given our status as a continent Zealandia with most of our land underwater.
LikeLike
Another article that makes one think. I cannot resist a quote “” New Zealand struggles to maintain upper middle income living standards for the population as a whole by working a lot more hours (per capita) than many other advanced countries “”.
The chart of ‘Real per capita GDP: 2016 level as a multiple of 1875 level’ was an eye opener. Presumably put in the article to make us think about comparative success but what is shows is remarkable – even the worst are five times better off. Take the previous 141 years and those multiples would be small fractions not whole numbers; maybe some even negative. Extrapolate back a millennia or two and still nothing like the phenomenal grow in wealth. My over generalisation of the message in Hans Rosling’s ‘factfulness’ is that when average income is less than $2 per day then survival is the overwhelming priority: you sleep on unsealed ground, you never can predict if you will be eating or hungry, you have as large a family as possible and if necessary sell your children into slavery. Above $2 is still poverty but you have hope, especially the hope to educate your children and give them a better future. Rosling stated Sweden about the time of the Treaty of Waitangi had 80% of its population below that poverty line.
Your chart reveals a near miracle – the dramatic increase in personal wealth throughout the world – but the underlying cause of this miracle can only be capitalism, science and technology. But capitalism must be the biggest factor since the communist countries had science and technology but less growth in GDP. Strange how it is much easier to find negative criticisms of capitalism in our media than celebrations of its successes.
LikeLiked by 2 people
Hi Bob
Yes the improvement in material living standards is truly remarkable. Even in NZ I read accounts of the lives of some of my ancestors here in the 2nd half of the 19th C and the contrast to today is staggering. My mother did her masters’ thesis in 1949 on the penetration of appliances in Dunedin homes – at a time when NZ was still one of the richest in the world – and even then the contrast to now is stark.
On Communism, I’m a little more cautious in my condemnation (econ as distinct from moral). the eastern bloc did nowhere near as well as the west, but material living stds in Russia in 1989 were still hugely better than those in say 1913. Reverting to type however, note that both China and Taiwan have had big increases in material living stds, but Taiwan is now a genuine first world economy and China is no better than a middle income country (even with the muddle of a semi-market economy, as distinct from some pure state ownership model).
LikeLiked by 2 people
I assume Romania in 1875 was steeped in squalid poverty compared with the NZ colonists which accounts for some of the difference. Low base and all that.
LikeLike
Yes, and in a way that is my point. Most of us probably thought of Romania in that sort of way for a long time, and yet now they are beginning to close in on NZ.
In some respects, the think that took my most by surprise was that China was only in the middle of the chart – even though I push back against “look at the billions the CCP lifted out of poverty” it still took me by surprise.
LikeLike
Hi Michael,
Always enjoy the productivity related posts, thank you. Take a hypothetical version of New Zealand that was at the productivity frontier, which industries would you expect to see major companies participating in? When I think of the Nordic countries they tend to have strong large companies in:
– energy and resources
– high tech manufacturing
– pharmaceuticals
– telecommunications (electronics)
The US would be similar with of course the addition of large financial and technology sectors.
What are the highest productivity industries? If New Zealand could magically have 500,000 people working for the highest productivity companies on the planet which companies would they be?
Thanks again
LikeLiked by 1 person
On my model I think we should expect to see really successful NZ firms, that staying mostly operating from NZ, mostly in natural resource based areas. No doubt, firms that become successful globally will start here – as they have since Glaxo – but most are likely to be more valuable closer to major markets, centres of expertise etc. The closest successful comparator is probably Iceland – which has real GDP per capita now just below the upper group in the OECD and not much behind say Germany and the Netherlands.
Achieving that probably requires a materially lower real exchange rate for a decade or two – itself only likely from much reduced immigration net inflows – combined with regulatory liberalisation that would facilitate heavier investment in natural resource based companies. Sadly, the latter seems even less likely than the former.
LikeLiked by 2 people
What about the work of the productivity commission Michael? Have you made any submissions to them?
LikeLiked by 1 person
I have made the odd submission and no doubt will on the new immigration inquiry. These days that Commission mostly investigates specific issues the govt asks them to look at, and there has been little sign the govt has been asking the right questions.
LikeLike
You have covered productivity in NZ many times and your arguments are persuasive. But one issue I cannot remember you raising is language. Talented Kiwis have no difficulty working in Australia, UK, USA and many other countries use English for business. It is not just the talented person but his family too. So NZ retains talent like a colander retains water. This is less of an issue for small non-diverse countries with strong identity and an unusual language. So Denmark has Lego and Finland has Nokia and Sweden has Volvo and those businesses keep their talented staff at home while exporting successfully.
We are fortunate our govt has clearly realised this and is endeavouring to make our language incomprehensible to English speakers from other countries.
LikeLiked by 2 people
I burst out laughing when I read your final sentence.
Yes, English is both an advantage and disadvantage for us. We’d have even more trouble attracting top notch migrants if we had a totally idiosyncratic language, but English also makes its easier for us to leave. Then again lots of young Europeans (in Europe) are pretty fluent in English, but then Denmark , Sweden , Austria Switzerland etc are more productive than most Anglo countries (and roughly match the US).
LikeLike
Correction: Sweden HAD Volvo
LikeLike
[…] But they’re not the only ones, as Michael Reddell demonstrates in his blog article, Productivity growth: failures and successes. […]
LikeLike
I’ve covered your post over at NoMinister – They’re catching up – and made some additional comments about another way this may impact on NZ:
LikeLiked by 1 person
Thanks Tom. Just a small request: the name’s spelled Reddell.
LikeLike
Yikes. Will fix
LikeLiked by 1 person
In recent decades NZ had the highest interest rates in the OECD, an admitted overvalued exchange rate both of which crowded out manufacturing and farming — the largest productivity drivers in this country.
Interest rates to control the housing bubble.
It does not take an Einstein to work out why we have failed and still are.
Oh and the over – regulation in this country is yet another nail in the coffin.
LikeLiked by 2 people
It is completely wrong to consider animal farming to be a productivity driver when it takes 10 million cows to generate a GDP of $16 billion when it takes only 1.5 million Aucklanders to produce a GDP of $80 billion.
It is also completely wrong to admit to an overvalued currency when the NZD is usually 40% discount to the USD and only recently has risen to 27% discount to the USD. The NZD is usually a 50% discount to the Euro but recently have risen to a 40% discount to the Euro. We can never get a Free Trade agreement with the US or Europe primarily because of our significant advantage of our much lower NZD. The only reason we did have a FTA with Europe was through a deal through our mother country, the Queen of England. With Brexit that Europe FTA access is gone for good.
Our highest interest rates in the OECD has zero correlation with the NZD. The NZD is the 11th most traded currency in the entire world with around $1 billion traded daily. It is a highly demanded currency as it is a stable currency that holds its value, has a highly disciplined Central bank and a stable no nonsense, financially disciplined government
LikeLike
As a comparison, Bitcoin pays no interest but is valued around US$50k on a bad day. A traded currency and highly sought after, driven primarily by speculation and greed.
LikeLike
You say:
“And then of course there is the difference that must be quite uncomfortable for the political and bureaucratic champions of “big New Zealand” – those politicians (both sides) just champing at the bit to get our population growing rapidly again.”
Where, who are, these “Big New Zealand” champions?
LikeLike
Here you go Michael, an opportunity to educate over on Kiwiblog via this post from a retired journalist, Guest Post: Productivity.
I’ve already put up a comment that links back to this piece and your collection of posts on the subect (BTW – you need to add your “Productivity” tag to this post), and obviously having written so much you probably don’t want to place a screed over at KB, but it would help if ignorance like the following is addressed in a bit more detail:
FFS!
LikeLike
Thanks for drawing my attention to that piece. It is pretty poor quality isn’t it, and a shame that the author was not prepared to put his/her name to the column. I probably won’t try to respond directly, but it is good to be aware of what else is being written (and read), even if it is of little substantive merit.
LikeLike
Tom, when 10 million cows generate $16 billion in GDP is considered higher productivity than 1.5 million Auckland monkeys that produce $80 billion in GDP, something is not quite right. Why would you only count monkeys and ignore the number of cows? My 12 year old will tell you that the productivity equation is mathematically wrong.
LikeLike
Gosh, judging from this comment and those you’ve made over on the 60 per cent post I can only assume you’re not a fan of the NZ Dairy Industry,
Leaving that aside and returning to the subject of productivity the first thing you should tell your 12 year old about the risks in comparing apples and oranges, and thus the even greater categorisation problems in lumping humans and cows for comparison purposes. That would lead us into a world where the cow was being compared to an Apple app that you crafted up and made a million dollars from, which is merely a starting point.
Because it all comes down to humans. What really counts is how many humans are producing that wealth and according to the DairyNZ stat site it’s 46,000 people producing $15 billion in exports circa 2017-18. Probably that means $18 billon this season, given the lift in prices.
So that translates into $391,000 per human compared to $53,000 per Auckland monkey using your figures.
Also, given that it’s 5 million cows, not 10 million, I’m not entirely trusting of your figures.
You’re still into the Social Credit system, yes?
LikeLike
Tom, no you are wrong again. We do sell beef as well. It is 10 million cows. 5 million dairy cows plus another 5 million cows for meat, and for breeding. It pretty much adds up to 10 million cows conservatively.
LikeLike
Tom, wrong again. I love my MacDonald burgers and milkshakes and no I have nothing against the beef or milk industry. But let’s not be blind about this fact. 10 million cows generate $16 billion in meat and milk GDP. 1.5 million Auckland monkeys generate a GDP of $80 billion. I am correct, you need to understand NZ has reached peak 10 million cows with nitrate polluted dirty waterways and contaminated ground water.
LikeLike
10 Million Cattle, 46,000 people producing $16 Billion = $195,500 Cattle at say $2000 a pop = inventory, 1.5 Million producing $53,000 – no figures for inventory value but seem to be less productive as they consume products/services of others so may not form any productivity. I guess some of the 1.8 Million are involved in shuffling paper work and goods other have produced which reduces their actual productivity as this only facilitates, I accept its needed of course. The issue of productivity therefore is not with primary producers who continue to produce more with less than those who lobby for legislation to provide them with employment and then obstruct those who produce. Perhaps the answer is to radically reduce this group to a level and position where they actually facilitate productivity. As evidence the 10,000 extra public servants do not seem to have improved anything judging by the continuous stream of stories/facts of mistakes & missed targets which themselves are a disappearing feature since 2017.
LikeLike