Tomorrow morning we finally get Statistic New Zealand’s first guess at June quarter GDP. If I’m being critical in that sentence, it is through the use of the “finally” – emphasising just how long (unusually long internationally) the delays are in producing national accounts data – rather than in the word “guess”. I don’t suppose SNZ will use the term itself, but I think everyone recognises just how difficult it has been for statistics agencies to get an accurate read on what went on in the second quarter this year, when so many economies were so severely affected by some mix of lockdowns and private cboices to reduce contacts/activities. There are likely to be big revisions to come, perhaps for some years to come, and most likely we will never have a hugely reliable estimate – scholars may continue to produce papers on the topic for decades to come. That is also a caveat on the inevitable comparisons that will be made tomorrow, in support of one narrative or another, about how well/badly New Zealand did relative to other advanced countries. Most/all of them – and their statistical agencies – will have had similar measurement and estimation problems.
We do, however, have some aggregate data on the second quarter, including estimates from the Household Labour Force Survey (HLFS) and the Quarterly Employment Survey ((QES) on, respectively, hours worked and hours paid. Each of these surveys – one of households, one of firms (in sectors covering most of the economy) – had their own challenges in the June quarter.
Over time, the growth in hours worked and hours paid tend to be quite similar (unsurprisingly really). From 2014 to 2019, the quarterly growth in hours worked averaged 0.74 per cent per quarter, and quarterly growth in hours paid averaged 0.65 per cent. From quarter to quarter there is quite a lot of variability, which also isn’t surprising given the way the data are compiled (as an example, my household was in the HLFS for a couple of years and I would answer for all adult members of the household: for hours, I’d give them a number for my wife’s hours that broadly reflected my impression of whether she’d had a particularly taxing time in the reference week or not, but it was impressionistic rather than precise). Partly for that reason, when I report estimates of quarterly growth in labour productivity, I use both an average of the two measures of GDP and an average of the two measures of hours.
But in the June quarter there was a huge difference between HLFS hours worked (-10.3 per cent) and QES hours paid (-3.4 per cent). Some of that will be measurement problems and natural noise. But quite a bit of it will, presumably, reflect the wage subsidy scheme. The wage subsidy scheme ensured that most people who were employed stayed employed during the June quarter – although by the end of the quarter the unemployment rate had risen quite a bit – but many of those whose incomes were supported by the wage subsidy may have been doing much reduced, or barely any at all, hours actually worked during the reference week (when they were surveyed). For some components of GDP the QES series had typically been used as one of the inputs, which would have been quite problematic for the June quarter (and, to a lesser extent) in September.
Statistics New Zealand has published a guide to the sorts of adjustments it is going to make to produce its first guesstimate of GDP tomorrow. They seem to be making a significant effort in a number of areas, and presumably this information – and direct contact with SNZ – is what has led private bank forecasters to converge on predictions that GDP will (be initially reported to) have fallen in the June quarter by something like 11-12 per cent (by contrast, in its August MPS the Reserve Bank expected a fall of 14.3 per cent, and that seemed to be a fairly uncontroversial estimate at the time).
I don’t do detailed quarterly forecasts so I do not have a view on what the initially reported estimate of the GDP fall will be, let alone what the “true” number towards which we hope successive revisions will iterate might be.
I have, however, long been uneasy – and think I wrote about this here back in April – but how, for example, SNZ were really going capture the decline in output in the public sector. Output indicators for the core public sector are a problem at the best of times, but there are plenty of stories of government departments that didn’t have sufficient laptops for all staff, or didn’t have server capacity to enable staff with laptops to all work from home simultaneously. And that is before the drag reduced effectiveness and productivity – if it were generally so productive everyone would have done it already – and the inevitable distraction/disruptions of young children at home. All these people were paid throughout, and were no doubt recorded as “working” – in an hours paid sense – but skimming through the SNZ guide I see no indication of any sort of adjustment for this sector. And in respect of public hospitals – much less busy than usual, with elective surgeries cancelled etc – there is also no sign of a planned adjustment to the measured contribution to GDP.
And this note from the guide
- The method for school education will not be changed. Activity is assumed to be unchanged, with remote learning assumed to be a direct substitute for face-to-face learning.
didn’t strike me as entirely consistent with (a) changes to the requirements for getting NCEA passes this year (reduced number of credits students are required to achieve, (b) reports of the difficulties many students had (or the fact that the government was still trying to dish out free routers to poor households – allegedly mine – as recently as a couple of weeks ago, or (c) my observations from my kids about how relatively little many of their teachers seemed to do during the period. Some kids – including a couple of mine – have even have learned more during time at home than time at school but (a) I doubt that generalises, and (b) it certainly won’t show up in more NCEA credits, since schools actively reduced the number of credits they offered.
So those are just a few straws in the wind that leave me suspecting that whatever is published now is probably something of an overestimate of value-added in the June quarter.
I’m also a bit uneasy when I think about what sort of monthly track (implied) is required to have generated “only”, say, an 11 per cent fall in GDP during the June quarter, bearing in mind that real GDP had already fallen 1.6 per cent in the March quarter as a whole.
There was a pretty strong view back in April/May that during the so-called “Level 4” restrictions economic activity was likely to have been reduced by almost 40 per cent below normal (the Reserve Bank’s 37 per cent estimate was here, and I think The Treasury’s estimate was even weaker).
But even if one assumes that in May and June economic activity was right back up to the level prevailing on average during the March quarter (in much of which there must have been little or no Covid effect, even though by the last few days of the period the “lockdown” was in place), April (almost all of which was in lockdown) must have been no weaker than 67 per cent of the March quarter average level to generate an 11 per cent fall for the quarter as a whole.
And that just doesn’t really ring true. We know, for example, that there were no foreign tourists arriving in the June quarter, and levels 2 and 3 restrictions were in place for quite a while. We know too the firms that swore they met the legal requirements for the extended wage subsidy.
If instead, and for example, we assume that May and June were back up to 95 and 97 per cent respectively of March quarter levels of economic activity – which sounds more or less plausible – then April has to have been no weaker than 75 per cent of the March quarter to generate an 11 per cent fall for the June quarter as a whole. And that doesn’t really square with any contemporary estimates about how binding the so-called Level 4 restrictions were. Perhaps they were all wrong and things just weren’t so badly constrained at all, but count me a bit sceptical for now. We’ll see, but in and of itself tomorrow’s release may not shed much light we can count on.
And on the other hand, there is the question of the implied change in labour productivity (defined as real GDP per hour worked). Assume that the HLFS is a somewhat reasonable representation of hours actually worked during the quarter and one is working with a reduction in hours of 10.3 per cent.
Suppose then that the bank forecasters (I looked at ANZ, Westpac, and ASB) are right and GDP is reported to have fallen by 11-12 per cent. That would produce a “headline” – well, there are no headlines, because SNZ does not report this measure directly – drop in labour productivity of perhaps 1 or 1.5 per cent for the quarter.
That might, on the surface, sound plausible. All sorts of things must worked less efficiently under voluntary or regulatory restrictions around the virus. If anything across the range of sectors that normally involve extensive face-to-face contact it might sound like a reasonable stab – albeit perhaps on the small side – as a representative drop. Remember that even in places where gross output was maintained, often slightly more inputs will have been required to keep up output.
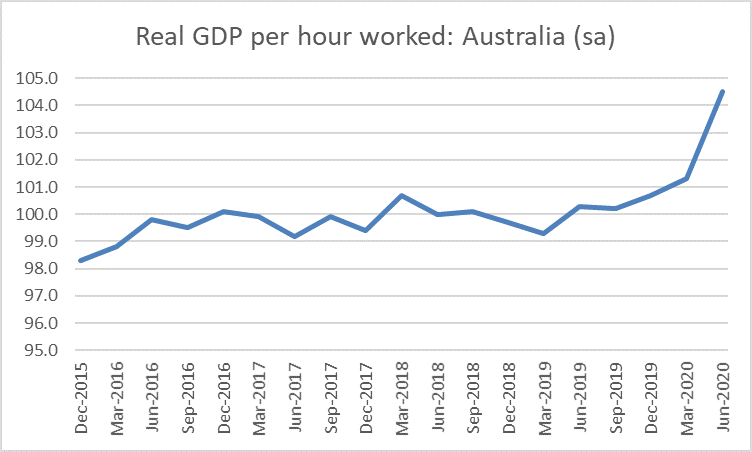
But what do we see in other countries? Finding quarterly productivity estimates for most other countries isn’t easy. The UK publishes an official whole economy series, but with a fair lag (so the Q2 estimates are not yet available, even though they publish monthly GDP). Australia does publish official estimates of real GDP per hour worked in the same release as the GDP numbers. The initial ABS estimate is that real GDP per hour worked rose quite sharply in the June quarter.
The US does not report official whole economy productivity, but labour productivity in the non-farm business sector is estimated to have risen by 10.1 per cent. In both cases, output fell, but hours worked fell even faster. Canada also reports a significant rise in average labour productivity in the June quarter even as real GDP also fell sharply.
What is going on here? It isn’t that Covid is suddenly making everyone, or even whole swathes of industry, materially more productive – the longed-for elixir of renewed productivity growth. Almost certainly what is going on is compositional change: the people who were working fewer hours (or not all) will have tended to be disproportionately in relative low wage/low labour productivity sectors/roles. One can think of bar staff, waitresses, office and motel cleaners, barbers and so on. On the other hand, a fairly large proportion of higher-paying jobs could be done, more or less effectively, with little or no face to face contact. And in Australia, for example, the hugely capital intensive resources sector will have been hardly affected at all by the Covid restrictions. Most individual sectors/roles might have maintained – more or less – their productivity, but for many lower paying ones the effective demand (and output) was just no longer there. Averaging those who were still producing/working one ends up with higher average productivity even if no individual is any more productive than ever.
Each country’s restrictions, and underlying economic structures, were/are a bit different. But on the face of it, it is a little hard to construct a story in which average labour productivity hardly changed in New Zealand when in other advanced economies it rose a lot. We were very stringent on shops and cafes/restaurants/bars. We had a large tourism sector that was very hard hit, and typically isn’t a hgh paying sector.
Now perhaps that HLFS estimates of hours worked (-10.3 per cent) is itself all wrong – although presumably other countries must have had similar issues – but if GDP comes out tomorrow with a reported fall similar to the reported fall in hours worked, it will be just another puzzle to add to the mix – and to hope for some significant revisions down the track. Of course, if (a) HLFS hours is a reasonable guide, and (b) other countries’ productivity estimates are a reasonable guide, then all else equal one might have expected a fall in GDP even less than the one those private forecasters are picking. And – even amid the great uncertainty – that really would be a surprise.

They must find you annoying Michael?
LikeLike
There’s always distractions at home. I find the biggest productivity sapper at work is a person who won’t take a hint and sits too close while telling me about their health problems or their old job. Never happens at home.
LikeLiked by 1 person
Don’t recall ever having that misfortune to any great extent, and on the other hand I recall many stimulating conversations with smart colleagues that would probably never have happened if we’d each been at home – to be fair, often well into the evening in the days before marriage/family. Even though I’m now based at home, and v happy with it, if I were still working in a significant institution I could not really imagine functioning effectively long-term working mostly from home. But I guess personalities differ.
LikeLiked by 1 person
Productivity is poorly measured.
What is being produced? is a better way of measuring.
No doubt if the Crown stopped all the covid insanity productivity would go way up.
https://notpublicaddress.wordpress.com/2020/08/27/stop-testing-and-youll-stop-covid/
LikeLiked by 1 person