Some months ago, when all was coronavirus, Statistics New Zealand released their regional GDP data for the year to March 2019. I didn’t even open the spreadsheet at the time, but went looking for some data the other day and remembered I hadn’t written about the regional GDP numbers this year.
SNZ has been publishing the regional GDP data, by regional council area, for some time now. The first data are for the year to March 2000, meaning that we now have 20 annual observations.
Here is how per capita (nominal) GDP for each of the regions relative to national (nominal) GDP per capita has changed since 2000.
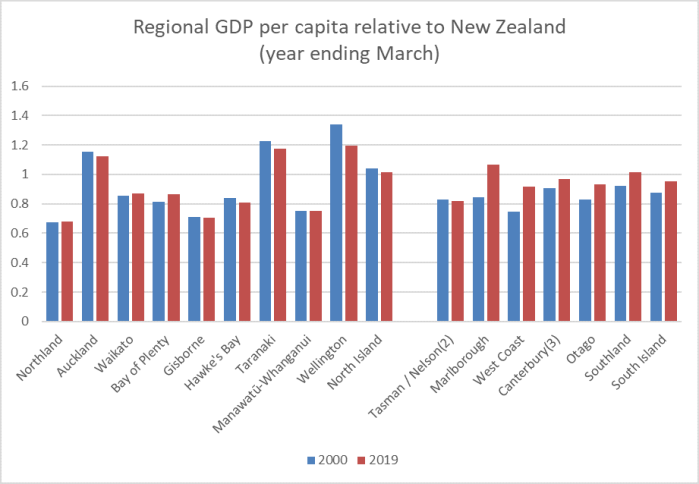
I suppose it is convergence of sorts. Even in the very poorest region – Northland – per capita GDP has increased very slightly relative to the national average, while the three highest GDP regions (Auckland, Taranaki, and Wellington) have all dropped back relative to the national average. The gap between the South Island and the North Island has more than halved and – if one is to believe the numbers – GDP per capita in Marlborough now isn’t much behind that in Auckland.
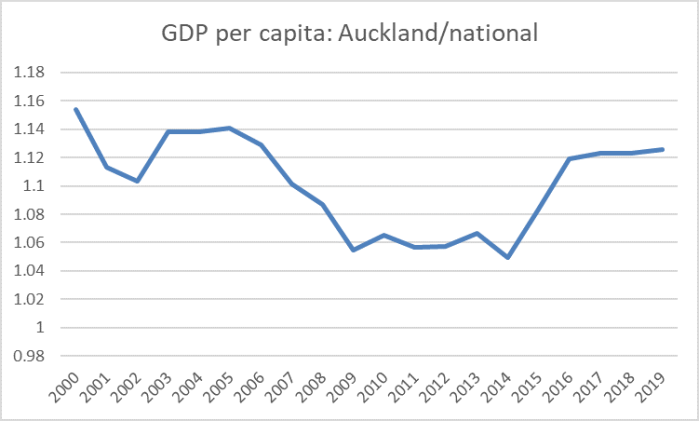
I’ve discussed previously the relative underperformance of Auckland. There aren’t many OECD economies where the biggest city has per capita GDP only about 12 per cent above the national average (let alone where that gap has narrowed this century). But it is only fair to note that Auckland had been staging something of a recovery. Here is the time series chart of Auckland’s per capita GDP relative to the national average.
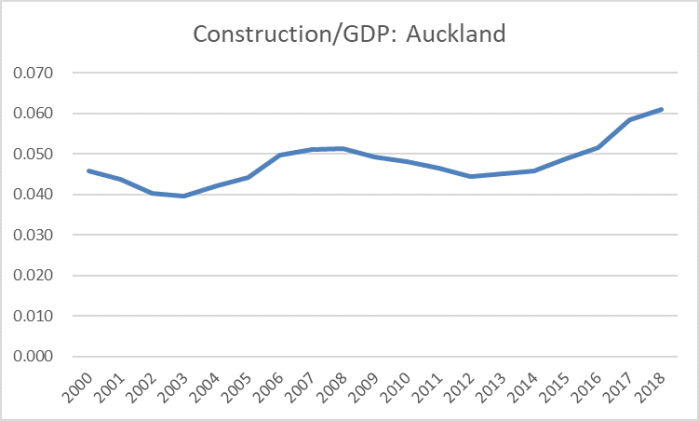
Population surges and associated building tend to be good for Auckland – but there is no sign of productivity leadership, when per capita incomes in Auckland are still a bit lower (relatively) than they were 20 years ago. I think it was the economist Andrew Coleman who suggested, only slightly tongue in cheek, that the business of Auckland was building Auckland. Here is construction as a share of GDP for Auckland (these data lag another year behind).
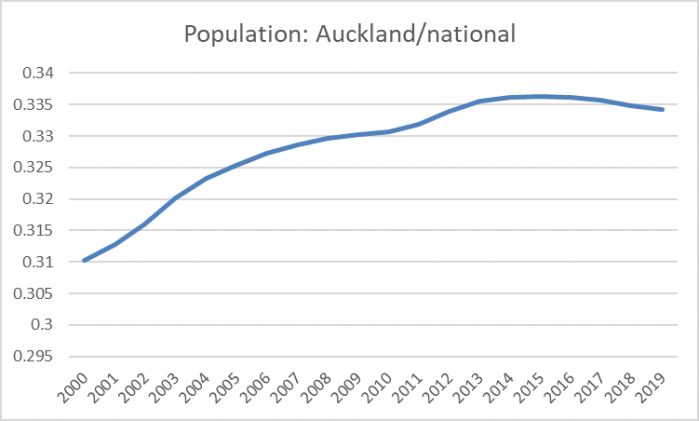
Having said that, I was a little surprised to stumble on this chart.
Of course, if the Auckland economic performance this century has been underwhelming – especially relative to the rhetoric and political capital invested in talk of our “one global city” (the one just a bit smaller than Columbus, Ohio) it is as nothing compared to the relative decline of Wellington, despite all the puffery from the Wellington City Council, its “economic development” agencies, and the like. Here is GDP per capita for the Wellington Regional Council area (largely greater Wellington).
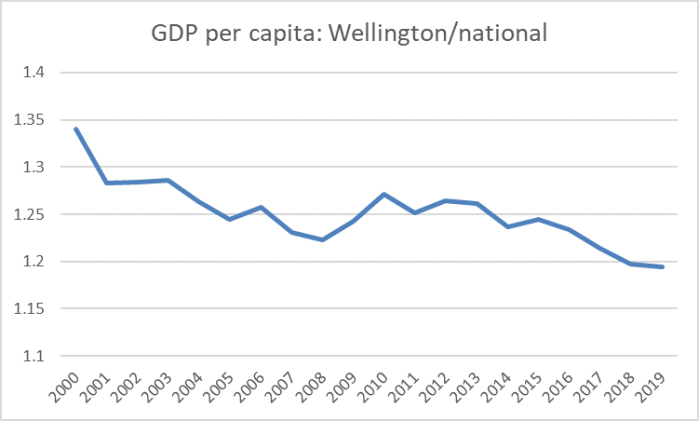
Recessions might be good for Wellington’s relative position – not many public servants get laid off in downturns (including the current one) – but otherwise it is a pretty stark and consistent decline. Wellington’s share of the national population has also been falling steadily – albeit perhaps more slowly than the decline in per capita GDP might suggest was warranted.
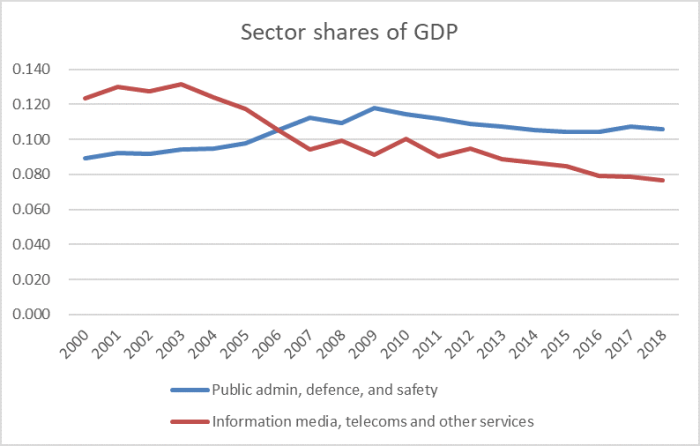
At least if you live in Wellington, one often hears talk of the Wellington IT sector and, of course, the heavily-subsidised Wellington film industry. The regional GDP breakdowns don’t show either directly, but the red line in this chart remains somewhat sobering.
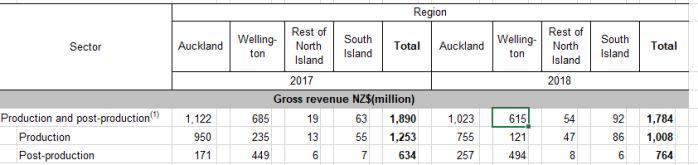
Last year SNZ decided to discontinue its annual screen industry statistics – claiming (no doubt fairly) budgetary pressures, although it must have been convenient for the government (this one, like its predecessors) keen to talk about the alleged economic benefits of their massive subsidies to the film sector, even as what evidence there is rarely offers much support for their claims. The last such data came out a year ago for the 2017/18 year. Here is a snippet from the gross revenue table, by region.
And here is the same snippet for 2012 and 2013.
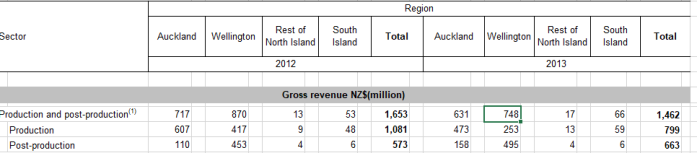
So gross revenues of Wellington production and post-production facilities/services – mostly feature films (unlike Auckland) in the most recent year were not even three-quarters of what they’d been in 2012.
(There is a longer series of earnings for jobs in the total production and post-production sector – including the domestic-oriented bits – of the screen industry: relative to GDP it was no higher at the end of the period than when the series started in 2005. And estimated number of jobs in the sector has gone from 20400 to 20300 over the same longer period. It looks like a classic infant industry – remaining infant and kept going by massive subsidies that keep the rest of us poorer.)
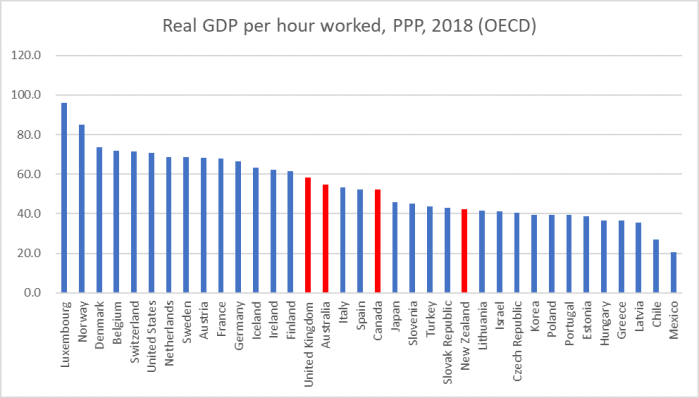
All this is, of course, against a backdrop in which national-level productivity growth remained very weak, and New Zealand continued to drift behind more and more countries that, not too long ago, we never even thought of as relevant comparators.

Hi Michael these pictures get even more sober when you look at tradables and export orientation by region and then, for Wellington overlay human capital ( the highest in the country) Dave
On Wed, 3 Jun 2020 at 9:46 AM, croaking cassandra wrote:
> Michael Reddell posted: “Some months ago, when all was coronavirus, > Statistics New Zealand released their regional GDP data for the year to > March 2019. I didn’t even open the spreadsheet at the time, but went > looking for some data the other day and remembered I hadn’t written ab” >
LikeLiked by 1 person
You really need to start factoring in the 10 million cows throughout the regions. It is just unfair to just count the 5 million monkeys and conveniently forget to count the 10 million cows.
LikeLiked by 1 person
Michael,
I’d love to see a chart of the regions by tax revenue and receipt. Which regions are net beneficiaries of government largesse ?
I’d bet that Manawatu-Whanganui and Hawke’s Bay are net contributors…
LikeLike
It would be interesting to see such data. I’m not sure I share your prior, altho it might depend if one was including net capital spending as well as op ex. On the operating side, poorer areas will generate less revenue per capita, while most welfare benefits and most public service salary structures pay the same in Hastings as in Akld or Chch.
This UK data suggests the poorer/peripheral places are net fiscal recipients (altho the Uk is different in that London has far the strongest market economy, as well as most of the head office public servants).
https://www.ons.gov.uk/economy/governmentpublicsectorandtaxes/publicsectorfinance/articles/countryandregionalpublicsectorfinances/financialyearending2019
LikeLike
https://www.workandincome.govt.nz/map/deskfile/extra-help-information/accommodation-supplement-tables/non-beneficiaries-current-01.html
Two of my daughters if they fell on hard times could fit the criteria for $305pw accommodation allowance because they live in Auckland. If they move to Northland they would get $185pw less. Of course that money goes to the landlord but aren’t these area bands effectively supporting the Auckland property market? It does seem to be an arbitrary distortion that doesn’t encourage beneficiaries to move from city apartments to rural properties where they could grow their own food.
LikeLike
Not sure that’s the case here in NZ. Wellington for instance is absolutely the primary beneficiary of government spending.
LikeLike
Absolutely re Wgtn. As for other regions….only the data would tell.
LikeLike
Some pretty sobering data here. But I am not sure that the “IT industry” (is there such a thing?) is really captured in “Information media, telecoms and other services”. The decline in that series may mostly reflect the slow disintegration of the print media business and cost reductions in telecoms.
The ANZSIC classification includes “JJ122 Internet Service Providers, Web Search Portals and Data Processing Services” in this grouping, and JJ122 is certainly part of the IT industry.
However, the part of the industry that is most plugged into the global IT world is really “MN115 Computer System Design and Related Services”. This is part of “MN Professional, Scientific, Technical, Administrative and Support Services”, along with “MN113 Advertising, Market Research and Management Services”. Broadly speaking, Google is an MN113 company; the part of Amazon that creates much of its value is MN115; Microsoft and Oracle are MN115.
I can’t upload the picture, but Wellington’s MN as a proportion of Wellington’s GDP has been slowly rising since 2005 (from about 10% to 12%) while Media etc has declined sharply, as you show. But the very underwhelming growth in MN services actually reflects what is happening in NZ as a whole: as a proportion of MN in NZ, Wellington is basically unchanged at 20% since 2005 or so. So there is nothing going on in Wellington that resembles any special growth in IT or professional etc services more broadly. All the talk about this is just talk.
LikeLike
Thanks. That’s useful. Note that for the whole country that Information media, telecoms, and other services shares of GDP has fallen about 2 percentage points this century, whereas the fall in Wgtn has been around 4 percentage points. (I was using that line mostly on the presumption that the screen industry activity would fall there, no so much re the so-called IT sector as a whole.)
LikeLike
I think government has had something of a crowding out effect in Wellington. There was a time when Wellington had a large number of peripheral manufacturing and distribution businesses, but very little of that remains and all that remains is retail and service businesses that serve consumers who are paid by the government. You can see the effect all those big industrial buildings in Gracefield and Porirua that are now go-kart tracks and garden centres, and while I think it is good thing that we don’t assemble crappy, expensive cars from CKD kits in wellington’s suburbs any longer, we’ve never been able to grow sustainable businesses to replace all those factories we closed in the 1980s. This is New Zealand’s economic track record over the last 50 years – it’s just exemplified in Wellington.
LikeLiked by 1 person
My take overlaps with that, but with a different emphasis. Of course, many of those old manufacturing plants (and head offices) were in Wgtn partly because the govt was there and the returns to lobbying etc to protect licences etc were high.
Generally, NZ still has – and may always have, if it is to succeed – a primarily natural resource based economy, and in some sense all our larger cities are “over-populated” – the outward-oriented high return activities you find in big cities in the US and Europe just aren’t there, just domestic-oriented services (whether private, Akld) or public (Wgtn).
My son asked me a while ago what I thought the population of Wgtn would be if the govt decamped further north. After a bit of reflection I was left thinking that Dunedin might be the best comparator. Relative to Dunedin, both have a port, Wgtn is more central (transport link to SI), but Wgtn probably has less of a hinterland that orients this way (Wairarapa can readily orient towards Napier). It isn’t as if there are any more successful, unsubsidised, outward-oriented private sector firms based here.
LikeLiked by 1 person
NZ is primarily a natural resource based economy because the government chose to protect this one particular industry as opposed to supporting other manufacturing industries. Think big projects in Dairy with the taxpayer funding roads throughout NZ to allow Fonterra trucks to travel, water irrigation, cutting down forests to plant grass and forcing land to farm conversions with taxpayer entities like Landcorp. Taxpayer research entities like DSIR created the Pine timber industry and continue to create new agri businesses, all taxpayer funded by the tens of billions in subsidies.
Border protection for the agri industry funded by NZ taxpayer, disease management and compensation funded by the taxpayer.
What funding did Space manufacturing in NZ get to create Rocketlab? Only a startup research grant of $90k The NZ space industry is now worth $1.7 billion in GDP.. If the government had spent $500 million to buy Rocketlab in the first place, we would own the space industry. Now it is owned by US interest sold for a song.
LikeLike
In that same year that Rocketlab was being sold to US interests for $500 million, the NZ government was spending $1 billion on culling cows due to Mycoplasma Bovis and also required by some dumb and stupid court judge that Kiwifruit disease due to Psa was because of the governments negligent border controls.
LikeLike