We mark today the official birthday of our head of state, Her Majesty, Queen Elizabeth II, queen of New Zealand and of her other realms and territories. Her actual birthday was 21 April 1926, when her grandfather George V was on the throne.
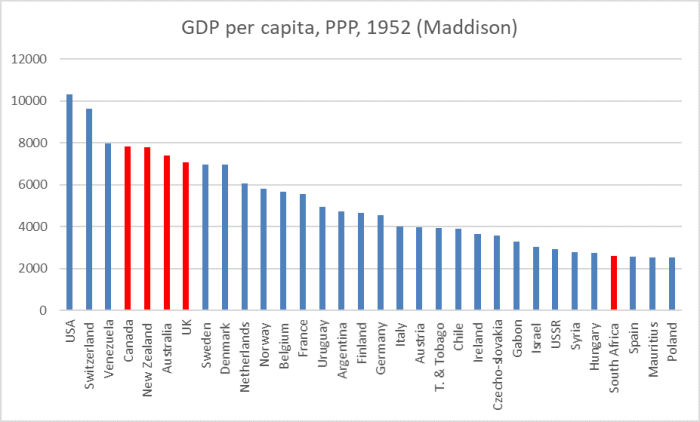
When she was born, the United Kingdom and the Dominions (as they were then called) were still among the most prosperous countries in the world. Using the Maddison compilation of real GDP estimates (and averaging across 1925-27, on account of some considerable year to year volatility in some of the series), here is how things looked at about the time the Queen was born.

At the time, Newfoundland was an independent dominion (for which there is no data, but presumably it was a bit poorer than Canada), and South Africa was also still a domininion. Maddison has no data for South Africa in the 1920s, but what data there is suggests real GDP per capita might have been about a third that in New Zealand.
But the core grouping – the UK, Australia, New Zealand and Canada – took out four of the top eight places.
The Queen ascended to the throne on 6 February 1952. By then, Ireland had become a republic, Newfoundland had been absorbed into Canada….and there was data for Sout Africa.
You get a sense of the growing importance of oil (Venezuela, Trinidad and Tobago – then still a British territiry – and Gabon), but the core group of Her Majesty’s realms still occupied four of the top eight places. There are all sorts of other ranks/comparisons in that chart that caught my eye, but today is Queen’s Birthday.
What about now? Here are the OECD country data (news to me today was that Colombia has just been admitted to the OECD)/
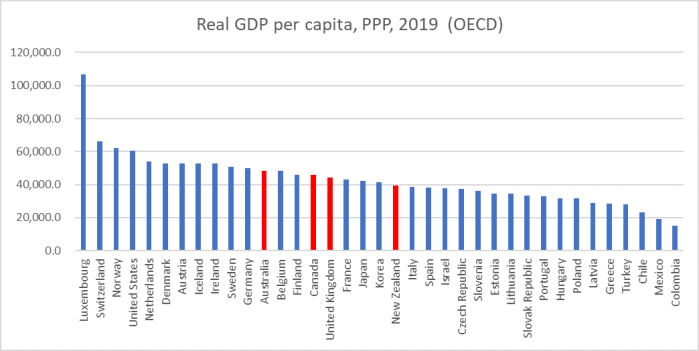
There is data for some more (very small) advanced countries. Then again, Singapore and Taiwan aren’t in the OECD, and they both have real GDP per capita now higher than any of that core group of the Queen’s realms. Use the IMF listing, which also adds in the oil-producing countries, and that core group rank 19, 20, 27, and 32 – a far cry from the position when Queen came to the throne.
(Of the former Dominions, Ireland – here shown, as the Irish do, using the modified GNI measure – ranks well, but not exceptionally so. As for South Africa, in 1952, its real GDP per capita was not far behind that of the USSR. These days – IMF rankings – South Africa is 96th and Russia 50th.)
I used the OECD numbers in the previous chart because the OECD also had productivity data. Here is real GDP per hour worked (same adjustment for Ireland) for 2018.
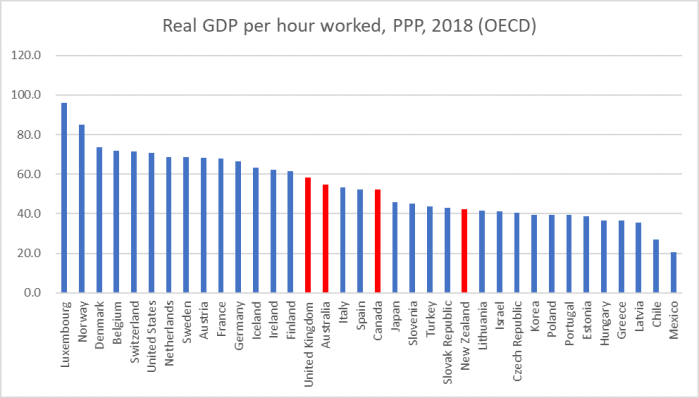
New Zealand and Australia tend to have high hours worked for capita, so the GDP per capita rankings are not as bad as those for GDP per hour worked.
Quite a portrait of relative decline. Her Majesty – and her Governors-General – appears to have been poorly advised on matters economic by her minister and officials in all four of these countries.
The Queen is also monarch of a variety of other countries – 12 others directly, plus the Cook Islands and Niue by right of her position as Queen of New Zealand. (There is a fascinating chart here of how the number of countries she has been monarch of has changed over the years.) Sadly – especially for them – none of those other countries has put in a particularly compelling performance either. On the other hand, there is a range of UK/Crown territories – Falklands Islands, Bermuda, Isle of Man, Gibraltar and Guernsey – that now do better than any of the UK, Canada, Australia, or New Zealand.

Isn’t it all just another sign of general decline of British empire after WW2? At least, relative decline in comparison to many other economies. British empire and the dominions fought in WW2 longer than any other ally, from the first to the last day, and perhaps have spent/lost a lot of economic wealth in process…
LikeLike
The answer lies in the number of automated factories versus manual labour.
LikeLike
The relative position of Europe is really driving the ranking of the Commonwealth dominions on these charts, though, right? The US is doing well right throughout the period. What has changed are the fortunes of the European countries. In 1925 and 1952, of them had just come out of major wars that devastated them on a much greater scale than even NZ and the UK. Not so true for some of the Baltic states, but they fit into the oil story you tell well enough. Much of Ireland’s wealth is paper only. The only relative rise can’t explain based on the above two factors (war and oil) is Iceland.
When you take into account all of the above, I don’t know if there’s anything left to attribute to mismanagement by the ministers of the Crown.
LikeLiked by 1 person
This is really a joint reply to your comment and the one above by Ivan Pechorin.
I don’t agree with either interpretation. Had I been wanting to put a stronger interpretative emphasis on the post I’d have shown the chart for just prior to WW1, when NZ, Australia, Canada, the US, and the UK held the top 5 places, Canada narrowly beating out Switzerland.
Neither war nor empire stories are that persuasive. After all, a lot of Continental countries emerged from the war (esp WW2) much more spent than the UK and Dominions – Germany being the extreme, unsympathetic example. And the decline of the realms relative to the neutrals (Switzerland, Sweden and – in WW2 – Ireland) is pretty striking. Re empire, yes the UK gave up an empire, but so France, Netherlands, Belgium and Portugal (let alone Turkey, another OECD country, after WW1).
Re Ireland, I don’t accept the line that is prosperity is “paper only”. As I noted in the post, I deliberately used – as the Irish authorities do – their modified GNI measure, which attempts to capture the value flowing to Ireland and its (resident) people. From the productivity chart, you will see that Ireland’s productivity level is only just ahead of the UK and both countries are behind the leading bunch (that i”ve often written about here).
I reckon i have very plausible stories for the relative declines of Australia and NZ. I don’t have a good one at all for the relative decline of the UK (which has ebbed and flowed in more recent decades – the 15+ years prior to 2007 was v good for the UK – but never showed signs of rejoining the leading group.
LikeLike
The Queen Elizabeth countries v time chart link seems to be pointing elsewhere.
LikeLike
Thanks for pointing that out. Fixed now.
LikeLike
Reblogged this on Utopia, you are standing in it! and commented:
One area is to refer to the Channel Islands as Crown territory. Her claim to them is a residue of her claim to the dukedom of Normandy. That is why the royal toast their includes a reference to her as the Duke.
LikeLike
It’s not unreasonable to refer to the Channel Islands as Crown territory.
From http://www.royal.uk: “There are three island territories within the British Isles that are known as Crown Dependencies; these are the Bailiwicks of Jersey and Guernsey which make up Channel Islands, and the Isle of Man. The Crown Dependencies are not part of the United Kingdom, but are self-governing possessions of the British Crown.”
LikeLiked by 1 person
If you are going for a job interview in the channel islands, would you refer to them as a crown territory or a crown dependency?
LikeLiked by 1 person
Is that right?
Nearly half of Luxembourg’s workforce commute to work (daily) in Luxembourg from another country.
Most non-Luxembourg nationals travelling across the border are French (78,500 workers), Belgians (39,400 workers) and Germans (39,100 workers).
Does the OECD account for the fact half total GDP on a per capita basis where total GDP is divided by population excluding commuters.
How does NZ count its population denominator where there are 400,000 temporary migrants and work visas many working in seasonal work and part time jobs. Is this a mathematical anomaly? Does NZ’s current population of 5 million include 300,000 tourists still stuck here? Just wondering how stringent is NZ’s numbers
LikeLiked by 1 person
The point re Luxembourg isn’t a problem for GDp per hour worked comparisons. For per capita measures one really needs to use GNI for Luxembourg, but doing so still leaves them at the very top end of the league table.
LikeLike
How does Luxembourg manage to export steel to the US?
LikeLike
Never got anywhere at the Treasury encouraging people to study Canada. It had a persistent productivity gap with the USA that is not that much different from ours but it certainly can’t blame distance nor size and other myths.
Didn’t get any better results at the Department of labour.
LikeLike
Canada still has productivity levels 25% ahead of ours (and v similar to Australia), but yes it has been a productivity growth underperformer.
LikeLiked by 1 person
To obtain productivity it needs status. Look at her majesty’s birthday honours list to identify what we reward. Many worthy people but how about the barbers in my local shopping centre who opened their three shops at midnight just one minute after we went to level-2? Incidentally my library re-opens today. I still haven’t had a haircut but I’m desperate to get into the library.
LikeLike
Here’s my theory on productivity – it’s too hard to obtain capital to get started (not everyone has a house to mortgage or wealthy friends/family), too hard to obtain capital to seriously expand, too small a market for it to be worth the effort, too risky thanks to personal guarantees piercing the corporate veil, and too easy to satisfice, so that’s what most business owners do.
Want to increase productivity? Relentless drive up labour costs so that business owners are forced to obtain and spend capital on machinery/software. When a business owner says “if you keep pushing up minimum wage, I’ll start replacing staff with automation”, say “please do” and celebrate it. Make it easier to find capital, and easier for a business to go bankrupt without crushing the owner under a weight of personal guarantees.
LikeLike
There used to be a similar line run about the (alleged) productivity benefits of a high exchange rate.
LikeLike
Given how bad the situation is in the US, NZ sure looks like a more viable model of administrative and economic success. NZD has risen up to 63.5 cents against the USD. Still a discount of 36.5% and from a US perspective still very much way too low and a predatory exchange rate for its local US farmers which will not allow for any FTA with the USA to move forward.
LikeLike
Unfortunately, automation in the aged care, health care and hospitality sector is not practically available. Productivity will not increase. The end result is highly paid migrant workers who would send cash back to their poverty stricken home countries with a net loss of consumption spending in NZ.
LikeLiked by 1 person
Unfortunately, the aged care, health care, and hospitality sectors are not frontier businesses that will obtain growth-spurt or lift-off from technology. In fact in NZ they would be mature businesses. Should you be interested you will find there are 7 Health Care residential (property) entities contained in the component list of the NZX50
An examination of the financials Ryman Health Care reveals a company that has assets of $2 billion, $227 million from “underlying profit” plus $102 million from from revaluation of unrealised retirement-village units. It makes sales of 414 sales of occupation rights plus resales 824 occupation rights. Doesnt say whether the occupation rights are volumes or $ dollars. They are in the tax-free “Capital Gains” property business
Over the last 6 years they have paid zero tax on $1.8 billion
That’s where the money is going
LikeLiked by 1 person
Aged care and health care, I’ll give you, although I note that administration in those areas uses computers these days which means more work being done per person. Lots of automation is available in hospitality though, particularly dishwashing and ordering. The number of places I have seen using people to wash dishes astounds me when good commercial dishwashers are much cheaper than a person.
LikeLike
Craig H, computers have been widely used for 30 years now. My first job in NZ was to teach Fletcher Building project managers to use spreadsheet planning tools on Apple SE computers.
LikeLike
Graphs need to be read in the context of the history of the time. In the 1950’s 90% of NZ export income came from Agriculture. New Zealand was not in a post WW2 slump, it was booming due to the export opportunities of the Korean war. Wool production (and income) rose due to the demand for winter uniforms, sheep numbers rose 40% in the ’50s and wool prices were at record levels. I believe that was the time they said “a pound for a pound”; a pound in currency for a pound of wool. The population was only 2 million and a relatively small number of people working on farms drove the export earning economy. That’s still happening particularly in the Dairy industry today. Dairy just regained the top income generation spot from Tourism for year to December 2019. Be interesting to compare the number of people working in the Dairy industry versus the tourism industry. Eg; on farm labour and processing factories employees, versus hotel, hospitality, airline employees,bungee operators, etc etc.
LikeLike
Barry, you have made the same mistake that Michael makes in that you keep counting the 5 million monkeys but forget to count the 10 million cows in the productivity equation.
My 11 year old daughter can answer this question which economists struggle with.
Which animal is more productive?
1.5 million monkeys generate a GDP of $75 billion in Auckland.
10 million cows in the regions generate a GDP of a poor $17 billion.
LikeLike