The calendar says it is summer, but “summer” seems to have bypassed Wellington. We’ve been back for 10 days and on not one of them has it been warm enough for a swim. Right now, my phone says it is warmer in Waiouru than in Wellington. And so, between driving lessons for my son, I’m still pottering in the national accounts data released late last year, although this will be the last such post for now.
At the end of November, I ran a post here on investment and capital stocks, drawing on the annual national accounts data released a few days earlier. One of the central charts was this one
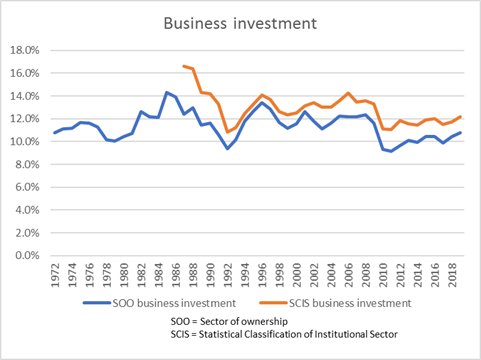
What about business investment? SNZ don’t release a series for this – but they could, and it is frustrating that they don’t – so this chart uses a series derived by subtracting from total investment general government and residential investment spending. It is a proxy, but a pretty common one.
Business investment as a share of GDP has been edging up, but it is still miles below the average for, say, 1993 to 2008, a period when, for example, population growth averaged quite a lot lower than it is now. All else equal, more rapid population growth should tend to be associated with higher rates of business investment (more people need more machines, offices, computers, or whatever).

So common is this proxy for business investment that for a long time it was how the OECD was doing things, including in cross-country comparisons where New Zealand mostly did poorly. Note that none of this approximation would be necessary if Statistics New Zealand routinely published a business investment series. There is no obvious reason for them not to do so – no individual institution confidentiality is being protected (as an example of one reason SNZ sometimes advance for non-publication).
My working assumption has long been that government-owned business operations designed to make a profit (notably SOEs) were not being included in “general government”. I didn’t just make up that assumption; it is a standard delineation advanced by the OECD themselves. Here is their own definition
| Definition: |
| General government accounts are consolidated central, state and local government accounts, social security funds and non-market non-profit institutions controlled and mainly financed by government units. |
In other words, “general government” would include government types of activities, including things – even semi-commercial things – mainly funded by government units (whether large losses, or direct subsidies or whatever). Core government ministries would count. State schools would count as part of “general government”, but fully private schools would not. And nor, on the standard interpretation would the investment of New Zealand SOEs (required to aim to generate profits for the Crown) or fully market-oriented trading companies that might happen to have a majority Crown shareholding. Such trading companies are mostly funded by their customers (and private debt markets) not by the Crown.
But it turns out that this isn’t how SNZ has actually been doing things in New Zealand, at least as regards the “sector of ownership” data I’ve used (and which the OECD has typically used for New Zealand).
I learned this because of a pro-active outreach by an SNZ analyst, to whom I’m very grateful. This analyst emailed me noting that he had enjoyed my posts on the annual national accounts, but…
In that post you include a chart showing general government investment as a share of GDP. It appears that for your analysis you have utilised the sector of ownership and market group breakdown of our GFKF data, combining both market and non-market activities of entities with central or local government ownership. I wanted to make you aware that this includes state owned enterprises – market orientated units with government ownership. As a result your government investment figures will include, for example, Air New Zealand’s investment in aircraft and electricity units with government ownership.
I suppose it makes sense when one thinks about it (Air NZ and most of the electricity companies are majority government owned, and SNZ confirmed that they do not pro-rate).
As it happens, help was at hand. The SNZ analyst went on
An alternative source for general government investment data is our institutional sector accounts which include GFKF for each institutional sector. In recent years we have adopted a new sector classification – Statistical Classification for Institutional Sectors (SCIS) – to give more visibility to the roles of the various sectors in the economy. SCIS sector 3 (General government) GFKF is held under the series SNEA.S3NP5100S300C0 . We are currently expanding the range of sectoral National Accounts that we regularly compile and disseminate on both an annual and quarterly basis.
The following chart compares the sector of ownership basis with the SCIS basis for general government investment as a share of GDP.
This then goes on to impact the presentation of business investment as you have calculated it:
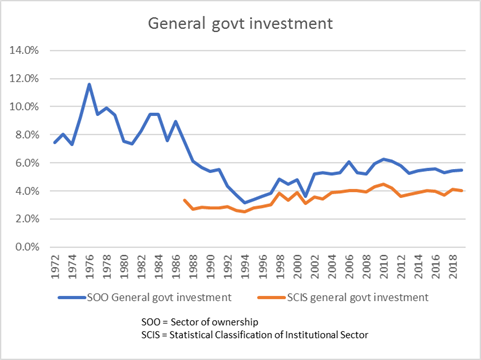
What are the implications? “True” general government investment is lower than in the chart I’d shown (the blue line in the first SNZ chart). But it also marks even more stark how stable the share of GDP devoted to general government investment has been (over 20+ years) despite big swings over that period in the rate of population growth).
On the other hand, business investment as a share of GDP is higher (over all of history) than I have been showing it. But the extent of the recovery in business investment is even more muted than I had been suggesting. Despite rapid rates of population growth, business investment in the most recent year was little higher than it was 6-8 years ago, and not that far above the lows seen in the 1991 and 2008/09 recessions.
The helpful SNZ analyst went on to note that SNZ could do things better.
I acknowledge your point that we can improve our presentation of investment data. We are looking at what we can do to improve this, particularly in giving more prominence to the government and business investment dimensions that your post highlights. We do want to support a consistent basis for the monitoring of government and business investment. Our development work to expand our sector based accounts will support this and allow us to improve both our annual and quarterly presentation. Note that the institutional sector accounts have a shorter time series available, but as we work through this we will consider extending the length of the SCIS based GFKF time series.
A quarterly “business investment” series should be treated as a matter of some priority.
The other aspect of my proxy that had bothered me a little over the years was the possibility of an overlap between residential investment and general government investment. If the government itself was having houses built that should, in principle, show up in both. I could, therefore, be double-counting my deductions. I was less worried in years gone by – the government itself wasn’t having many houses built – but the current government has talked of large increases in the state house building programme.
SNZ’s analyst suggested I didn’t need to bother.
Apart from needing to make a choice over how to define general government investment as discussed above, the proxy you are using for business investment seems fit for purpose in the interim.
- There is very little overlap between residential building investment and government investment, so subtracting both from the total is not doubling up on the subtraction much.
- We represent households ownership of investment properties through separate institutional units to the households themselves. These units are classified to SCIS class 121 (non-corporate business enterprises). There is not a lot of business sector investment in residential property outside of this SCIS class, so subtracting all residential investment in your proxy is fit for purpose.
And yet I was still a little uneasy and went back to him
Thanks too for confirming that there is little overlap between residential building investment and government investment. That had been my clear impression in the past – and I know the OECD has done “business investment’ indicators the same way I was doing them – but had been a little uneasy that with building of state houses ramping up again the overlap might be increasing. If there still isn’t much overlap is that because (say) the construction only moves into Crown ownership when it is completed?
To which he responded
With regards to your question about the state housing ramp-up and whether that is causing the overlap between government (sector of ownership) investment and residential investment to be increasing… conceptually we should be capturing the state housing under government ownership. This is below our published level, and I’d want to look into the data sources and methodology used before being confident in the quality of the government residential investment data. But based on what I can see, Government residential investment does look to be a small share (typically around 1-2%) of total residential building investment, and there is not a clear trend of change in the share over the last 15 years. The values involved are not large enough to alter your interpretation of business investment in the way that you have derived it.
I was still a bit uneasy – 1-2 per cent didn’t really seem to square with talk of thousands more state houses – but would have left it for then. Except that the SNZ analyst came back again
A colleague has reminded me of our building consents release in February (https://www.stats.govt.nz/news/40-year-high-for-home-consents-issued-to-government) where we said:
Home consents issued to central government agencies reached a 40-year high in the year ended December 2018, Stats NZ said today.
Central government agencies, including Housing New Zealand, were granted consent for 1,999 new homes in 2018, which is the highest number since the year ended November 1978 when 2,105 were consented.
“There has been significant increases in new home consents issued to central government agencies in the last few years, with levels approaching those last seen in the 1970s,” construction statistics manager Melissa McKenzie said.
However, private owners (including developers) accounted for 94 percent of the 32,996 new homes consented in the year ended December 2018.
Partnerships between the government and private developers to build new homes may not be reflected in the central government numbers as the results depend on who was listed as the owner on the consent form.
Now, the building consents data then forms the basis for the compilation of our building activity statistics, through a combination of survey sampling and modelling. There is a lag between consent and building activity. So the timing is uncertain, but we should expect the higher consents to flow through to increased building activity. As the last paragraph notes, there are some practical aspects that may impact on the quality of the sector to which the building activity is assigned.
The building activity statistics are a key data source for our residential investment statistics in the National Accounts, but I’d want to look into the National Accounts methodology more to understand whether there are any other aspects impacting the quality of the government residential investment data.
So there seem to be a few problems to be sorted out at the SNZ end, leaving users of the overall investment data – and particularly anyone looking for a timely business investment proxy – somewhat at sea. It probably isn’t a significant issue for making sense of the last decade or two, but if the state is going to be a bigger player in having houses built for it the data for the coming years will be murky indeed.
Unless, that is, Statistics New Zealand treats as a matter of priority the generation and publication of a timely “business investment” series. They are only agency that can do so, that has access to the breakdown of which government-owned entities are investing, and what proportion of residential building activity is for government.
I guess this is just one among many areas where we see the results of SNZ not really being adequately funded, over many years, to do core business (even as they have funding for extraneous purposes, notably the collation of wellbeing indicators, some sensible, some barmy). There aren’t many votes in properly funding such core activities, but it doesn’t make them less important.
I really do appreciate the pro-active amd helpful approach of SNZ’s analyst. I hope his managers are receptive to the need to improve the quality of the investment data SNZ is publishing.
And the bottom line? So far as we can tell, business investment has remained very weak, and quite inconsistent with what one might have expected in the face of the unexpected surge in the population over the last five years. Firms, presumably, have not seen many profitable opportunities.

Business investment Chart
(a) Gross fixed capital formation (GFCF), also called “investment”, is defined as the acquisition of produced assets (including purchases of second-hand assets), including the production of such assets by producers for their own use, minus disposals.
(b) GFCF is a macroeconomic concept used in official national accounts such as the United Nations System of National Accounts
Q(a). Does that include imports of equipment ie graders, bulldozers, trucks, tunnel-boring machines
RE: GCFC chart. If I was advising a potential foreign investor I would want to know a breakdown of investment groups for years 1994 and 2006 and 2010 because I would want to know what areas were being invested in and then what areas weren’t being invested in, in 2010 and subsequent years
LikeLike
Yes, all capital equipment added to the NZ capital stock is captured, In calculating GDP the share that is imported is subtracted off again (the identity GDP= C+I+G + X-M, where I is investment and M imports) to measure activity in NZ.
THere is a more detailed breakdown of the asset types within the GFCF aggregate.
LikeLike
Trawling through NZ Stats looking for GCFC information led to the following page showing an amazing restructure of NZ’s economy. What is missing in this is related information giving the GDP per Hour for each sector. Agriculture has gone from number 1 to number 10. Some of the other sectors are a bit of a surprise. the question then arises, is NZ’s poor productivity due to the restructure. If the restructure is capital intensive then productivity should have risen. The implication appears to be that total investment, wherever its going, is not being invested in the most productive sectors.
Home>Experimental>Which industries contributed to New Zealand’s GDP?
Top 10 industries from 1972 through 2018
https://www.stats.govt.nz/experimental/which-industries-contributed-to-new-zealands-gdp
LikeLike
Well that is quite interesting in terms of the data, however, your key point remains… I don’t think I have seen a chart on your website comapring business investment in NZ vs other similar sized economies or trading partners? That comparison along side comparisons of wage growth, gdp growth and productivity growth might be interesting…
Over the break (what break??) I was reflecting on the weak productivity numbers and this discussion highlights the thought again.
Is the problem really one of lack of capital / access to capital / willingness to access said capital? its not a metric that can be easily captured in the stats, but the weakness in capital raisings across all parts of the market (sharemarket, crowd funding etc) and the continued sale of NZ companies offshore highlights a continuing and real drought of capital.
And the banks, bless them are dead set useless. Look at the problems in the farming sector in terms of borrowing, even for seasonal finance. Imagine how hard it is to raise capital to fund business investment for other businesses?
If seen a number of industry reports prepared by MBIE that often highlight the ‘missing middle’… a few large firms (for NZ’s size) and loads of small firms and not really much in the mid size – its as if the big ones are there because of history and the small ones can’t grow to be mid-sized.
Another related issue might be that NZ management, when compared internationally are generally pretty awful. Sure there are rock stars and some NZ business people have had v successful offshore careers. Its not that there aren’t smart people who are good at business in NZ; its just that there aren’t enough of them… so the best and brightest go overseas and NZ is left with (on balance) a worse than average set of company managers.
Again not something that can be measured easily… but if you tie, lack of capital to weak/poor management and low business investment together… you sort of end up with what we have…
Thoughts?
LikeLiked by 1 person
Our business investment as a share of GDP tends to be around the lower quartile – there is a (jnow quite old) OECD chart on p12 of this https://treasury.govt.nz/sites/default/files/2017-11/mi-jarrett-comm.pdf, the first ever public outing of my ideas in this area.
Bear in mind that we’ve had well above average population growth. All else equal one might therefore hope that we’d have had above average business investment (as a share of GDP) – people need equipment etc. There is a chart in this 2017 post https://croakingcassandra.com/2017/07/05/squeezing-out-business-investment/ illustrating hat ,across the OECD, actually the business investment share of GDP has been (loosely) inversely related to population growth over recent decades. This is, in essence, my story that rapid population growth has resulted in a crowding out of business investment – altho even I was really surprised to find that negative relationship (i probably expected something weakly positive). As you’ll see from the chart, there is nothing v unusual about NZ business investment (over 20 years) GIVEN our rapid population growth rate.
On your other points, I don’t doubt there is something in each of them, but mostly i think they are symptoms of the deeper problem – the terrible location that means that few outward oriented businesses, not natural resource based – are really viable here. Smart people create smart firms but mostly they are more valuable based nearer global econ centres. That means that returns to investing heavily in (eg) mgmt capability aren’t great, affects capital mkts etc, and the opportunities for really ambitious NZers here aren’t that great either. Throw in the fact that our real cost of capital has been consistently higher than that in most other advanced countries – part of the crowding out process, see above – and, to a first approximation, none of what we see is overly surprising.
LikeLike
I completely disagree that our NZ managers are any worse than those overseas. I worked for Rockwell a US multinational and ABB a Swiss multinational for 10 years. These multinational companies give out annual performance based awards for best performance awards and NZ managers usually pickup most of the top performance awards measured against the rest of the world. Top regional positions are regularly offered to NZ managers to run teams overseas. NZ managers are usually considered well rounded and higher skilled being exposed to many more aspects of a business due to leaner management and smaller companies taking on many roles at the same time.
LikeLiked by 1 person
These multinational companies do practice differential pricing with NZ and Australian companies paying the highest prices in the entire Asia region. Prices are based on market size. The largest markets like China gets the lowest price and the smallest markets like NZ gets the highest prices for the same product.
LikeLike
Frederick, I agree with the lack of capital to fund growth. NZ companies reach a peak size usually funded by debt using the equity of a residential property. Angel funders are few and merchant banks practically non existent in NZ would usually fund the gap between bank debt and a IPO into the primary stock exchange for growth. Once NZ companies reach a peak size they inevitably have to go offshore for that angel funders or merchant banks to fund that gap.
LikeLike
Aviation consultant and former Air New Zealand executive Irene King said Foran should try make headway towards allowing Air New Zealand to depreciate its aircraft faster.
This was an accounting method used by Singapore Airlines and allowed for faster fleet renewal which resulted in a more modern, fuel efficient aircraft being added to a fleet, she said.
“Singapore Airlines can write off a brand new 777 in four years. Under our regime it takes about 15 to 20 years.”
Faster fleet renewal created an improved and more affordable customer experience and would make Air New Zealand more competitive internationally, she said.
“It has such a significant impact on pricing.
“It actually does change the competitive dynamics.”
Airfares could potentially be hundreds of dollars cheaper when aircraft were depreciated faster, she said.
“You’re talking significant changes in competitive advantage.”
However, it would be no mean feat and would require some major changes at a regulatory level that would need to be approved by Treasury and be ring fenced to aircraft, she said.
https://www.stuff.co.nz/business/industries/118862454/supercharging-air-new-zealand-five-industry-experts-share-their-tips
=======================================================================
Now the reason I posted this is that I have been advocting this approach for 30 years. Not just for Air nz who should not be given special priviledges but for all businesses.
For years now people like Reddell and Brash and others have talked about productivity. Well you acheive that not with old outdated equipment but with the latest.
For companies that can afford to be up to date then that’s fine but if you have to borrow against your house to upgrade plant or mortgage your self to a finance company then the choices are a lot tougher.
allowing greater depreciation means the money is there for the company to use.
Better still it means the unproductive and the jobs filled by jobsworths stop endangering the health of companies. Think MPI, Worksafe and so on.
The only exception that I would make to this rule is for company vehicles. Too many non productives using their advantage to b uy new vehicles which are essentially non productive. Indeed the maximium depreciatable allowance I think should be allowed to a car ir a ute is $40k. No reason why high priced cars should be depreciable unless they are directly used as income earners and the lawyers Merc ain’t one of those.
Much gear is now computerized and that stuff goes out of date so quickly.
Otherwise everything that is plant and equipment should qualify.
The other positive to this is we would reduce the need to import more people. Given the current status of NZ accommodation that could only be good. The dopes would argue where will the money come from. Well cut the wasteful spending, remove the barriers to better workplaces, remove perhaps the RMA!
Lets get our businesses really motivated.
LikeLiked by 1 person
Rocketlab started out as a NZ company manufacturing Space Rockets in NZ. It still continues to have a sizable manufacturing facility in NZ but it is now a US company. Would additional depreciation on equipment keep it a NZ company?
It was sold for $350 million to US interests so that the company could better access equity funds to continue to grow.
LikeLike
yeah… about that… the current average of the Singapore Airlines jet fleet is 7.7 years, where as the current average of the Air NZ fleet is 6.8 years… so you point, at least as far as airlines go is redundant… the exception is the turbo prop fleet, however, those are really the Q300s that do all the small regional routes in NZ…
As to the wider point about depreciating yourself to profit… the IRD hates this… and all it seems to do is allow a company’s return on capital to artificially increase because you are pushing the denominator down faster than it should go…
The key point is invest in assets that enable you to deliver value to your customers and shareholders, with the emphasis on the customers first – the depreciation rate should not really be any consideration.
LikeLike