Getting back to taking a look at the revisions to the national accounts data published just before Christmas, I thought it was about time to update my chart about how wages rate have been doing relative to the underlying performance of the economy. There isn’t, and sbouldn’t, be anything mechanical about the relationship between the two series, but looking at how wage rates have moved relative to movements in GDP per hour worked at least opens the way to some further questions and analysis.
In this exercise I am looking at:
- the analytical unadjusted series of the Labour Cost Index (available for both just the private sector and for the whole economy). This series holds itself out as measure of changes in wage rates before any adjustment/deduction for productivity growth. and
- nominal GDP per hour worked. Nominal both because official wages series (including the LCI) are nominal, and because nominal GDP captures the direct effects of terms of trade changes. In a country where the terms of trade move about quite a lot, those changes make a difference in understanding changes in returns to investment and, over time, capacity to pay labour.
There is general inflation in both series, of course. Here are the two individual series starting from 1995q1 (when the LCI series starts).
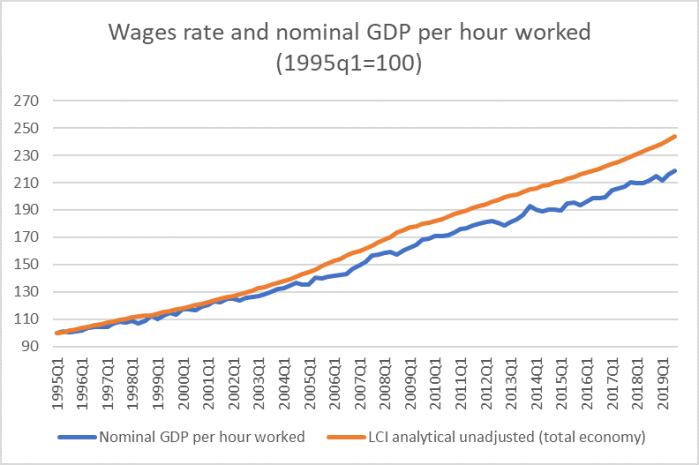
And in this chart, I have shown the changes in the ratio of wage rates (this measure) to nominal GDP per hour worked. A rising line indicates that, on these measures, wages have risen faster over the period in question that GDP per hour worked. Doing so strips out the effects of general inflation (in both numerator and denominator) and enables us to better see when changes in the ratio of wages to economywide “productivity” or earnings capacity happened. The blue line is the quarterly series, and the orange line is the four-quarter moving average of that quarterly series.
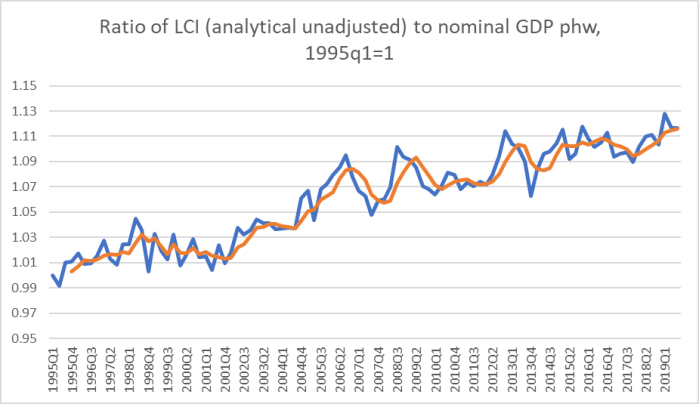
Over the almost 25 years of this data series, wages rates have risen about 10 percentage points more than nominal GDP per hour worked. Even over the period since the last recession begain (the peak of the previous business cycle was 2007q4), wages rates have risen in total 4-5 percentage points more than nominal GDP per hour worked. It isn’t the smoothest series in the world, and there are measurement challenges in quite a few of the underlying components, but the overall direction of movement – over quite a long period now – is pretty clear. (And it isn’t just a public sector wages story – private sector wages have, over time, risen faster than public sector ones.)
In and of itself, this series is neither good nor bad news, regardless of whether you are “a worker” or “a capitalist”. After all, as is well-known, New Zealand’s productivity performance has been poor for a long time. One could readily envisage an alternative world in which there was much stronger productivity growth, and really rapid business investment growth associated with those opportunities, in which wages (real and nominal) rose materially faster than they did over history, and yet a bit slower that nominal GDP per hour worked grew. A comparable chart for Australia (included here) suggests something like that may have happened there. In New Zealand, however, business investment – and, in particular, growth in the productive capital stock per hour worked – has also been pretty weak for a long time.
But to the extent – pretty feeble as it is – that the New Zealand economy has grown, wage rates have grown faster.
Here are a few associated series. Here is growth in real GDP per hour worked, where I’ve shown both the time series and the series of five-yearly averages in the growth rate of labour productivity.
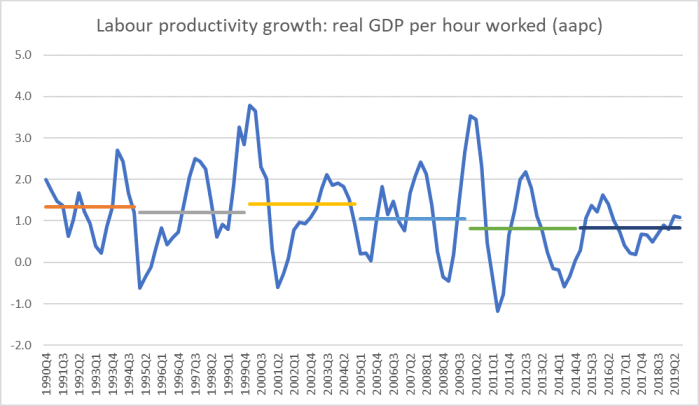
Productivity growth over the last decade has averaged worse than at any time in the history of the series (yes, that may partly be a global phenomenon, but (a) that is no consolation to wage earners, and (b) remember that we started so far behind leading OECD countries that we should have been looking for some convergence).
And what about the terms of trade, the other component in nominal GDP per hour worked?

Our terms of trade lifted a long way in the decade from about 2003 to 2013 – enough to lift average incomes nationwide by about 6-7 per cent. And yet there was none of the sort of business investment boom one might otherwise expect in a country experiencing such a favourable, exogenous, shift in its external trading conditions. As it happened, this was however the period in which wages rose fastest relative to growth in nominal GDP – which again has a somewhat anomalous feel to it.
And here is one last chart: New Zealand’s real exchange rate, using the OECD’s relative unit labour cost measure. I’ve also shown the average for the last 15 years, and it is easy to see how much higher that average is than the average of the previous couple of decades.
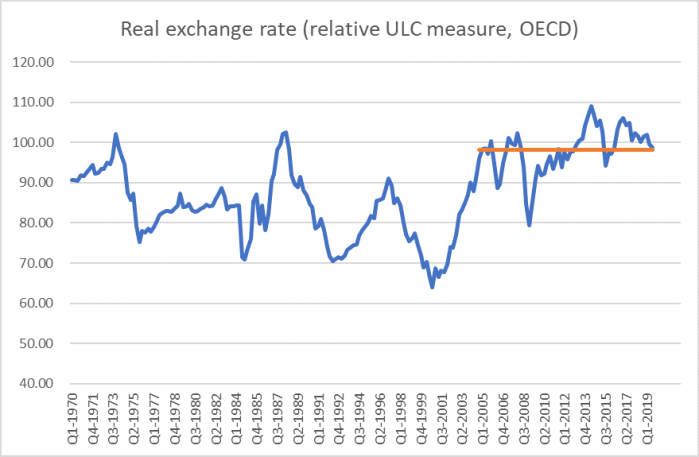
In many respects, the real exchange rate measure is just a variant on the earlier chart, highlighting the relationship between wages growth and growth in the underlying productivity capacity of the economy. But it is more telling, in context, precisely because it introduces an international dimension. New Zealand has lost a lot of external competitiveness in the last couple of decades, even though the terms of trade performed strongly.
Perhaps not surprisingly, our export sector (and imports) as a share of GDP has been falling and (at best) flat. Business investment has been pretty weak, and strongly focused inwards. And productivity growth has been poor.
To be clear, I’m not suggested at all that these outcomes are the fault of workers as workers (as voters it might be another matter). Wage negotiations – employers and employees – occur against a backdrop that neither individual firms nor individual workers (or unions) can do much about. The overall picture is much more the responsibility of broader policy settings – at least on my telling very rapid policy-driven population growth into an economy with few things going right for it. That has had the effect of skewing the economy inwards. It boosts the demand for labour, and so workers have done ok given the mediocre overall performance of the economy. But that should be no consolation for anyone given that, overall, we kept drifting further behind the leading group of advanced economies and are increasingly being overtaken by former Communist, formerly fairly poor, eastern and central European countries.
A government that was really serious about fixing the productivity failures would be asking the Productivity Commission and The Treasury to focus on these big picture issues and challenges.

I had forgotten about the Productivity Commission, are they still kicking the can down the road, using Mike Hosking and Paul Spoonley to make their announcements?
LikeLike
Productivity from a government perspective
The current government gives the Productivity Commission a government selected task that can obnly be a waste of time – symptomatic of sleight of hand – or to put it another way “Never Mind the Quality, Feel the Width” – meanwhile another year will go by
Here we go
Spotlight on NZ’s top firms as part of productivity push
https://www.rnz.co.nz/news/business/407202/spotlight-on-nz-s-top-firms-as-part-of-productivity-push
LikeLike
Productivity and Wages and Labour Rates
Over the holiday break stumbled upon the following article at “newsroom” by Thomas Coughlan. The article is 9 months old. In my opinion it is the best quality expositions of what influences wages and labour in the wider economy. It needs a Treasury analysis. The productivity Commission won’t get near it because its hands are tied. What the heck relevance examining RocketLabs and Xero can provide is beyond me.
https://www.newsroom.co.nz/2019/04/17/540583/beware-corporate-welfare-in-disguise
LikeLiked by 1 person
This is a good analysis and you are performing a great service by highlighting these issues. However, I think your focus on immigration (which you allude to here, but have been more explicit in other posts) is simplistic. All things being equal, population growth increases the supply of labour (as well as the demand), and given we have immigration policy settings that favour skilled/in-demand labour, you would expect that to boost overall productivity rather than dilute it. I think more important factors in relative productivity decline is government regulatory policy – particularly those that impact upon real wage costs (including minimum wage levels, increases in holidays, onerous health and safety rules, etc) but also broader compliance requirements.
LikeLike
I wasn’t trying to give the full immigration-policy hypothesis, and many of the issues and counterarguments are dealt with in articles, speeches etc here https://croakingcassandra.com/papers-and-speeches/ .
On your specifics, you might have hoped that immigration would have boosted productivity, but (a) the skill level of the average migrant is a bit less than that of the average native (see OECD adults skills data) and (b) it is hard for even the champions of current policy to find evidence for NZ of such effects. On my story, that is partly also about the opportunities here being so poor for anything outward oriented not founded in (fixed) natural resources. On the regulatory issues, I sympathise on all your individual items, but they can’t (even in aggregate) be the reason why our average productivity is now so poor relative to other advanced countries as, in most metrics, our regulatory or tax etc burdens are no worse than those of the median OECD country.
LikeLike
I note your point about relative skills levels of migrants. However, I still don’t buy the argument that poor productivity is mostly about immigration. Historically, that hasn’t been the case here (I’m talking about prior to the last few decades) nor in countries such as the US that had very high levels of immigration over many decades (i.e. 1850 – 1920). Given the right economic environment, countries can have very high levels of immigration AND strong economic growth.
LikeLike
Sure, not all poor productivity performance – even in nz – was about immigration, but my reading of NZ econ history suggests that if immigration has had positive productivity etc effects, that had not been so for the last 100 years or so. The US is an interesting case in that the fastest MFP growth happened to be (I’m not suggesting causation) in the decades when immigration was most severely restricted.
LikeLiked by 1 person
Having just been through the border controls of 6 countries on my Christmas and New Year holidays, the numbers of people involved in border control must be the highest in NZ.
Most of our border control on entry was mainly to subsidise farming exports. I encountered 2 border control staff spraying insecticide on passengers faces on landing, 5 staff checking passports, 5 staff checking food entry declaration forms after a massive logjam queue of annoyed tourists, 3 staff manning each X ray machine, with 5 active X ray machine that’s 15 staff manning each x ray machine plus 2 staff moving trays for the X ray machine. That’s a whopping 29 border control staff on entry into NZ. Make that 30, plus 1 more holding the leash of a sleeping sniffer dog.
LikeLike