I don’t generally watch or listen to Parliament’s question time. But my teenage son has finished school for the year and, being a nascent political junkie, turns on the TV each afternoon to watch the jousting.
I was doing something else yesterday afternoon when this exchange caught my ear
Hon Paul Goldsmith: Isn’t the most relevant current economic indicator the fact that New Zealand has the highest terms of trade in recent modern history and we’re still growing very slowly and running a deficit?
Hon GRANT ROBERTSON: We can all pick our most relevant economic indicator, but the one I want to leave with the member is this: we, as a country, are growing faster than the UK, Australia, Canada, Japan, and the eurozone. No country with which we trade or compare ourselves is growing how they were two or three years ago. We are ahead of the pack and we’re doing well as a country.
…
Hon Paul Goldsmith: Which of the countries he listed in the answer to my previous question are we growing faster than, on a per-person basis?
Hon GRANT ROBERTSON: On a per-person basis, I don’t have the information the member asked for, but what I can tell the member is this: when we came into Government we ranked 34th in the OECD on GDP per capita, and we’ve improved that. We’re up to 32nd and we will keep moving forward. On another measure that the OECD has in terms of per capita on real expenditure, when we came into office we were at 30th and we’re now 18th, so we’re making good progress.
That “34th in the OECD” I knew to be wrong. There are only 36 OECD countries and without even checking the others everyone knows Chile, Portugal, and Mexico are poorer than we are. I had a very quick look at some data and put it in this tweet.
I checked the IMF numbers because – with so many more members and countries in their data – being 34th sounded about right. Perhaps the Minister had his IMF and OECD confused: it certainly looked like a first for any Minister of Finance to be boasting that New Zealand was 34th (or 32nd) on anything in the OECD.
But out of curiosity I decided to take a closer look. There are, after all, both constant price and current prices GDP per capita measures, each converted at respective PPP exchange rates. And you’d have to be pretty sceptical of putting much weight on movements over just a year or two, give both measurement and conversion challenges.
The IMF numbers go back to 1980. Here is how our rank looks on these two measures and across time (2019 being an estimate/forecast).
| GDP per capita, PPP, New Zealand rank | ||
| Constant price | Current price | |
| 2019 | 35 | 35 |
| 2018 | 34 | 34 |
| 2017 | 34 | 34 |
| 2012 | 37 | 37 |
| 2007 | 40 | 40 |
| 2000 | 34 | 35 |
| 1990 | 31 | 31 |
| 1980 | 29 | 29 |
On these measures we were indeed 34th in 2017 – looks like that was what the Minister might have had in mind. But, if anything, there is a little slippage in the last couple of years. Over the longer run of data, there has been some improvement in our rank since 2007 – back then subsequently crisis-hit places like Greece, Italy, and Puerto Rico had got ahead of us (and Equatorial Guinea too) – but we are in much the same position we were in 2000. The significant worsening in our ranking occurred in the 80s and 90s, and there has been no consistent improvement since.
But our more usual comparators – the comparison the Minister claimed to be making – is with the OECD countries.
| GDP per capita, PPP, New Zealand ranking | ||
| Current prices | Constant prices | |
| 2018 | 20 | 21 |
| 2017 | 20 | 20 |
| 2016 | 20 | 19 |
| 2012 | 20 | 20 |
| 2007 | 21 | 22 |
| 2000 | 22 | 21 |
| 1990 | 20 | 21 |
| 1980 | 20 | 17 |
| 1970 | 11 | 12 |
It is mostly a pretty similar story. People most often focus on the constant price numbers. Again, if anything there has been a little slippage in the last year or two, but on these numbers our ranking is broadly where it was as long ago as 1990, and the real drop down the rankings occurred in the 1970s and 1980s (and no doubt earlier if the consistent data went back further). Those long in the tooth will recall that in 1990 we were about half way through the extensive reform programme – itself implemented in response to the deterioration in New Zealand’s economic performance – that was going to be lift us back up the OECD rankings. Shame about that.
But what about productivity? It wasn’t what Paul Goldsmith was asking, but it is the foundation of all sustained improvements in material living standards. Here is the OECD data for GDP per hour worked
| GDP per hour worked, PPP, New Zealand ranking | ||
| Current prices | Constant prices | |
| 2018 | 27 | 26 |
| 2017 | 24 | 25 |
| 2016 | 22 | 23 |
| 2012 | 22 | 21 |
| 2007 | 23 | 23 |
| 2000 | 22 | 21 |
| 1990 | 21 | 20 |
| 1980 | 19 | 17 |
| 1970 | 15 | 15 |
(I mostly refer to the constant price series, in all such international comparison on this blog this is “real GDP per hour worked”).
If I were a Minister of Finance I wouldn’t be boasting anything here. Then again, if I were the Finance spokesperson for the other party that governed New Zealand for large chunks of this half-century I’d probably keep quiet too.
The data are what they are, for now. That said, I don’t want to make much just yet of the apparent sharp fall in our ranking over the last couple of years (and even if it is for real, it isn’t yet this government’s fault any more than that of its predecessor – it is 2018 data and policy, or the lack of it, works with a lag). It both looks too bad to be true and we know that there are significant revisions being published tomorrow by SNZ which are expected to raise productivity growth a bit over the last few years. In the grand scheme of things, the differences are unlikely to be very large but a levels shift of 2 per cent – which might happen – would be enough (just) to lift us from 26th to 24th on the constant price measure.
On the data as they stand today, here are the 10 OECD countries with the next highest productivity and 10 (all the rest) with the next lowest.
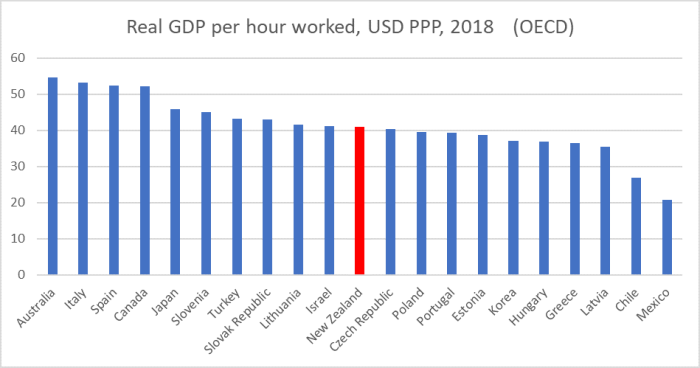
Three former communist countries are now ahead of us, as is Turkey, and the Czech Republic and Poland have had recent productivity growth records that mean they will almost certainly go past us in the next couple of years (even with New Zealand data revisions).
So, to revert to where this all started, what about the Minister’s claims
We are ahead of the pack and we’re doing well as a country.
No
when we came into Government we ranked 34th in the OECD on GDP per capita, and we’ve improved that. We’re up to 32nd and we will keep moving forward.
No. Hasn’t happened so far, and no sign things are about to improve.
And there was that final puzzling claim
On another measure that the OECD has in terms of per capita on real expenditure, when we came into office we were at 30th and we’re now 18th, so we’re making good progress.
I have no idea what he has in mind, but whatever he had in mind perhaps the Minister should keep in mind the old mantra that if a number sounds too good to be true it probably is.
Sure in cyclical terms the economy isn’t in a dreadful state. But in any longer-term sense we are underperforming, have underperformed for decades, there is no sign of any structural improvement underway now, and neither main party shows any sign of serious policy thinking that might finally – decades after those promises from both major parties – make a difference for New Zealanders. As things stand – and by reference to that final chart – if we just keep on doing policy as we have it isn’t inconceivable that in 2030 we could have the third lowest labour productivity in the entire OECD. Convergence with Uruguay may still happen.
UPDATE: In the House this afternoon the Minister made clear that he had been talking about annual growth in real GDP per capita. Per the OECD data – as it stands today, before significant SNZ revisions to be published tomorrow – New Zealand’s growth rate did rise from 34th (of 36) in the OECD to 32nd (the latter for calendar 2018). It seems very odd to boast about having the 5th worst per capita GDP growth among the OECD countries (and quite clarifying given the rhetoric the PM and Minister often use claiming New Zealand’s growth record is materially better than that of advanced countries we typically compare ourselves too). Clearly – given that this was an off-the-cuff response to a supplementary question – they’ve known the dismal (on official data) per capita picture all along.

https://www.odt.co.nz/opinion/free-trade-not-assured-path-economic-prosperity
LikeLike
Certainly no guarantee, but the author seems to have forgotten that we had something very unlike free trade for the period from 1938 to the mid to late 80s.
LikeLike
Can’t recall now, because it was so long ago and didn’t pay much attention to it at the time but NZ had a familial relationship with the UK who had been the mainstay of the NZ economy – and – then in 1973 the UK entered the EEC (European Economic Community) which pulled the safety net out from under us. The UK had been planning entry into the EEC since 1961. Not sure NZ did any pre-planning come the day it happened, probably hoping it wouldn’t happen, or alternately, the relationship would continue. when it did happen, Muldoon swung into action with “Think Big” when the un-written relationship evaporated
LikeLike
I think most people in New Zealand have given up on any expectation of returning to the front of the first world. We hear these comments from politicians and simply roll our eyes and say “whatever”…
LikeLiked by 1 person
Or they don’t realise how far we have fallen and are happy to swallow the ‘all is good and getting better’ line we have been fed for decades.
LikeLiked by 1 person
I suspect elements of both are true. But a decade or two ago, politicians would actually promise to get us back up the OECD rankings, now they don’t even promise it. I suspect the latter is worse – might be more honest in some sense, but it is consistent with just having given up. If so, they should step aside – or be pushed aside- in favour of people with a grounded vision, ambition, and a credible narrative of a better NZ.
LikeLiked by 1 person
Tommorrow I fly into France. Demonstrations and strikes everywhere throughout the country with scuffles with police, trains and buses are at a standstill. Hopefully I can even get out of the airport to kick off my European holiday. I am thinking NZ is such a wonderful peaceful place, just avoid NZ extreme vacations and try not to walk off cliffs or get lost on mountain treks.
LikeLiked by 1 person
The graph for Real GDP per hour worked is fascinating. I can imagine how Slovenes, Czechs and Lithuanians may well have reacted to the lifting of their communist economies with a determination to succeed. They had one advantage over NZ – they knew they had an economic problem to solve. Also no bureacratic inertia to overcome.
I am puzzled by Turkey’s comparative success. Clearly they have invested in education and Islam does give high status to science and technology and of course they have been able to exploit a large wealthy market in the Europe. However my knowledge of turkey is restricted to the neighbours we had a decade ago – a young Turkish couple arrived, stayed for four years, had two children and then returned to Istanbul. The woman not only didn’t leave the house but she kept her blinds down and windows shut. How can a modern society thrive without 50% of its brains being utilised? (For NZ that would be 51% of the population and 60% of the graduates).
LikeLiked by 2 people
It seems the leader of Turkey, while not having great institutions or great schools to work with, has simply made economic growth a priority, focusing on making themselves an attractive location for exporting into Europe. NZ’s leader value high house prices and kindness, so those two outcomes are evident in abundance.
LikeLike
Turkey must beat us in terms of kindness. They are playing host to 3.6 million Syrian Refugees which the Euro promised Euro 6 billion but reneged and so far only forked up Euro 2.5 billion. So far we have accepted around 1000 here in NZ out of the kindness of our hearts. We do put on a good show though.
“They are us.”
LikeLiked by 2 people
GGS: well said.
They probably expect their Syrian refugees to return home eventually. A survey I read a few years ago said most Syrians want to return home. We should be providing refuge for those who will never be able to return, the Yazidis for example. And then spending our budget on supporting about thirty refugees in a camp for the same cost as taking one to NZ.
LikeLike
Kindness, except towards the Kurds
LikeLike
Scotland
Population 5.438 million (2018)
GDP Gross Nominal $238 billion
GDP per capita $44,000 includes North Sea Oil and Gas
New Zealand
Population 4.8 million
GDP $300 billion (2019)
GDP per capita USD $41,500 (2019)
LikeLiked by 1 person
If I understand your update correctly – what is being referred to is the annual rate-of-change in “GDP per Capita”
Looks like another tabulation table is required
LikeLiked by 1 person
Yes, it could be done but one year’s growth rate doesn’t mean much, and anyway lots of the data will be materially revised after tomorrow’s SNZ release.
LikeLike
It would be great if you could review Banerjee & Duflo’s “Good economics for hard times”, as one of its conclusions is that there is no recipe for economic success, and economists should concentrate on smaller areas (well, that’s my reading).
LikeLike