Another post, probably the last, looking at some of the recently-released national accounts data.
First, a useful reminder of how much, relatively speaking, New Zealand benefited from the fall in interest rates over the last decade.
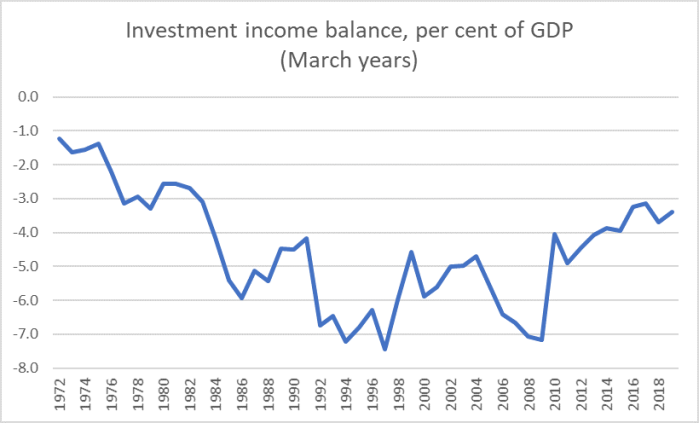
The chart shows the share of New Zealand’s GDP (the value of stuff produced here) that accrued to foreigners as returns on their loans to New Zealand residents or their equity investments here. When the chart starts, in the year to March 1972, the net international investment position (NIIP) was very small, and so were the returns to those who’d provided the funds. The (negative) NIIP positioned widened a lot over the 1970s and 1980s, and so did the servicing burden.
As recently as just prior to the last significant recession (2008/09) the equivalent of just over 7 per cent of everything produced here accrued (net) to foreign lenders or investors. That wasn’t wholly a bad thing of course: interest rates were cyclically because the economy was doing relatively well, and when the economy is cyclically strong profits – to domestic and foreign-owned businesses operating here – also tend to be high. One of the big transitions over the 1990s and 2000s was that almost all the net debt owed by New Zealanders abroad was, in effect, in New Zealand dollar terms, thus it was the NZ interest rates which affected the servicing cost.
As late as mid 2008, the OCR was 8.25 per cent. It was 1.75 per cent in the last year on this chart, and is 1 per cent now. That shift is the biggest contributor to the reduction in the servicing burden to around 3.5 per cent of GDP now. It is a significant shift: on average in the 90s and 00s about 94 per cent of what was produced here was available for local uses, these days something like 96.5 per cent is available. In a decade when productivity and real GDP growth have been pretty lacklustre, it is a saving not to be sniffed at.
I’m not here wanting to imply that the sharp fall in New Zealand (and global) interest rates is a good thing in and of itself. After all, New Zealand and global interest rates are likely to have fallen so much partly for reasons reflecting a reduction in perceived investment opportunities and a dearth of profitable (risk-adjusted) projects. But if that reduction has been fairly global in nature, at least all else equal as a country that had taken on a lot of foreign (debt and equity, although in net terms mostly debt) we’ve benefited from the unexpected collapse in servicing costs relative to countries which were net providers of funds to the rest of the world.
It was just one of several things that should have been going for New Zealand. Not only did the debt we’d taken on prove much cheaper to service than we’d expected, but the terms of trade (prices of stuff sold abroad, relative to the prices of stuff imported) also proved unexpectedly strong. There were real income gains from those direct effects, but little or none of it seems to have translated into, say, stronger business investment or any narrowing of the productivity gaps between New Zealand and the rest of the world. But investment was last week’s post.
What about consumption and saving?
Here is net national savings as a percentage of net national income (ie ‘net’= after deduction of depreciation from both sides, and “national income” is domestic product adjusted for net factor income flows accruing abroad – mainly the investment income shown above).
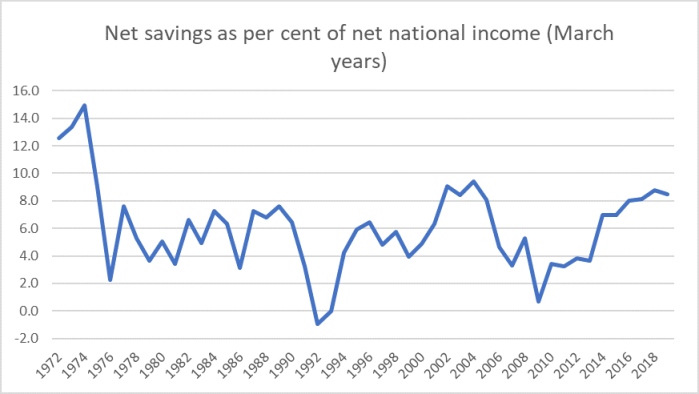
Net saving (from income) of New Zealanders perhaps averages a bit higher than it did over the period from the mid-70s to around 1990 (although in these earlier numbers there are some material inflation distortion), but the current cycle doesn’t look much different than the previous one, despite windfall income boosts discussed above.
The sectoral savings data are available only from 1987 onwards. Here is the household savings rate,
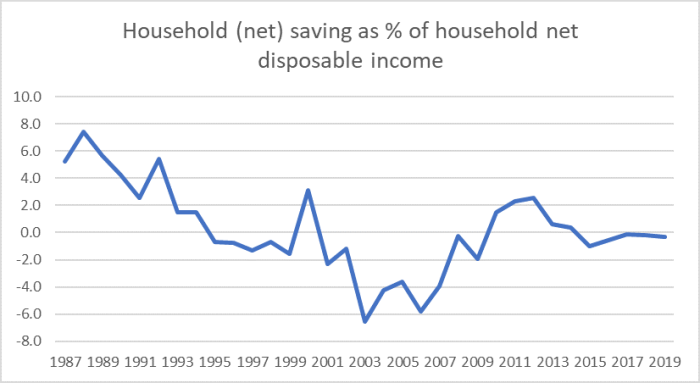
It has been quite stable for a few years now, although still around zero. For those convinced that somehow house price inflation is a material part of the household savings story, a reminder that the all-time low in this series was in the year to March 2003, and 2003 was the very first year of the 2000s surge in house price, subsequently built on in further rises in real house prices this decade.
And here are the two components of private savings, this time shown as a share of NNI.
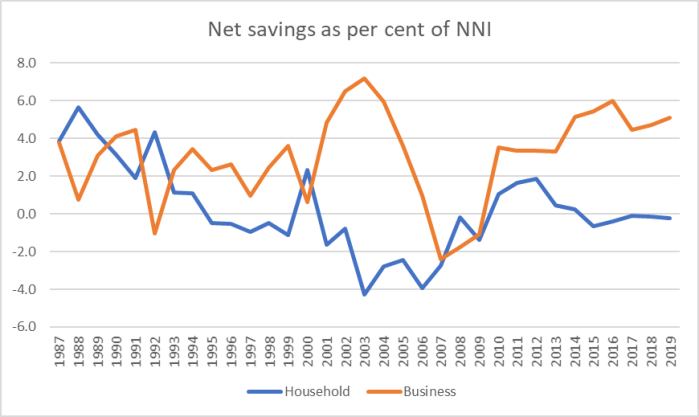
If (net) business savings are higher than they were (on average) in the first 20 years or so, they are still lower than the peak (year to March 2003 again) seen in the previous growth phase. Given that business investment has been pretty quiescent, one is left wondering whether, for example, the gap between company and maximum personal tax rates is encouraging owners to save in the corporate entity, rather than taking a distribution and saving personally.
And here is government and private (household plus business), again as a share of NNI.
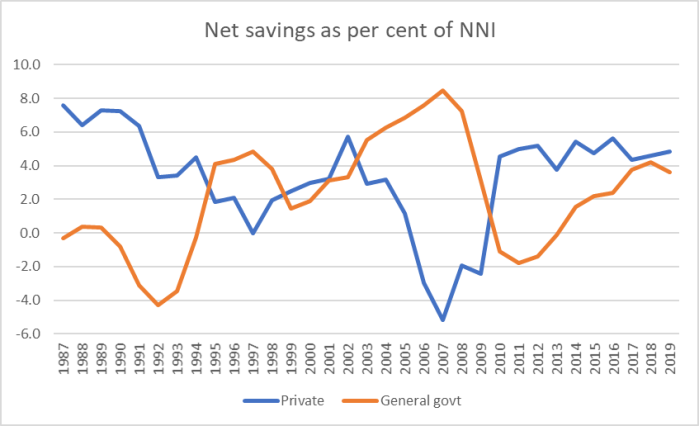
There is, pretty clearly, some element of offset in these two series – which makes some sense; when the government is running big surpluses, households in particular may not need to be quite as cautious – but that story shouldn’t be overstated. After all, the overall rate of private savings has been remarkably stable all decade, even as government saving was gradually getting back to more normal levels. Private savings rates do seem to have been averaging higher than they were in the 15 or so years prior to the last recession.
And on the other side, what about consumption?

We consume more than 90 per cent of what we (New Zealand residents, including resident companies) earn. But, if anything, that share seems to have been falling a little; in particular, last year private consumption as a share of NNI was the lowest in the 30+ year history of the series. So much for those stories about people consuming on the back of high/rising house prices: I’m sure it happens for a few people, but for the economy as a whole (where an increasing number of people can’t buy a home at all) it isn’t a thing, and that isn’t surprising because higher house prices don’t make us better off in aggregate.
And what about government consumption? There are two different types of consumption here: individual consumption (things government pays for but you consume directly, such as schooling and hospital services) and collective consumption (defence, law and order, and all those officials in Wellington head offices). Both measures, of course, exclude transfer payments (eg welfare benefits) to households.
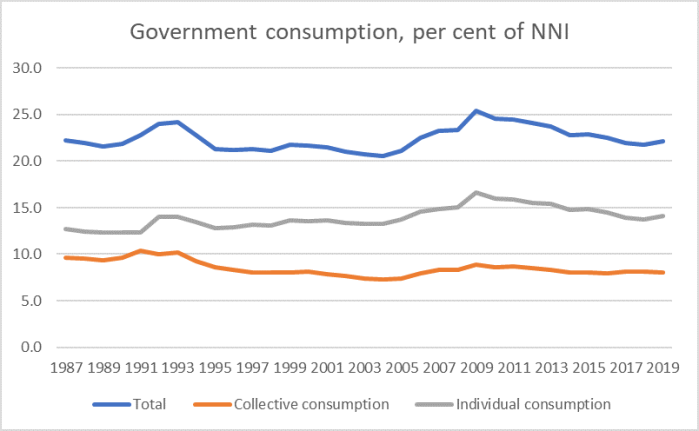
Focus on the blue line first. Despite the rhetoric from each side in politics, government consumption spending (as a share of income) hasn’t changed much in 30+ years, and the bigger changes look to be mostly cyclical in nature. Thus, Ruth Richardson and Jim Bolger weren’t greatly increasing government spending in the early 1990s; instead, there was a recession and government consumption spending tends to hold quite steady. Similarly, the last Labour government wasn’t slashing spending (the low point on the blue line is 2004), but the economy was quite cyclically strong and terms of trade were turning up. And so on.
But the orange line did catch my eye. Whereas in the late 1980s governments were spending almost 10 per cent of GDP on collective consumption – things more akin to public goods – now that share is only about 8 per cent. There will be all sorts of things going on inside that aggregate, and there may have been some reasonably material genuine efficiencies garnered over time, but….. I can’t help wondering if this number isn’t a little low. It is easy to highlight a lot of silly, pointless (except as something like virtue signalling) public agencies, which could quite readily be eliminated, but most of them are pretty small, often very small indeed. The amounts involved are also small. But look, for example, at the state of our national statistics – including the debacle of the last census – and you have to wonder. As even my fairly dry right-wing friends on the 2025 Taskforce noted a decade ago, things governments actually need to do need to be done well, and that involves spending money.
Then again, perhaps that is simply a Wellington perspective, born of mixing with public servants.
(It is perhaps worth noting in passing that when she made her schools spending annoucement yesterday, every second word from the Prime Minister seemed to be “investment” (or “infrastructure”). No doubt much of the extra spending will manage to be categorised as capital spending for government accounting purposes, and perhaps even as investment for national accounts purposes, but spending that doesn’t generate a return – in some form or another – is really just consumption, and interest rates can be as low as you like – typically for reasons having to do with a dearth of remunerative opportunities – but consumption spending still has a substantial cost (100 per cent of it) relative to which the interest costs are pretty second order.) Businesses undertake stuff categorised as “investment” with the intent (not always realised) of generating an economic return. Governments can often be less disciplined, motivated by different considerations, not excluding re-election.)

Sadly – The Ardern-Roberstson cash splash – the next failure
Where are all the trades-people? Are there enough
CoL infrastructure spend – $400,000 per school max is the approximate cost of building a new house – excluding the cost of the land. There are 2500 schools in NZ – if the best Kiwibuild could do was 300 houses, the Ardern-Roberstson cash splash can never accomplish its aims in two years – impossible
Compare The Edison Moment
Questioned about his 1000 failed experiments leading to his invention of the electric light bulb Thomas Edison was asked “what was it like to fail a thousand times”. He replied he hadn’t failed. He had “discovered a thousand ways it didn’t work”.
LikeLiked by 1 person
“Where are all the trades-people?”
The thing that gets me is that if we import 50k tradies to build the houses, they’ll need an additional 10K houses at the very least (@5 tradies per house ) just to accommodate them. That number is more likely 20K houses once you allow them to bring families. It’s clear to me that the mix of university educated versus tradies needs to change towards the latter to help us catch up, in addition to freeing up the land. At the moment the incentives appear to be for those who would flourish in trades to get degrees or diplomas in creative arts or sports science rather than something that will support the economy and their own prosperity. It isn’t clear to me that the huge number of business studies graduates are helping NZ businesses flourish
LikeLiked by 1 person
$4 billion in export GDP with every cent paid into the back pockets of small businesses from 60k equivalent full time students or 100k part and full time students is a pretty significant contribution.
LikeLike
Isn’t there a very large problem coming up with those savings figures? Surely, as from now we retire on the physical amount we put away, there is no return to speak of in the future, savings rates will have to go up sharply if we are not to have a retirement/pension price (or rather, a bigger one)?
LikeLike
Sorry, that’s pension crisis .. no idea where price came from..
LikeLike
Certainly a possibility. I wonder how much savings rate will respond tho, given that the rates of return are so much lower (ie, there are two offsetting effect, an income effect encouraging more saving and a relative price effect discouraging it – the latter being part of how int rate adjustment is supposed to work). Historically, private savings rates haven’t been very responsive to changing rates of return. I suppose my prediction is that we might see a small savings response, but that the bigger adjustment will be a continued rise in the number of old people working at least part-time, combined with fewer comfortable retirements.
LikeLiked by 1 person
I have started to increase my voluntary contributions towards Kiwisaver. I am getting a 12 month return of 11% on my contributions at the moment compared to 3% on savings deposits.
LikeLike
Hello Michael
I hope your calculations used real interest rates, not nominal interest rates. For years SNZ has overstated the size of the current account deficit and understated household savings by using nominal interest payments rather than real interest payments. This is despite the international SNA accounts recommending that countries use rea linterest rates to do these calculations. (OK, in fairness, almost all other countries disregard the injunction to use real interest payments rather than nominal interest payments – but the measurement error induced by using nominal rather than real interest payments is much higher in NZ than elsewhere because of the large overseas debt position.) The decline in average inflation since the high inflation rates associated with Governor Bollard is one of the reasons for the decline in nominal interest rates, and hence one of the reasons for the change in the incorrectly-measured household saving rate. Without even doing a back-of-the-envelope calculation, my guess is that 0.7% of the increase in household saving you note is a reduction in SNZ measurement error.
NZ economists have a strange attitude to inflation – almost all of them automatically adjust nominal GDP and other statistics for changes in prices (and thus quote changes in real GDP etc) but almost none of them automatically use real interest payments and receipts when calculating national savings or the current account or housing affordability. I have never understood why. The need to make this correction was understood nearly a century ago.
Andrew
LikeLike
Andrew
On this occasion I’ve just used the official (nominal) national accounts series, but did note somewhere in the post that the older data is in places distorted by inflation.
I entirely agree with your point and have made it myself elsewhere, but it is a non-trivial exercise to do the inflation adjustment consistently, and not one I had the time to do today (altho I probably should have included a bit more of a health warning re the savings and investment income charts).
LikeLike
I’m talking future returns from this point. This is off topic to Michael’s post, but the past decade’s global & NZ share returns are lunatic – the S&P’s 23% return just this year is the asylum (look at the macros) – and not based on fundamentals. That’s at an end now – at least, yes, Keynes was right, irrational markets can carry on longer than you think and can remain solvent, but they cannot carry on pricing in, for example, a trade deal between US and China weekly, then never taking that off the table when if falls over weekly. At some stage this stops, and when we return to reality, it will be a very different world and investment environment.
And afraid you’re not getting 3% on deposits unless you’re taking on a lot of risk for that 3%. Best you’ll do at a bank is 2.75%. And anything over 9 months is 2.5% to possibly 2.6%.
LikeLike
Oh, sorry, that was for ‘Get Great Stuff’ ‘s comment to me above. I thought I was posting back to same thread 😦
LikeLike
Given that my Kiwisaver is a Balanced growth fund, 40% will go back into savings deposit, 11% return is pretty good I thought. Yes I should indicate 3% and falling as the saving deposits mature and as a result an increase in my kiwisaver voluntary contributions. 10% with Harmoney would be risky. Not so much the 3% deposit with bank coming off maturity barring a OBR event.
LikeLike
Don’t forget investments is a zero sum game. There is a buyer to match a seller. Someone wins, someone loses. Not too sure whether you can call a market irrational. What is the alternative given that safe haven deposits returns are in a rapid decline. The share market increases just reflect a shift from savings to higher returns from risk based investments.
LikeLike
8.25% – hard to digest that OCR and perhaps harder to understand why ‘perceived investment opportunities’ went from an implied abundance to scarcity in little over a decade. I think there is something wrong about the ‘flow’ based saving and investment framework but I can’t put my finger on it.
LikeLike
I suspect there was an element of an idea that good investment opportunities were already falling away pre 08 but it wasn’t fully realised (eg US business MFP data shows a distinct slowing in productivity growth as early as 05). Which is not to say there are no puzzles, at a global and national level.
LikeLike