Yesterday’s short post – which countries were rich or highly productive in 1900 and which are now – wasn’t really about New Zealand at all (it was an article about the US and Argentina that prompted me to dig out the numbers). But it prompted a question about New Zealand from a reader that sent me off playing around with the relevant spreadsheets again.
The question was along the lines of when were we at our economic peak (relative to other countries) and, given that we no longer are what it might have taken, in terms of different growth rates, for us to match the leading group now.
As a reminder, for historical periods the standard collection of reference data is that by the late Angus Maddison. He collated estimates of real GDP per capita for a wide range of countries. The numbers are only as good as the estimates made by the researchers Maddison drew from. Perhaps they could be improved on – some researchers have tried for individual countries – but for now they are still the standard starting point. For more recent decades, I prefer to use real GDP per hour worked estimates (which will tell more about an economy’s productive performance, the wage rates it will support etc), either from the OECD or the Conference Board (the latter for a much wider range of countries).
My first chart yesterday was the top group as at 1900 – a date chosen just as a nice round number.
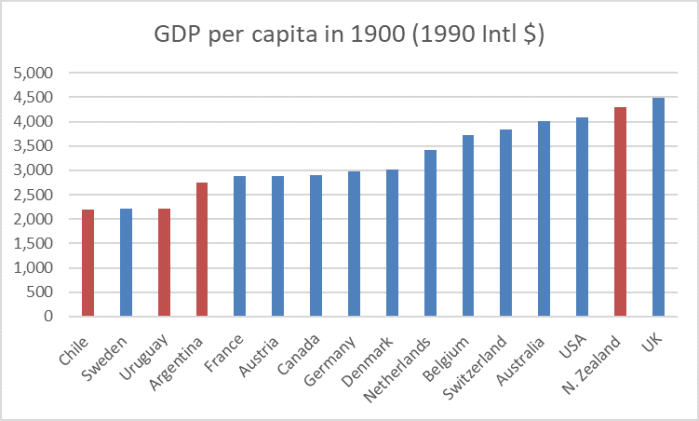
The top five countries on this chart were the top five pretty much all the way from about 1890 to just prior to World War Two. Here is how New Zealand did relative to (a) the median of those five countries, and (b) to the country that would emerge after World War Two as the clear leader, the United States.
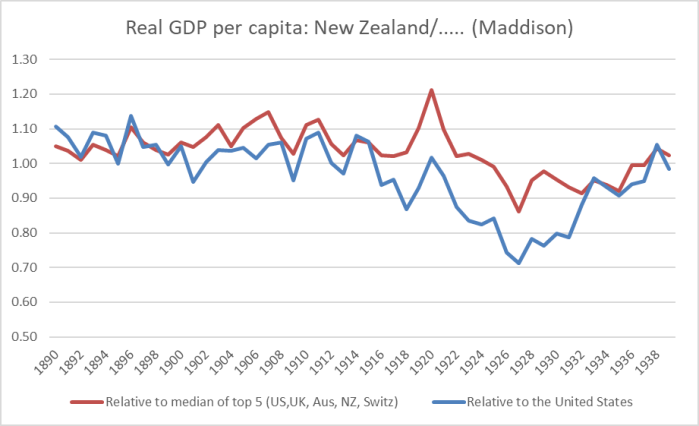
There is a bit of noise in the year-to-year estimates (particularly those for New Zealand), so I’m not putting any weight on that 1920 peak, But abstracting from year to year noise the picture is reasonably clear. Relative to this group of countries – highest incomes anywhere at the time – New Zealand did just fine in the quarter-century to the start of World War One. We were, there or thereabouts, right up with the very richest. On these estimates, the number one slot moved around among the UK, the US, New Zealand and Australia.
Wars are dreadful things. But they tend to be relatively less bad for countries producing food and wool, and not facing any physical destruction to their own country. Even better perhaps for distant neutrals, as the US was until mid-1917.
New Zealand’s relative decline in the 1920s is notable (and not inconsistent with a story I’ve run for some years, about the lack of any really favourable idiosyncratic productivity shocks favouring New Zealand based industries, of the sort we’d had in the 30-40 years prior to World War One).
But perhaps what is interesting is the recovery – especially relative to the United States – in the 1930s. In 1939, for example, we were basically level-pegging again with this top group of countries – a touch behind the US (No. 1), a touch ahead of Switzerland (No. 2).
Was everything then fine as late as the start of World War Two? I’d argue not. First, business cycles matters and don’t always run in phase across countries. The United States, in particular, was very slow to recover from the Great Depression. Here is the unemployment rate
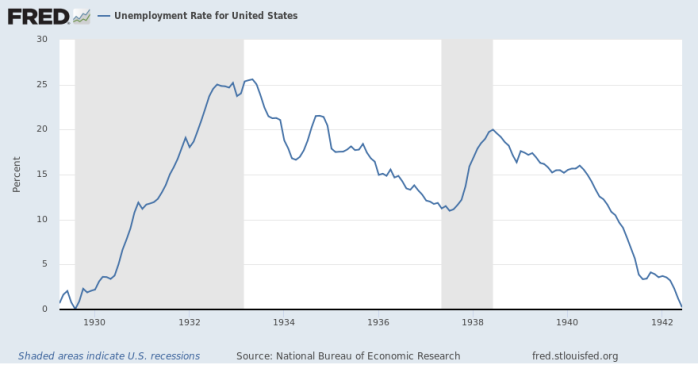
That is an unemployment rate in excess of 15 per cent at the end of the 1930s. In New Zealand, by contrast, the unemployment rate had been under 6 per cent as early as the 1936 census and the numbers registered as unemployed dropped away very sharply in the following few years, especially in 1938.
I was reading the other day an academic volume The Macroeconomics of Populism in Latin America, and was rather struck by the parallels between New Zealand in the late 1930s and some of the Latin American case studies (from the 70s and 80s). Most of those experiences ended very badly. New Zealand authorities were running very expansionary policies in the late 1930s which certainly boosted GDP and employment in the short-run, but culminated in the imposition of extensive foreign exchange controls at the end of 1938 and would almost certainly have ended in a highly public debt default in 1939 or 1940 if we hadn’t been – as it were – “saved by the war” (first, the British desire to avoid serious ructions in the run-up to the war, and then the intensified demand for our primary exports etc once the war began).
Consistent with that story is that after the war, when all three economies were pretty much fully employed – and none had been directly physically affected by the conflict – New Zealand’s GDP per capita was well behind (10-20 per cent depending on the precise year and country) those of Switzerland and the United States. Our heyday really had been the pre World War One period.
The second strand of my reader’s question really related to how far behind we now are.
Here was my second chart from yesterday, showing the top-20 real GDP per hour worked countries (from the Conference Board database) in 2018.
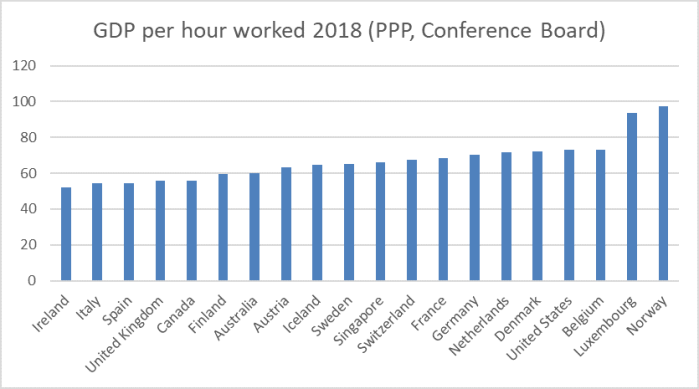
I’m happy to set aside Norway (markedly boosted by oil/gas) and Luxembourg (city state with some material tax distortions) and focus on the next group of countries (Switzerland to Belgium) I’ve highlighted here in various posts. On this measure, the median real GDP per hour worked exceeds that of New Zealand by 68 per cent.
New Zealand implemented a huge range of policy reforms in the late 1980s and early 1990s. The aspiration was to make material inroads on closing the gaps that had opened between New Zealand and the OECD leaders. Sadly, the gap has actually widened. 1990 is a common starting point for comparisons – not only was it well into the reform period, but it was just prior to the New Zealand (and other advanced country) recession of 1991, so comparisons are not messed up but that particular cyclical issue. In 1990, the median of that group of seven leading OECD countries was “only” 56 per cent ahead of New Zealand.
But what if things had been different? How much more rapid productivity growth (than we actually experienced) would we have to have had since 1990 to have caught up with this leading bunch? That is 28 years. We”d have needed productivity growth that was 1.85 percentage points faster on average, each and every year.
Would that have been possible? Who knows. 28 years seems a bit ambitious. But I did have a quick look at the data for some emerging OECD countries. Over the last 20 years or so, these countries have had productivity growth rates (on average over that long period) in excess of 1.85 percentage points above those of the median of that “leading bunch” of OECD countries: South Korea, Lithuania, Poland, and Slovakia.
Would it have been possible for us? Who knows? Would it be possible now, for the next 25 or 30 years? I don’t know. Personally, I’d be a bit surprised if we could close the gap that quickly, or fully. But for now we are still going backwards (relatively)…..as we have, more or less, for 100 years. And there seems no great sense of angst, unease or urgency among any of political parties, or the economic establishment.
What a diminished legacy for the next generation.

The decline of Anglo countries made me wonder about economic performance and anti-racist ideology which seems to outstrip economic management as a moral virtue?
LikeLike
Another question: thinking about an economy where highly competent people do very well at the other end have the “unemployable” increased?
LikeLike
AU GDP
Try this for granulation – as the population hasn’t decreased the per capita must be even worse – how’s NZ
LikeLike
They shut down Holden and Ford manufacturing plants? Out of work monkeys cleaning up after tourists?
LikeLike
I used to work for a Jewellery Manufacturer in Auckland. That was a time when the government thought it was more important to make things with highly skilled monkeys so that NZ was not so dependent on sheep. The business grew to a $10 million jewellery export business with EXGO government subsidies with a staff of 50 highly skilled monkeys making jewellery in NZ and competing with the very best jewellers around the world.
These days our government thinks it is more important to gift $400 million a year towards racist Treaty of Waitangi social welfare payments which go back towards buying more farms, $900 million to strip babies from their parents and a billion dollars to managing farm diseases.
LikeLike
Perhaps your productivity charts should be measuring the $17 billion GDP produced by 10 million cows versus the $75 billion GDP produced by 3.5 million monkeys in Auckland?
LikeLike
Approximately half the countries in conference board graph are either Scandinavian or near the Arctic Circle – the warmer countries suffer from siesta syndrome – must be a climate-change global-warming feature
LikeLike
This is a fascinating article, thank you. A couple of thoughts:
– All of the countries that dropped back were “new world”, in the sense of being undeveloped areas of the world that became nations through colonisation. How much of them their early 20th century peak is an inherently temporary blip, as small numbers of people exploited latent economic opportunities, and what we see now is those countries falling back to a longer run normal? A version of this idea (with a different take on how the growth is used) can be found in Les Oxley’s work on New Zealand.
– On that view it is Australia, and to a lesser extent, the US that need explaining because they have not dropped back.
LikeLike
Hi Tony
Your suggestion lines up with my story (altho you could thrown in periods of extreme political instability to the Latam explanations). In the NZ context, it is why I’ve come to think the large scale immigration our govts have promoted for most of the post WW2 period (exception from 73 to the late 80s) was mistaken – there are few good opportunities here for lots of people.
Re Australia, I think they have gone in the same direction – from the top handful in 1900 to the 2nd X on my productivity chart – but haven’t fallen as far because they were willing/able to exploit a whole lot of natural resources that they either didn’t previously know were there, or it wasn’t economic to exploit. Without that, their overall story would probably be NZ’s.
But it does, as you suggest, leave the US (and to a lesser extent Canada – the latter never in the top handful and still in the top 20. Perhaps some mix of critical mass (most of Canada’s population and economy is within 100 miles of the US) and remoteness not being such an issue?
LikeLike
The need to “run to stand still” takes me to a different place on immigration. Geography means we are doing well to keep up with other rich countries until we can find that productivity increase. The analysis Nick Carroll did for the Treasury in 2011(?) makes a convincing case that we are achieving that (low) bar. As you note in previous posts, a lot of that growth is simply increased population. Together I read that as immigration protecting us against endemic deflation. It is an unsatisfactory second best, but until someone demonstrates a better way is actually working, I suggest we stick with what has not failed.
LikeLike
Simple answer is we ran out of land and water for more cows to increase productivity. NZ is at peak cow with 10 million cows.
LikeLike
Many thanks for the post Michael – interesting stuff!
It looks to be almost (the 1920 blip notwithstanding) exactly a 100 years ago that New Zealand ‘peaked’ in relative prosperity/economic performance.
That is a serious indictment on New Zealand’s political class/establishment that this lack of competitiveness and productivity has been allowed to continue.
Some questions that naturally arise are how long might Australia’s relative prosperity continue before they too fall behind?
As well as what is it that makes the United States and some Northern European economies so productive/special?
Thanks again
LikeLike
Simple answer is that they have factories that can be automated, we don’t.
LikeLike
Reading the article and the comments and there seems little agreement about the factors that have led to NZ’s productivity decline. So consider an equivalent issue where NZ has remained preeminent: Rugby. All the same issues about being a small remote country apply. It is not too difficult to understand how NZ became the top country about the same time (1900) that we were a leading economic country: the exceptional health of its people resulting from then exceptional agriculture productivity in a healthy environment.
So why has NZ stayed at the top of world rugby for 120 years while other countries have progressively fed their population better and removed unhealthy working conditions and expended serious effort at both their economic and their sporting productivity? The answer is obvious to a newcomer it NZ: rugby is the passion of most of this country; children grow up with rugby heroes and adults dedicate their free time to supporting innumerable small rugby clubs. There is a passionate commitment to the local team and the ambition of every young player is to become a member of the All-Blacks.
The conclusion is simple: rugby succeeds because of the level of commitment is higher than other countries. Even those countries that have natural advantages with population size, wealth of sponsors, sport scientists, etc. If NZ wants hourly productivity that matches the best then we need the same level of commitment to productivity. If we chose our immigrants and invested in them the same way we carefully select young Fijian rugby players then we might be doing well. The same willingness to invest in many over many years for the potential success of a handful, the same pride in local success and in national success.
If the All-Blacks lose tomorrow most of the nation will be in grief; if we win but then lose to Australia we will enter a state of national woe and anger. The fact that friends who work as builders in Queensland earn far more per hour than they did in Auckland doesn’t disturb anyone of significance in New Zealand. When it does we have a hope.
LikeLike
I think you have missed the point entirely. We are not comparing people with people in terms of productivity. We are comparing adding cows in NZ to increase productivity and they are adding industrial robots to increase productivity. There is no chance until hell freezes over for us to come even close to matching their productivity.
LikeLike
GGS: I think you haven’t understood my point. You regularly produce serious points related to NZ productivity [which I understand to be total GDP divided by total hours worked]. So do many highly qualified economists. However the general public is uninterested in the discussion. You would only have to post something on a sports website saying the All-Blacks performance correlates with milk powder (+ve or -ve) and you would be inundated with comments by the thousand and every pub in NZ would be discussing your opinion and questions would be asked of ministers in the Beehive. Sport matters in NZ so we are good at sport; economics is of little interest so our economy lanquishes.
As it happens your point about investing in automation and NZ’s failure to do so must be important. But the discussion seems to be just you and me whereas Sonny Bill has a headline in todays newspaper about his religion being accepted by the All-Blacks that will be read by hundred of thousand New Zealanders..
LikeLike
Bob, I do understand your point. You are still thinking in terms of their human productivity against our human productivity. Our key GDP production is by farm animals and in many other countries, their key GDP production is by industrial robots. In both scenarios humans only play a small role so a comparison of human productivity is wrong. This also means our economists are highly qualified but clueless.
To be a fair comparative the different industries need to be weighted. The reasons for our lack of productivity is because we do not have factories to automate. It is as simple as that.
LikeLike
The data is even more skewed nowadays because for many products globally, the factories are in China. For example a US company like Apple, it’s products are manufactured in China using a factory with thousands of human workers, but Apple reports it’s revenue around the world in the US stock exchange which means the human headcount is just the head office, product design and sales. US productivity is massively high because it’s factories are in China and Chinese headcount does not get counted in US productivity. China’s productivity is low because it uses mega factories full of thousands of humans to produce for the US market.
LikeLike
For New Zealand to disappear from the list altogether, one has to wonder what happened. Something happened. what was it ?
This is my view. I’m no authority, but a fair bit of the following is true
Prior to 1960 the bulk of dairy farms were family businesses, farming 100 acres with 70-90 cows. Some farms were classified as town supply, supplying milk to the urbanites, the rest were cream farms, milking their cows, separating the cream and feeding the skim milk to 50 pigs, and selling pigs to the abattoirs. New Zealand did not export milk powder. The main product was butter which was exported to Great Britain in some form of protected-paternalistic arrangement. Chilled and frozen lamb was also included in the protected deal. Ever since the 1800’s
Then, in 1970’s Great Britain joined the European Union. The sweetheart deal NZ had enjoyed was discontinued. At that time the EU operated CAP (common agricultural policy) subsidy scheme under which French dairy farmers could milk 5 cows on 2 acres and make a living. NZ lost its privileged protection. In response NZ pursued its own subsidy schemes of fertiliser subsidies and butter subsidies. I do not know what pressures came about that caused NZ to form Fonterra in 2000 and start producing and exporting milk powder
New Zealand prospered under the Great Britain umbrella. It does not seem to be prospering under the milk powder business. It is not prospering form corporate dairying of 1000 cows. The European Union still operates a revised CAP subsidy scheme to this day
Perhaps in the fullness of time with UK tearing itself apart over Brexit and its stated intention to enter trade agreements with New Zealand and Australia the good times may return
LikeLike
Our Free Trade Agreement with the EU comes through the UK. Once Brexit occurs we lose our FTA with Europe. Current negotiations with the EU has recently stalled mainly due to our sizable primary industries. Of course our Farmers argue that EU subsidies prevent us from entering the EU market because we are efficient primary producers. That is a load rubbish. Our NZD trades at more than 40% discount to the Euro. It is a massive unfair pricing advantage.
LikeLike
Interesting to compare Helen Clark’s train speeding down the track in 2005 with Jacinda’s in 2019 as we near our destination ?
https://www.nzherald.co.nz/nz/news/article.cfm?c_id=1&objectid=10009083
LikeLike