For several years now I’ve been complaining about the inadequacies of MBIE’s administrative immigration approvals data. It really should have been easy to have this data readily available (including in SNZ’s Infoshare platform) very quickly: we manage it, for example, for building approvals. But it hasn’t been.
For a long time, the public was supposed to be content with the annual Migration Trends and Outlook publication. It had a lot of interesting and useful data but (a) it was only available on an annual basis and (b) the lags were quite long. They also made available gigantic spreadsheets which might have been readily useable for those with programming skills or the right software, but for humbler analysts required a significant investment of time to extract the simplest numbers. And then those spreadsheets themselves were withdrawn – they discovered, belatedly, some privacy issues. They in turn were replaced with big PDF documents in small fonts where you could find some of the data updated each month, but still with an annual focus (thus they report year to date data, rather than monthly data).
There is progress afoot. MBIE has spent a lot of time and resource developing a Migration Trends Dashboard which will, when it finished, finally get us to the point of having timely, useable, monthly data, seasonally adjusted where appropriate. The sort of standard we’ve long expected for other major statistical series. I’ve been invited to a couple of consultation sessions with them as the product has been developed and although the dashboard has not yet been formally launched they’ve told me they have no problem if I run some graphs here from the dashboard. (Because it isn’t yet officially launched, and it doesn’t yet work with all browsers, I won’t link to the dashboard here, but if anyone really wants the link to have a play with the data, email me – address in the “About Michael Reddell’s blog” tab.)
This is the sort of thing that will be readily available: residence approvals by application stream.
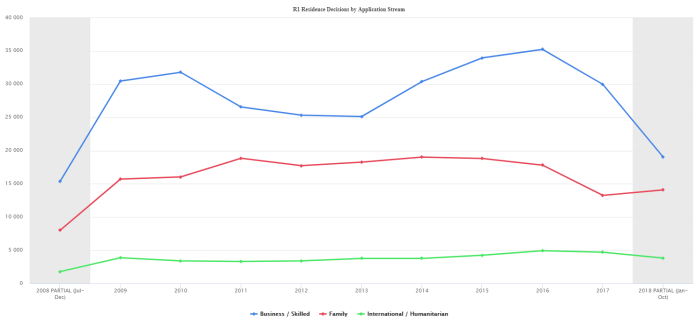
This is calendar year data, so note that the final observations are only for 10 months. But even if you scale those numbers up (by 6/5) what is unmistakeable is how sharp the reduction in the number of residence approvals granted in the business/skilled streams – centrepiece of our economics-focused immigration programme – has been. I wrote first about this development a couple of months ago, somewhat puzzled by quite what is going on – given that there was a small reduction in the residence approvals target last year, but nothing subsequently.
Unfortunately – I guess it is still a prototype – the November numbers haven’t yet been loaded in the Dashboard, so I had to go back to the more timely – if less wieldy – big PDFs, where the data is in financial year (to June) format.

I’ve annualised the five months of data we have for 2018/19 to date. At present approval rates we are on course for a slightly lower rate of approvals in 2018/19 than we had in 2017/18 – both below official announced target (centred on 45000 approvals per annum). Those would be the lowest number of approvals this century to date.
I remain a bit puzzled quite what is going on, and I’d have thought someone should be grilling the Minister of Immigration for answers. There is an official target and it is not even close to being met.
Here is an update of a chart I ran a couple of months ago of the nationalities of those granted residence approvals (again the 2018/19 numbers are annualised).
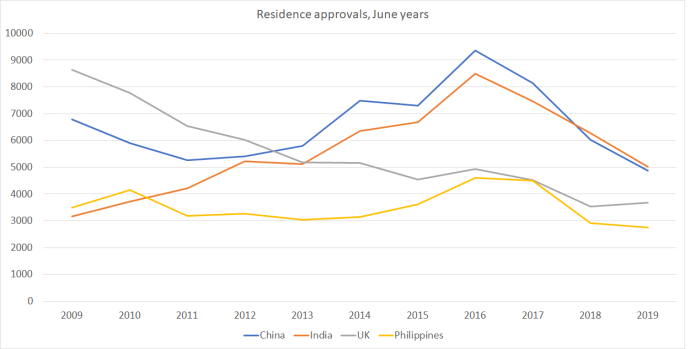
What is striking is the reduction in the number of Indian and (even more so) Chinese approvals.
As I noted in the earlier post
I’m puzzled. And, of course, I’ve spent years calling for a reduction in the residence approvals target, so in one sense I’m not unhappy to see the reduced numbers. But I also strongly favour open and transparent policy, and there has been nothing announced suggesting that we should have been expecting – or that the government was seeking – such a large reduction in the number of residence approvals being granted.
And the number of points required to get residence is supposed to operate as a quasi-price: if too many “good” applicants are applying, the logic is supposed to be that the points threshold is raised, and if not many applications are coming in, the points threshold is supposed to be lowered. But I’m not aware of any steps having been taken – lowering the threshold – this year.
One possibility is that although the government was not willing to openly take steps to reduce the inflow of (permanent) migrants, they (or at least parts of the government) were not unhappy if the inflow declined anyway. And even among those champing at the bit for lots of migrants – one might think of the Prime Minister – perhaps there is some unease that announcing a reduction in the points threshold might reawaken a debate about the relatively low-skilled nature of many of our (notionally) skilled migrants. These, after all, were the top occupations for the skilled migrant principal applicants from the most recent Migration Trends and Outlook.
| Main occupations for Skilled Migrant Category principal applicants, 2016/17 | ||
| Occupation | 2016/17 | |
| Number | % | |
| Chef | 684 | 5.7% |
| Registered Nurse (Aged Care) | 559 | 4.6% |
| Retail Manager (General) | 503 | 4.2% |
| Cafe or Restaurant Manager | 452 | 3.7% |
And finally, a couple of other snippets of what we are better able to see with the new Dashboard. This chart shows the number of first-time student visas granted to people from each of the two largest markets, China and India.
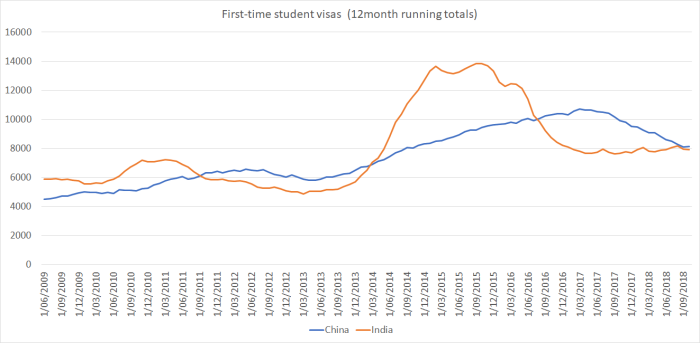
I’d been aware that Indian student numbers had fallen sharply, although the numbers there appear to have stabilised. The China market, however, is much more important for our universities and I hadn’t been aware that the number of first-time visas for PRC students had also been falling away for a couple of years now; so much so in fact that almost the whole of the boom has reversed. No doubt the Vice-Chancellors will be even more concerned to keep pressure on the government not to say or do anything that might upset the regime in Beijing, no matter how egregious it is.
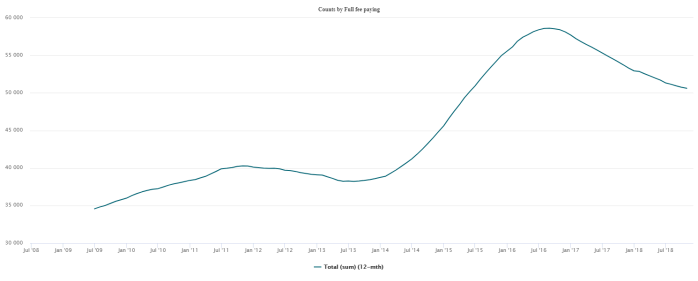
That chart is about flows – first time arrivals. The stock of foreign students takes longer to adjust, but here from the Dashboard is a chart of the stock of full fee paying student visa holders in New Zealand.
And last of all, this is the stock of people in New Zealand with current work visas. Whatever is going on around residence approvals, the number of people with short-term work visas continues rise pretty strongly (although, interestingly, when I dug down a little, the number of people here on working holiday visas has fallen back a bit from peak).

When it is finished, MBIE’s new dashboard will be a significant step forward. Even now we are beginning to get more information, on a more timely and accessible basis. That is welcome. But the better data unables us to pose some as-yet-unanswered questions including (particularly) just what is going on with the centrepiece of our immigration policy, the residence approvals programme.
(And while I’m awarding ticks – well half-ticks anyway – for this data, we shouldn’t lose sight of the loss of the data about the comings and goings of New Zealanders.)

“” then those spreadsheets themselves were withdrawn – they discovered, belatedly, some privacy issues “” – can you find out and publish what those ‘privacy’ issues are? I’ve been puzzling about them for a long while.
I liked the bulk data because it permitted mining data. I was delighted to discover the male / female ratio was balanced even from very male dominated countries. I also discovered that the often expressed fear that elderly Asians are claiming superannuation and other benefits without having paid into the system was exaggerated at least for most of the last decade since there were very few resident visas approved. It also revealed a massive bias pro-Chinese and anti-Indian in the investor category which other readers may be able to explain – certainly Indian entrepreneurs have been very successful in creating thriving businesses in the UK.
Your conclusion states “” just what is going on with the centrepiece of our immigration policy, the residence approvals programme “” as if you thing rational thinking is involved. I doubt it.
At the heart of every department of Immigration should be one basic question: “Is this good for our country”. In the case of refugees the ‘good’ is in our matching best international standards and in the best use of our taxes for international charity. For non-refugees then the criteria may be somewhat varied – a great sportsman or artist adds to our reputation but may not have a clear financial benefit but in the main it is simply will this applicant create wealth well above that of an average New Zealander?
The more I study immigration the more I beome cynical about its aims. My thoughts tend to house prices, cheap fast food and blaming foreigners when worker exploitation occurs.
LikeLike
From memory they mentioned something about (some of) the refugee approvals. In principle, one the dashboard is fully operational everything that was in the spreadsheets will be (in aggregated form) on the dashboard – including, I’m pretty sure, all the items you mention.
LikeLike
I wait to be impressed by the dashboard.
The history of mankind can be broken into four significant steps:
1. The cooking pot
2. The wheel
3. Logarithms (John Napier was criticised by his Edinburgh professor for his making maths too easy)
4. Spreadsheets
After 30 years of using spreadsheets I’m biased against the diagrammatic representation of data – it is too easy to distort. For example the living standards framework seems to be a bag of worms. See
https://treasury.govt.nz/publications/tp/living-standards-framework-introducing-dashboard-html
Even you own graphs aggravate me in not always showing the zero line (often for good reasons related to PC screens) so a glance at your “stock of full fee paying student visa holders in New Zealand” for the last ten years would suggest that numbers have more than doubled.
LikeLike
on the dashboard you can download the data itself
LikeLike
The questions I would like answered are:
1. What is the average wage of a NZ resident 5 or 10 years after attaining residency? Since my concern is low wage residents (those most likely to be involved in exploitation & corruption) the figures for the each quartile would be interesting.
2. How many refugees are from minorities who will never be able to return home? For example the recent influx of Syrians – are they Sunni (Arabs, Kurds,Turkmen/Turkoman, Circassians), Shi’a (Alawites, Ismailis, Imamis, Alevis), Druze, Christians, Jews or Yazidis? My concern is that some of these minorities may never be able to return home where they experienced murder and rape from their neighbours and these should be our refugees however many were too scared to register with the UNHCR refugee camps in Jordan. [I’m not against Muslims and have no issue with Ismailis who have suffered persecution in many Muslim countries nor the unfortunate Rohingya.]
I will praise the dashboard if it gives answers to those kind of question.
LikeLike
Fair questions altho not ones the Dashboard is designed to answer. There is a lot of other immigration research going on, including about incomes (relative to NZers) -from memory, Brits and S Africans get to NZ levels v quickly, and other groups (even in aggregate) can take decades.
LikeLike
Bob – try the Longitudinal Immigration survey from about 5-6 years ago – that has some interesting results – http://archive.stats.govt.nz/tools_and_services/nzdotstat/tables-by-subject/longitudinal-immigration-survey-new-zealand-tables.aspx
See also this interesting piece (a little bit out of date) https://ethniccommunities.govt.nz/sites/default/files/files/LanguageandIntegrationinNZ.pdf, particularly figure 2.3, which shows that migrants with moderate-poor English ear almost half that of migrants whose primary language is English.
LikeLike
more granular data needed
Several months ago listened to a debate about the shortage of drivers in the Heavy Haulage industry. There are 30,000 HT drivers driving heavy rigs on NZ highways. There is currently a shortage of 2500 drivers and the industry nabobs (National Road Carriers Association) and (Road Transport Forum, the industry’s main lobbying arm) are looking to migrants or work visa applicants to fill the void. INZ says in the two years to March 2018, 1591 foreigners applied to drive trucks in NZ. They are paid $17 per hour and work up to 3500 hours per year and earn up to $70,000. The costs of entry (into the drivers club) are prohibitive – it costs more than $1000 and a lot of hours to obtain a licence. It’s easier to bring them in already trained and licenced
https://www.radionz.co.nz/national/programmes/insight/audio/2018672554/difficult-and-dangerous-why-truck-drivers-are-quitting
The debate revolved around the rate of pay. Was $17 per hour reasonable. Would it be better economically to raise the hourly pay rate (across 25,000 driver) while encouraging locals to enter the industry or keep bringing in foreigners mostly into Auckland who immediately increase the demand for rental accommodation which in turn produces a domino effect on rents right across the rental industry by adding to demand and raising the rent halo on all rents
“Mr Abbott says whenever there is a driver shortage, Immigration New Zealand allows companies to bring in more drivers, regardless of the rates they pay, as long as they meet minimum requirements”
LikeLike
Iconclast: seems like a clear example of what is wrong with NZ Immigration and yet further proof that INZ is dominated by vested interests (weirdly I begin to sound like a socialist but Jarrod Abbott of First Union is making sense and our politicians are not.
If you can search the 3rd world for employees and have a competant HR department you will find some great workers. Many will love NZ and bring up their family here and produce the next generation of loyal New Zealanders. Which sounds good until you realise the lesss than 10% immigrant drivers will be holding salaries down for the over 90% New Zealand drivers. This benefits business but not NZ citizens nor our Govt tax revenues.
The side issue that concerns me is the possibility of desperate immigrants paying back-handers for the opportunity of getting work in NZ. This is bad; it is bad for the employee and it is bad for the honest employer trying to compete and it is bad for the concept of respect for NZ laws.
So it is clear that INZ should not be allowing haulage companies an easy supply of immigrant workers. However there certainly are many situations where bring in an immigrant makes sense and is clearly good for both the immigrant and for New Zealand. For example a specialist skill such as a cancer surgeon or expertise with new software critical for a major engineering project. So how can we distinguish between jobs that just need a pay rise and maybe increased training colleges and jobs that can only be filled from overseas? Micheal Reddell has suggested in the past that employing immigrant workers should involve a work permit charge. It is done in other countries and I know when my employer was paying for my work permit they gave training local staff the highest priority.
If haulage companies could quickly and easily employ foreign truck drivers but they cost $20,000pa for work permits then we would see salaries increase and training expanded. Note the quickly and easily – at present the main obstacle for immigrants is our turgid bureacracy which is a fine means of repelling the able and allowing in the corrupt. Sequence should be (1) post a bond, (2) arrive & start work, (3) complete the paperwork medicals etc for approval – fail and the bond is kept by NZ (4) bring in family members if appropriate.
LikeLike
“This benefits business but not NZ citizens nor our Govt tax revenues.”
I do not think Govt Revenues would be too severely affected as a reduction in wages for workers as it equates to a equivalent increase in earnings of business owners who are usually NZ citizens anyway.
Eg, I employed a accounting staff member on a Foreign work Visa for $40k replacing the previous migrant with a residency Visa on $65k who have returned to China and now working for a US company in China. Govt revenue has actually increased because my NZ Citizen employer pays tax at 33c compared to a person earning below $70k who has an average tax graduated tax rate of 20c.
LikeLike
Immigration now wants a minimum of $52k as a cut off pay for the application for residency under the Accountants skilled migrant category. I had just increased one of my foreign worker accountants to $51k. Now I have to look at moving that to $52k. That’s another $1k that my poor NZ citizen employer will not get in his hands to spend. No wonder he seems to be having a tough Christmas. More joy for migrant workers and less joy for NZ citizen employers. What a wonky immigration policy.
LikeLike
You make some valid points; my argument is there are many accountants employed in Auckland (my wife is one) and an immigrant happily taking a lower wage tends to affect all accountants. That extra $1k makes it just a little less likely that you are accepting a back-hander to employ your new work-visa accountant. It is the $3 an hour ‘chefs’ who work in Highbury that bother me.
What would be the cost of a work permit that would encourage you to finance the training of New Zealander accountants?
LikeLike
No, the other option offered to me which I am trying very hard to avoid is to outsource the accounting work to the Philippines at a cost $10k an accountant.
LikeLike
Ref the possibility of having accounting work done in the Philippines. It was a long time ago when I worked in PNG and they had about 40 expat positions for accountants mainly from the UK, Australia and New Zealand; within a decade all those positions were localised; partly the introduction f computers and mainly tertiary education and then internal training. We had a couple of excellant Filipino accountants and I asked why not more and was told there were two problems (a) variable quality – you couldn’t trust the agencies supplying them (b) most were reluctant to train national staff – they were desperate to keep themselves employed.
That was 30 years ago and much has changed especially excellent communications so maybe you should cautiously consider the Phillipines option. Is it any different to buying clothing made in Asian countries because it is cheaper?
LikeLike
Whenever I think of MBIE I think of Nigel Latta’s New New Zealand. They are there to protect the immigration industry (for want of a better phrase). Then there is Superdiversity Spoonley signing a deal to dig up the good news on Auckland. To think we pay their wages.
LikeLike
Michael – any comment on this?
Opinion: We need growth – but there’s a limit
http://www.scene.co.nz/…/opinion-we-need-growth-but-theres…/
If visitor numbers were to remain static there would be no new investment in the town and eventually our facilities would deteriorate badly. Likewise, it needs to be remembered that everyone employed or in business in the district, directly or indirectly derives their income from the tourism industry. It is our lifeblood and it would be dangerous to consider forcibly curtailing any further growth.
………..
Does this mean the resort doesn’t generate enough income to cover depreciation?
I said at the outset of my mayoralty that we were needing to play catch-up for a lack of investment in previous decades. We are clearly doing this and pushing partner agencies such as NZTA, ORC and central government to invest in the district
…………
You mean people have taken their massive capital gains and done a runner?
http://www.stuff.co.nz/…/…/Developers-slam-land-tax-proposal
LikeLike
Does seem pretty incoherent – perhaps not overly surprisingly so.
LikeLiked by 1 person
I saw Shamubeel Eaqub being met at Queenstown Airport (definitely not a union rep or Corporate Cabs). I assume for a conference or Chamber of Commerce. I wonder how Mr Progressive would spin the situation? One third (?) of the workforce are foreigners and they are squeezed into rental accommodation while real wages are falling in the sector.
Meanwhile house prices in Arrowtown are rocketing.
LikeLike
Actually very coherent. It is very clear to anyone that has invested in infrastructure. There are 2 ways to approach your investment as it ages. You can go for full replacement or you can maintain. In a growing market where value increases you would replace.
In a flat or falling market you would just repair and maintain. Of course every repair is essentially a patch job and the more patch jobs your investment would look old and patchy compared to brand new.
Depreciation as a taxable expense does not equate to cashflow so it is not sensible to say that income does not cover depreciation. Depreciation equates to only 28% reduction in the tax you have to pay on your income.
LikeLike
Its very simple maths. Say you buy an oven for $1,000. Depreciation a year for example is 20% a year and fully depreciated in 5 years. The amount claimed against your income is therefore $200 a year but the actual cashflow effect is only $56 a year in tax not paid on your income at 28% company tax rate.
Therefore over the 5 years your cashflow savings is only $280 from initially spending of $1,000. In other words after the full 5 years you can put away only $280 for a new oven from depreciation but you actually need $1,000. Rather a big shortfall to invest in a flat or falling market??
LikeLike
Michael I find this point interesting:
http://www.treasury.govt.nz/publications/research-policy/wp/2014/14-10
Geoff Simmonds of TOPS is arguing that Brexit and Trump are due to a lack of productivity growth. But avoids talking about immigration and the context of no improvement in the lives of nationals while faced with rapid demographic change and loss of identity.
https://www.top.org.nz/what_new_zealand_can_learn_from_the_rise_of_trump
On immigration policy they argue: We need to focus on skilled people that are looking for a more liberal and tolerant society in the wake of Brexit, Trump and the march of ugly nationalism engulfing Europe. We must seize this opportunity to make New Zealand the place where ‘talent wants to live’. Why “talent”? Because it creates jobs and incomes for New Zealanders. While admitting There’s a big downside from too many migrants, particularly if they are working in low-skilled jobs.
https://www.top.org.nz/top2
He almost seems to make the ugly nationalists case but fudging paradigms doesn’t help clarify thinking?
LikeLike
I read the first quote as limits to growth?
LikeLike
“developed”. Like a tree only likely to grow so big given present technology.
LikeLike
“” There’s a big downside from too many migrants, particularly if they are working in low-skilled jobs. “” sounds right to me.
LikeLike
Big upside in having a high NZD, you get to hire cheap labour to go do the service, cleaning and grooming jobs. Brings back my childhood stories of the Great British Empire days of grand and opulent lifestyles serviced by an army of low cost labour in the far reaches of the Empire.
LikeLike