In my post yesterday, I highlighted the pretty stark divergence in the performance of the tradables and non-tradables parts of the economy. As the key chart in yesterday’s post illustrated, in the 1990s and into the early 2000s both the tradables and non-tradables sectors were growing strongly, even in per capita terms. Since then, the non-tradables sector has continued to grow pretty strongly, but there has been no growth at all in per capita tradables sector GDP – in fact, the current level is almost 10 per cent below the 2004 peak.
One element of the tradables sector that is commonly supposed to be doing well is exports of services: tourism, export education, and the rest. The government has indicated that it hoped the ICT component would surge ahead and, on some definition or other, be the “second largest contributor to our economy by 2025”.
But how have services exports actually being doing, as a share of the economy? Here is the New Zealand chart.
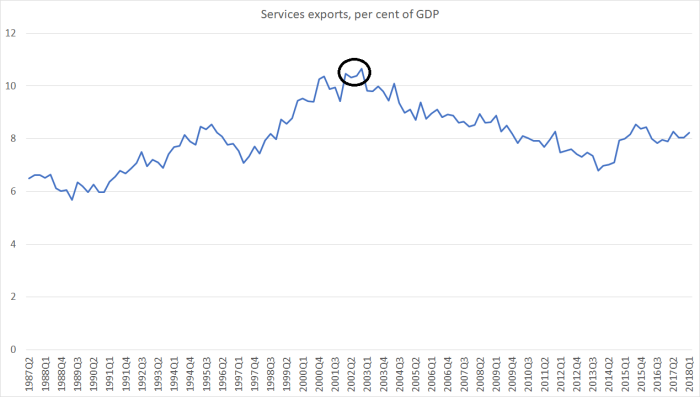
There was really strong growth over the 15 years or so to the peak (marked) in around 2002. Services exports lifted from less than 7 per cent of GDP to in excess of 10 per cent. Since then, the trend has been back downwards again – the current level only a touch above 8 per cent. And, at that, one of the largest components – export education – is, in effect, quite subsidised, by being bundled together with the ability to get work rights and residency points.
How have other advanced countries done?
Here is a chart, using annual OECD data, showing (a) New Zealand, (b) the median for those small OECD countries with complete data since 1986, and (c) the median for six small former Communist eastern and central European OECD countries, countries engaged in the sort of catch-up that New Zealand was supposed to experience.
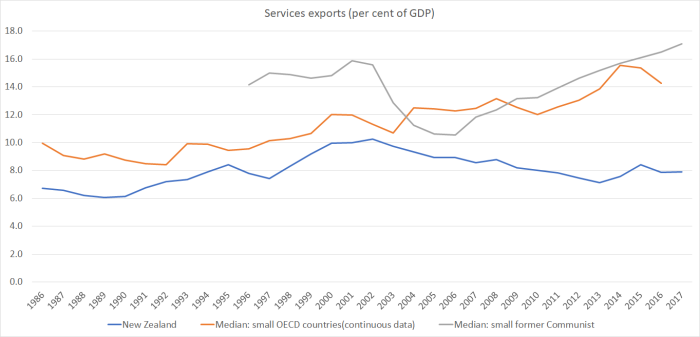
I don’t fully understand what was going in the former Communist countries in the first few years of the century, although since in many there was a big boom in domestic demand and credit, the export sectors (especially the bits not involving FDI) were probably under pressure. Whatever the story for those countries then, both lots of small advanced countries have seen rising shares of their economies accounted for by services exports over the past decade. We haven’t.
Here is another way of looking at our experience, looking at the percentage point change in the services exports share of GDP since our peak in 2002.
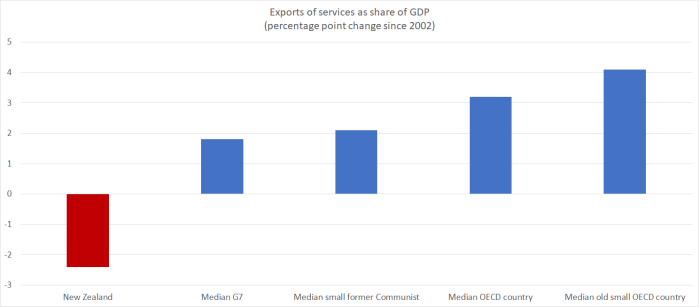
There were two – of 34 – OECD countries that saw a slightly larger fall in the GDP share of services exports. In one case, the growth in goods exports more than offset the fall. In the other – Chile – both goods and services exports shrank as a share of GDP, as happened in New Zealand.
As ever, foreign trade isn’t everything. But when your per capita incomes and productivity are so far behind the leading countries in the OECD, the typical way in which a country would undergo a sustainable lift would involve a larger share of the economy accounted for by both exports and imports That just hasn’t happened in New Zealand – and, of course, neither has there been any catch-up. Which isn’t surprising when, on the measure I illustrated yesterday, the real exchange rate over the last 15 years has averaged 27 per cent higher than the average level in the previous 15 years.
That higher real exchange rate didn’t get there by chance. It was the consequence – mostly unwitting – of deliberate government choices.
On which note, it is nine months today since the election. In other words, a quarter of the government’s term has gone. And, as far as I can see, there is nothing in policy announced, or foreshadowed, likely to do anything to close the productivity gaps, materially alter the real exchange rate, narrow the large average interest differentials, or sustainably increase the export share of our economy so that in turn we can support a larger import share. Oh, and market prices suggest no confidence that the manifest evil that is the housing market is on the way to being fixed either.

Ian Harrison wrote this:
The distinctive feature of the New Zealand economy is that land is an important input into the productive process. This is obvious with the agricultural,fishing and forestry sectors but it also applies to international tourism. In a simple model of the New Zealand economy where the supply of land is fixed, and New Zealand’s isolation means it is not a ‘natural’ location for the production of a broad range of internationally traded goods and services, then an increase in the labour supply through large scale immigration will reduce the
marginal product of labour. As a result:
Real wages will fall
Owners of land will benefit
There will be an outflow of ‘native’ labour in search of higher wages in Australia
The economy will be bigger, but average incomes will fall
Resources will flow into low value service production.
Click to access TheSuperdiversityMyth.pdf
LikeLike
NZ does have a natural location for the manufacture and for the launching of rockets into space but because of the lack of funding where billion dollar subsidies go to managing cow diseases rather then keeping NZ manufacturing. I do not believe it is about natural location but about where our tax payer subsidies have been going to.
LikeLike
I agree Michael. The real exchange rate is a huge issue for service exports. We don’t benefit when primary product prices rise – as they have done – and when you compound the stronger ToT with domestic demand stimulators policies, it’s no wonder exporters of services struggle.
LikeLike
I don’t think the exchange rate has anything to do with declining Service GDP. Afterall when we were selling trusts and LTC’s for tax avoidance it was a popular service around the world. But other than that what professional services do we have that people would pay to know? If it is important knowledge people will pay for that knowledge irrespective of the exchange rate.
We did have the the technology for the electron engine and very light weight to payload delivery ratio into space but of course that tech and the associated intellectual property was sold to US interests for a paltry sum $200 million. If our government was paying attention to manufacturing industries instead of forking out subsidies of billions to manage cow disease, border control and culling cows perhaps we have knowledge in professional services that we could sell other than how to put up a number 8 wire fence literally.
LikeLike
Now DOC has to dedicate 2 expensive professionals for tracking the Calici Virus contagion in the north because rabbits are now dying for a year now. It is incredible how we just keep on subsidising animal welfare which should be the cost to the farmers that farm rabbits.
LikeLike
Whether you like it or not the dairy sector has been increasing production at better than 7% per annum for the last 25 years, I am not completely certain but I think productivity has been improving at about 3% per annum. It would be interesting to see just how poorly the rest of the economy has performed over that period.
LikeLike
Unfortunately productivity measures the number of people and human working hours. We do not count 10 million cows to generate $15 billion in milk and meat export GDP. This is extremely poor in terms of production value and volumes given the amount of land resources committed. A company like highly government subsidised Samsung delivers $350 billion in sales with only 350k people. Cows just do not measure up to human productivity.
LikeLike
Of course, a considerable portion of that 7% is stemming from a change in land use, so offset by declines in sheep numbers (in particular).
In the post yesterday, you can see that per capita output in agriculture, forestry and fishing in total (most of which is ag) has had almost no per capita growth in the 27 years shown (7 per cent in 27 years, so less than 0.25% pa).
From memory, MFP growth in agriculture as a whole has been quite strong over recent decades, but doesn’t stand out relative to MFP growth in other advanced countries with big commercial agric sectors.
LikeLike
“Export” education, meaning literally importing foreign migrants/colonists who have zero intention of leaving our shores? That outright lie disguised as weasel words is becoming openly obvious as such to even No Zealanders of the semi- and barely literate variety.
LikeLike
Composition of NZ’s international trade in services
Click to access nzpc-research-note-2014-01-trade-in-services.pdf
“Travel and transportation are significant components of NZ’s service exports. Travel accounts for almost half of NZ’s service exports. Taken together, travel and transport account for about two-thirds of New Zealand’s service exports. The importance of travel and transportation in New Zealand’s service export profile is unusual internationally. With the exception of Australia, travel accounts for a higher share of service exports in New Zealand compared with the other OECD countries”
That seems to be Morse code for “growth in export services” will come from more and more tourists
LikeLike
Productivity measures the number of people or the number of human working hours as the denominator. This nonsense about productivity just equates to mega herds of cows numbering 10 million to deliver an abysmal $15 billion in export GDP in milk and meat. So much wastage in land use.
LikeLike
….hmmm; just to check logic; if ‘X – services’ (or just X) has been shrinking as a % of GDP, what has been increasing? per blogs, ‘I’ and ‘G’ have been fairly steady/ weak so that leaves ‘C’; so, partly more people coming in and working in services / non tradeables but partly terms of trade and the higher real exchange rate which has allowed growth in imports; if the real FX had been lower, that would have been a drag on ‘C’ or a loss of real purchasing power; so relying on a fall in the exchange rate doesn’t seem ‘ a free lunch’ and while a weaker currency may make it easier to compete internationally, still need ‘ideas / attitudes’ to kick in; so agree immigration / housing should be the policy focus but not sure on FX and productivity – can a govenment really influence how to work ‘smarter not harder’??
LikeLike
What has fallen away has been imports (including imports of services) – down from a peak around just over 8.5 per cent of GDP, to around 6.5 per cent now. Which is remarkable in a way, given that the high exchange rate makes imports (including overseas holidays) cheaper all else equal, but it goes to the point that over the longer-run if you can’t successfully export you won’t be able to import all you might otherwise wish.
LikeLike
I don’t think the volume of imports have fallen but certainly the cost of imports of some of the basics like cars, electronics and canned food products have fallen consistently each year.
What is likely missing from the export numbers is also the sale of our land and buildings that are getting more and more expensive each year to foreign buyers. We know the export numbers are not available for NZ stats until just recently last year but even that number of 4% of foreign buyers is low given that companies and trusts are not included. Builders and developers point to around 35% of a new apartment build would go towards foreign buyers in a building complex. This has caused a backdown by the Labour government foreign buyer ban on new builds because without that foreign buyer capital injection of foreign funds, the apartment building just can’t get built.
LikeLike
As a share of gdp, imports have shrunk.
LikeLike
Which does mean that overall the economy has been very efficient in extraction an increasing volume of GDP either through local margin increases or increasing the use of the imported product within the local and export GDP.
LikeLike
Would’ve thought the logical question should be :-
What was happening 1990-2002 that suddenly stopped happening 2002-2017
Was all that attributable to the exchange rate?
LikeLike