Sometimes people like to give the impression that New Zealanders are highly indebted. And so this summary chart, which I stumbled on this afternoon, is some helpful context.
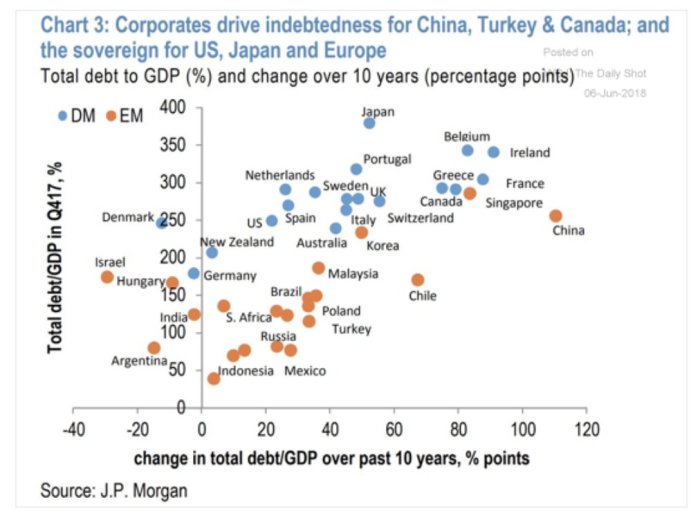
Among advanced economies, only in Israel and Germany is total debt/GDP lower than in New Zealand.
And also among advanced economies, only Denmark, Israel, and Germany had less of an increase in economywide debt/GDP over the 10 years to the end of 2017 (encompassing the recession and aftermath and subsequent recovery).
A decade ago, a comparable chart would have looked quite different. I recall getting someone to dig out the data in about 2008 or 2009 which showed that our total debt/GDP ratio had increased in the previous few years about as much as the increase in Japan in the late 1980s (and all the increase was business and household). And with most other advanced countries having materially increased their debt/GDP ratios over the last decade, New Zealand a decade ago would have been nearer the middle of the pack for the stock of debt than it is now.
Total debt to GDP calculations include household, corporate, and government debt. As I showed in a post a couple of weeks ago, household debt to GDP hasn’t changed much here. Government debt to GDP has increased a bit, and corporate debt to GDP also won’t have changed much.
Of course, those who want to remain worried about the New Zealand situation – if I recall rightly the Governor said he was `scared’ – will point out the role that big increases in government debt played in many other advanced countries. Household debt to GDP has not changed very much in some of those other countries either. But who is government but a collection of households? We are the ones who have to service government debt. And in many of these other countries, the total debt/GDP numbers will be understated because public service pension liabilities (contractural obligations) are not typically included in the debt numbers. In New Zealand, there are almost no such liabilities, and those there are are properly accounted for.
Add in the reduction in the ratio of the net international investment position (net liabilities) to GDP over the last decade, and the picture is one in which debt should be much less of a concern here than in almost all advanced economies, and than in many – perhaps most – emerging markets economies. In a better world – more business investment, on a path to more productivity – we might perhaps have hoped there would have been more business debt being taken on.

Hard to know exactly what New Zealand’s true rate of business Debt is as many households who are owners of small businesses typically borrow using their home as collateral – at a lower rate – but the line between their business and home is fuzzy.
Nice chart though. China looks awful up there…
LikeLike
We do record that NZHousehold Private debt is $178 billion against net private wealth of $1.5 trillion. Not too sure what Adrian Orr is so scared about. The Loan to Value restrictions of 35% on property investors are just an unnecessary market interference. Most property investors are just NZHouseholds holding 1 or 2 investment property for retirement income.
LikeLike
“”public service pension liabilities (contractural obligations) are not typically included in the debt numbers””. I remember my parents UK public service pensions were generous. Without this info the figures are misleading and my guess is deeply misleading.
At least it gives NZ something we don’t have to worry about.
LikeLike
What is not budgetted for in NZ Universal Super is the 600,000 New Zealanders that live in Australia. As Australia tightens up on their annual tax blow out, New Zealanders will find themselves left out in the cold. This effectively means that there is as many as 400,000 on Special Visa Category that may have to return to NZ who have not paid any NZ taxes who will be fully entitled to NZ Universal Super. Living in Australia does not require the usual 10 year stand down period for NZ Universal super entitlements. Jacinda Ardern, rather negligently has also increased the number of Pacific Island countries that also do not require that 10 year stand down and have become entitled.
LikeLiked by 1 person
Australia looked odd to me as I thought they had similar levels of household and government debt to us now. The difference looks to be corporate and as with the USA and UK (and Japan and a few others) I suspect this is because they have banks that fund balance sheets with debt which we don’t really have.
LikeLike
Australia’s household debt to GDP is now quite a bit higher than NZ’s (120% vs 90%).
All these comparisons get a bit fraught. They are usually gross debt numbers so (for example) if we wound up NZSF our total debt/GDP would be lower on this measure. Australia’s household debt numbers are probably higher than ours partly because of compulsory private savings: more people of mortgage age have both debt and fairly large balances locked away in super accounts.
LikeLike
….cracking; Argentina a bit of stand out…..given recent moves, maybe the peso is worth a dabble..!!
LikeLike
maybe, altho Argentina’s record over a couple of centuries suggests it can’t cope with much debt before running into yet another crisis (which in turn probably makes access to credit an issue).
if i recall correctly, when Argentina last ran into severe crisis in 2001 govt debt to GDP looked very low by international standards, but most of it was in foreign currency or linked to foreign currency, and the exchange rate had been very overvalued, so the debt ratio blew out as the crisis unfolded.
LikeLike
…..i guess the other thing the chart implies is monetary economies cannot deflate easily so past investment decisions that were ‘bad’ with hindsight act as a break on ‘good’ investments that exist today.
LikeLike