Since the current government took office, I’ve highlighted from time to time (eg here) the tension between the rhetoric about the desire to lift New Zealand’s productivity performance (poor for decades, woeful in the last five years or so) and to increase the outward orientation of the economy, and the specific policy promises which mostly seem likely to work in exactly the opposite direction.
The determination to reduce carbon emissions even more aggressively than the previous government’s goal, especially while sticking with a largely unchanged immigration policy that continued to drive up the population, seemed a prime example. I didn’t have any numbers, but the direction of the effect seemed pretty clear.
But now the government has published some numbers, which really should be getting a lot of attention. Yesterday the Green Party leader James Shaw (Minister of Climate Change) launched a consultative document on what form the “net zero by 2050” target might actually take. Perhaps naively, I’d assumed they had meant what they said, but in fact they are consulting on three quite different variants.
- Net zero carbon dioxide by 2050: this target would reduce net carbon dioxide emissions in New Zealand to zero by 2050 (but not other gases like methane or nitrous oxide, which predominantly come from agriculture).
- Net zero long-lived gases and stabilised short-lived gases by 2050: this target would reduce emissions of long-lived gases (including carbon dioxide and nitrous oxide) in New Zealand to net zero by 2050, while stabilising emissions of short-lived gases (including methane).
- Net zero emissions by 2050: this target would reduce net emissions across all greenhouse gases to zero by 2050.
The third of those was, I think, was what most people had in mind.
Somewhere in the consultative document the first of these options is described as not being that different, in overall effect, from the target put in place by the previous government.
At the front of the report, the language – not just from the Minister but from the MfE bureaucrats is very upbeat. From the bureaucrats’ Executive Summary
This is our chance to build a high value economy that will hold us in good stead for the future. By upgrading our economy and preparing for the future, we can help make sure quality of life continues to improve for generations to come.
To read that, you’d suppose that pursuing ambitious emissions targets would make us richer, and better off in material terms.
A few paragraphs on the MfE officials suggests that the British have already shown us the way
Our economy is already dynamic and constantly adjusting to change. Jobs are continually created and lost. For some of us, the changes through the transition could be small or not noticeable – we could be driving vehicles powered by 100 per cent renewable electricity. For others, the changes could be bigger. The transition will affect how we travel, use land and what we produce and consume. Other countries, such as the UK, have shown that it is possible to reduce their emissions while growing their economy and maintaining a high standard of living.
This is probably what they had in mind (using OECD data which still only goes up to 2015).
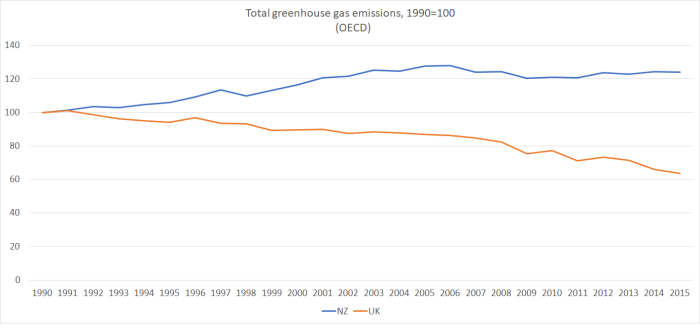
That certainly makes the UK look good relative to us.
Then again, here is the emissions data for the two countries per unit of GDP.

The drop in emissions per unit of GDP has been almost exactly the same, over 25 years, in the United Kingdom as in New Zealand. Our numbers are a lot higher than those in the UK but (for example) their economy trades with bankers/lawyers etc and ours trade with sheep and cattle. There are different opportunities and different emissions profiles.
(And, as it happens, productivity growth in the UK in the last decade – although not prior to that – has been materially worse than that in New Zealand.)
So the upbeat story about other countries having blazed a prosperous trail doesn’t really seem to have anything to it, at least in the one example MfE cites. The main difference between the total emissions profiles is simply that we’ve adopted policies that raised our population much faster than the population growth in the UK. It really is almost as simple as that.
But after the upbeat introduction, a bit of realism starts to creep in.
As we reduce emissions, the economy will continue to grow but possibly less quickly.
Only “possibly” though, although one’s confidence should have been waning already when a few lines later one reads that
We will need to invest in innovation and plant a lot more trees, to ensure we maintain a strong economy over the coming decades.
Because we all know that advanced countries get and stay rich by planting (lots and lots of) trees. At best, it seems that they are likely to be a mitigant – absorbing carbon emissions possibly more cheaply than some other methods. They aren’t likely to add to our productivity or per capita income.
To the credit of the Ministry, they have had some modelling estimates done, and the Minister has allowed the summary results to be published. It is not very satisfactory that the full model results have not been published yet, in what is a fairly short consultative period. In fact, the suggestion is that the modelling work hasn’t even been finished yet
This and future material will be published on the Ministry for the Environment website as it is finalised.
But better to have what they did publish than to have to try to get it out of them via the Official Information Act.
NZIER was commissioned to do some modelling on the impact on GDP of the various net zero target options. This is the table reproduced in the report.

As MfE observes
The analysis by NZIER suggests that GDP will continue to grow but will be in the range of 10 per cent to 22 per cent less in 2050, compared with taking no further action on climate change.
(Note that emissions per unit of GDP have been steadily trending down for decades as it is – see first chart above.)
These are really big numbers. I have never before heard of a government consulting on a proposal to cut the size of the (per capita) economy by anything from 10 to 22 per cent. And, even on their numbers, those estimates could be an understatement.
The baseline assumptions NZIER have used produce average real GDP growth over 2017 to 2050 of 2.2 per cent. They do not lay out the assumptions in more detail, but Statistics New Zealand population projections show average population growth over that period of 0.7 per cent per annum, so they seem to be assuming baseline productivity growth of something like 1.5 per cent. That would be high by the standards of recent decades, but (except for rhetorical purposes) it does not matter very much: the focus is on the difference the various carbon emissions targets make to future productivity growth.
The numbers in the table do not show the unadorned comparisons. They helpfully show the difference the varying degrees of ambition in the possible net emissions targets makes: the more ambitious the target, the worse the expected economic growth. But in each of the three different scenarios (described in the very top line of the table), the modellers assume that the magic fairy helps out. They assume faster rates of innovation in these particular sectors, over and above what is embedded in the baseline assumed rate of productivity growth. This is how they describe it:
- faster energy innovation occurs, driven by higher emissions prices and transitional policies that double the baseline energy efficiency trends across all industries and provide a shift to 98 per cent renewable energy by 2035 with the remaining 2 per cent used being gasfired generation in dry years only
- faster transport innovation occurs, driven by higher emissions prices and transitional policies that increase electric vehicle uptake to 95 per cent of the light vehicle fleet and 50 per cent of the heavy vehicle fleet by 2050
- faster agricultural innovation occurs, this sees a one-off innovation of a methane vaccine introduced in 2030 being adopted across all farms, which reduces dairy emissions by 30 per cent and sheep and beef emissions by 20 per cent. A reduction in global demand for dairy (11 per cent fall in 2050 output from 2015 levels) and sheep and beef (15 per cent fall) is experienced as consumer preferences shift towards lower emissions intensive foodstuffs, such as synthetic meats.
All of which might be fine, but there seems to be no allowance at all for the possibility that higher input costs etc might discourage investment in innovation (relative to baseline) elsewhere in the economy. Affordable energy was, after all, a huge contributor to economic development in the last few centuries.
So on the best-case magic ferry scenario (the furthest right column) – with much increased innovation in these sectors, and no offset elsewhere – the full net zero target by 2050 would result in GDP in 2050 being a full 10 per cent lower than otherwise (with 20 per cent of assumed overall productivity growth just given up).
If we only get the added innovation in agriculture, or only get it in transport and energy, the sacrifice is perhaps 40 per cent of all productivity growth (the difference between the 2.2% GDP growth baseline, of which productivity growth is about 1.5%, and the 1.5% and 1.6% GDP growth scenarios (in which productivity growth is only 0.8 or 0.9 per cent)). A sacrifice of 0.7 per cent annual productivity growth for 33 years means accepting living standards 26 per cent lower than otherwise by 2050.
Again, to the credit of the government, they are also explicit about where the costs are likely to fall
Modelling shows the impact of domestic climate action would be felt more strongly by lower income households, because a higher proportion of their spending is on products and services that are likely to increase in cost as we reduce emissions across the economy.
Our modelling suggests the households that are in the lowest 20 per cent bracket for income may be more than twice as affected, on a relative basis, than those households with an average income.
Quite breathtaking really. We will give up – well, actually, take from New Zealanders – up to a quarter of what would have been their 2050 incomes, and in doing so we will know those losses will be concentrated disproportionately on people at the bottom. Sure, they talk about compensation measures
The Government has a number of tools it could choose to use to compensate affected households for higher costs, such as tax or welfare measures.
But the operative word there is could. The track record of governments – of any stripe – compensating losers from any structural reforms is pretty weak, and it becomes even less likely when the policy being proposed involves the whole economy being a lot smaller than otherwise, so that there is less for everyone to go around. The political economy of potential large scale redistribution just does not look particularly attractive or plausible (and higher taxes to do such redistribution would have their own productivity and competitiveness costs).
I guess I am impressed that the government was willing to publish a document suggesting adopting a policy which it openly documents would come at such a large potential cost to New Zealanders (substantial even if the magic fairy comes to our aid to the extent assumed in these scenarios). It must surely be a first in history. No one asked the citizens of, say, 1948 Czechoslovakia if they wanted to be impoverished (relative to a faster growing West). But it is hard to see what is in for New Zealanders – lagging badly behind other advanced countries on productivity anyway, with constant complaints about child (and other) poverty) – to just happily sign in to such a huge economic sacrifice? And for what?
I guess these targets are advocated by zealots, but even the zealots surely recognise that what New Zealand does is not going to change the climate, and that many countries already richer and more productive than we are are proposing adjustments that are materially less costly or demanding that what the New Zealand government is proposing here. I am not suggesting we can or should do nothing – there is some minimum effort probably required to ward off the threat of trade sanctions – but surely on any reasonable cost-benefit assessment of the interests of New Zealanders, we would be confronting these costs – the wilfully given up opportunities for our kids and grandchildren – and pulling back? Or we might be thinking again about whether deliberately boosting the population – bringing people to a country with high baseline emissions per unit of GDP – is sensible for the world, or (more importantly) for our own people. I would be keen to see a variant of the NZIER results in which the population growth (and thus baseline emissions growth) was materially lower than what is assumed, based on current immigration policy.
To repeat, I would be surprised if ever before in history a democratic government has consulted on proposals to reduce the material wellbeing of its own people by up to 25 per cent. Wars, of course, come at a very considerable cost – and sometimes are worth fighting – but again, I doubt any democracy (or perhaps even any tyranny) ever entered a war thinking that as a result of doing so they would be so much poorer 30 years on. It is simply a breathtaking proposition – the more so in a country that at the moment struggles to achieve any material productivity growth at all.
And as a reminder of what productivity means, see this recent post.
UPDATE: One issue I didn’t spot earlier is how there can be no marginal cost in going from the 75% to the net zero option, under either of the two scenarios shown. To one decimal place, the assumed average growth rates are identical. Given that going from 75% to net zero involves dealing with the short-lived gases (from agriculture), which are some of the most intractable issues (without dramatically shrinking the industries), it is difficult to see that this particular model result can be plausible. But, to the extent, that the model results are the same under the two alternative targets, it undermines the case made by some that this document represents the government trying to walk back the original commitment to (true) net zero.

I watched James Shaw on Q&A last Sunday and his answer was less cows and more eco-tourism. He even quoted some Dominica island nation that are preparing to reduce its primary production in favour of eco-tourists to reduce emmissions. This does point towards more immigrants rather than less immigrants as future government policy.
NZFirst armed with $5 billion in spending budget compared to the Greens $500 million in spending budget, we would be lucky to see any trees planted. NZFirst and Shane Jones has pretty much confirmed with no shame, that their budget is out there as a NZFirst slush fund, To the winner the booty. What does that mean? It means that $5 billion will be used over the next 2 tears to buy NZFirst a seat in Northland to assure NZFirst a place in parliament.
LikeLike
Thanks for the feedback and the heads up. These are such serious issues.
I had some involvement peer reviewing drafts of MfE’s updated guidance manual for LG on coastal hazards. Lead authors being NIWA, I can’t speak more disappointingly on the (in my opinion) ‘zealotous’ way they portrayed the science of CC/SLR, and the questionable interpretation of NZ law, the NZCPS, in formulating this regulatory advice for councils.
I was expecting to see a 3rd draft for further comment, when the document was leaked to the Green Party and publicly released. The then National government were accused in the media (Newsroom were running the articles/investigation) of wrongfully withholding the document, but given the state of the 2nd draft that I had read, had none of the very extensive feedback that had been given by the group I was working with been taken on board by NIWA – well, I wouldn’t be surprised why the National government was withholding it.
It has since been adopted/published by the new government, I haven’t read it in its final form.
FYI, Pure Advantage did some work in this same ‘zero carbon’ space in case you hadn’t come across it;
http://pureadvantage.org/news/nznz/introduction/
LikeLiked by 1 person
Dominica has a total population of about 75000, and GDP per capita that is about 20% of ours. I’m not sure I find it a compelling model for us…..
LikeLiked by 1 person
But like us their key GDP exports are Primary industries and Tourism, really makes us just a larger village but still no doubt a village.
LikeLike
How does an eco tourist arrive in NZ? By waka or airship? Somehow air travel gets ignored as not belonging to any country but it uses a remarkable amount of carbon based fuel and no alternative is being proposed. Then what does the eco tourist actually do? Dig ditches, plant trees, admire the sunset? The least energy eco tourist activity would be sun-bathing and I’d rather do that in Dominica.
LikeLike
With such an evidentially earnest commitment by our government to reducing New Zealand’s emissions of carbon dioxide, one would hope that some government department or other would have ‘done its homework’ and verified that there actually is hard physical evidence that higher concentrations of carbon dioxide cause the mean global temperature to increase.
I read widely, and have yet to come across any such evidence. Rather, I keep coming across references to computer models which tell us that the increasing concentration of carbon dioxide in earth’s atmosphere is causing planet earth’s mean temperature to increase, and that if we don’t act, and soon, to reduce our emissions of carbon dioxide, we’re all ‘going to hell in a handcart’.
Economists and engineers share at least one thing in common — we all know that computer models are only as good as the programs that are run in them, and that the ‘rubbish in, rubbish out’ principle applies.
Michael, do you know what this hard physical evidence actually is?
If you, or any other followers of your excellent blog know what this hard physical evidence actually is, please let us all know.
Unless one of you can tell us what this hard physical evidence actually is, I strongly suspect that there simply is none, and that the zealots are all suffering from groupthink on the grandest scale in all of human history.
I’ve been on this planet for going on 78 years, and must say that I haven’t noticed it getting any warmer, nor have I noticed any calamitous rise in sea level, and yet, in my lifetime so far, the atmospheric concentration of carbon dioxide has increased by around 50%.
Satellite observations tell us that our planet’s deserts are shrinking and that the total mass of our planet’s vegetation is steadily increasing.
Satellite observations, since they began in 1979, also tell us that our planet’s mean temperature has hardly changed in almost 40 years, despite the observed huge increase in the atmospheric concentration of carbon dioxide, which is still merely a trace gas that nevertheless practically all life depends on.
Perhaps the zealots have an ulterior motive?
LikeLike
Given the recent scare mongering by overzealous money to be made groupies with the P smoking issue. Mass public and government official hysteria certainly can’t be discounted over this climate change issue.
LikeLiked by 1 person
Peter
As you know, I don’t do science. My interest is in the economics, and the policy/politics choices. I’m not sure whether I even believe the NZIER numbers – it would be interesting to see a proper write-up of them – but what really interests me is that the govt has chosen to consult on the basis of something like those real economic costs. Either they are come-what-may zealots, or this document is being used as a basis to walk their way back from the election commitments? I suspect there may be a mix of motivations/preferences within the govt itself, and among their supporters.
LikeLike
Gareth Morgan’s Poles Apart convinced me.
http://morganfoundation.org.nz/product/poles-apart/
To me a zero carbon economy would require living in eco villages and being like Amish folk (but horses need fields of oats).
LikeLike
I’ve been interested in climate change for over 50 years. Nothing is certain and nobody has less faith in computer models than myself (retired Computer programmer) but the over whelming evidence is we may have a problem that can only be tackled by all countries taking action. The most persuasive evidence for myself was recently reading that deep sea temperature are perceptibly increasing.
However read Jim Flynn’s “No Place to Hide: Climate Change – a short introduction for New Zealanders”. Even if he is totally wrong it will only take a couple of hours to read (85 pages) and it is a pleasure to be in the presence of an author with a brain the size of a small planet as one reviewer put it.
LikeLike
Not if the Amish folk are burning their wood burning stoves 24/7.
LikeLike
Call me naive but I tend to trust the scientific consensus and verified sources like Stanford University, the a royal Society, and NASA. The beauty of the Internet is access to information. However this also allows fringe beliefs to be published as fact as well. Definitely read widely but recognise that at the wide boundaries topics like anti-vax, Elvis, alien pregnancies, flat earth and no climate change can get free airtime on the www.
Try these: https://royalsociety.org/topics-policy/projects/climate-change-evidence-causes/question-6/
And https://climate.nasa.gov/
And https://www.skepticalscience.com/global-warming-scientific-consensus-intermediate.htm
Enjoy
LikeLiked by 1 person
The Bear claimed above that the Royal Society had some hard evidence that rising atmospheric CO2 concentration caused earth’s mean temperature to rise:
https://royalsociety.org/topics-policy/projects/climate-change-evidence-causes/question-6/
Sorry, but it does no such thing. Evidentially, the Royal Society members responsible must also be suffering from groupthink!
What the graphs show is that CO2 concentration lags, not leads, mean global temperature.
Here’s why:
Most of earth’s CO2 is stored in the oceans, not the atmosphere. When the mean global temperature rises, CO2 evaporates out of the oceans and enters the atmosphere, and when mean global temperature decreases, the reverse happens.
To illustrate this, simply get two identical bottles of fizzy drink and put one in the fridge and wait until it has reached approximately 5 degrees C, the temperature inside your fridge. Leave the other bottle in the kitchen at room temperature. Then take the bottle out of the fridge, place it beside the room-temperature bottle, and open both of them. You will observe that the warmer bottle fizzes considerably faster than the colder one. If you don’t get what this should tell you, chances are that you’re not an engineer or scientist!
Sunspot activity and the incidence of cosmic rays striking planet earth are the real reasons for earth’s continuously changing climates, albeit extremely slowly.
LikeLiked by 1 person
To PJM. Suggest reading http://www.newscientist.com/article/dn11650-climate-myths-global-warming-is-down-to-the-sun-not-humans/amp/
And
https://www.skepticalscience.com/solar-activity-sunspots-global-warming.htm
I don’t expect to make you a believer. I’m simply saying I trust scientific consensus (which is overwhelming) not home experiments and anecdotal commentary that hasn’t been peer reviewed.
Why? If you have time Schneider from Stanford is a great read: https://stephenschneider.stanford.edu/Climate/Climate_Science/Contrarians.html
LikeLike
The New Scientist link actually has some embedded links that are a great read for climate change sceptics – going through each myth and the evidence debunking, for those interested.
On the CO2-lagging-temperature point specifically:
“The ice ages show that temperature can determine CO2 as well as CO2 driving temperature. Some sceptics – not scientists – have seized upon this idea and are claiming that the relation is one way, that temperature determines CO2 levels but CO2 levels do not affect temperature.
To repeat, the evidence that CO2 is a greenhouse gas depends mainly on physics, not on the correlation with past temperature, which tells us nothing about cause and effect. And while the rises in CO2 a few hundred years after the start of interglacials can only be explained by rising temperatures, the full extent of the temperature increases over the following 4000 years can only be explained by the rise in CO2 levels.”
https://www.newscientist.com/article/dn11659-climate-myths-ice-cores-show-co2-increases-lag-behind-temperature-rises-disproving-the-link-to-global-warming
I’m not an engineer or a scientist, rather a (rather poor) economist. I’m not trying to represent my own expertise as the deciding argument – but I will admit a heavy bias to peer-reviewed, data-driven conclusions from official publications and climate scientists.
LikeLike
In science, “consensus” is a nonsense. Science is not decided by popular vote – it is decided by observational evidence that backs up a successful theory. Anyway, the so-called consensus is a whole lot of people – and I would be one of them – who agree that mankind is some effect on the climate. The key question, of course, is how much. The evidence says “very little”.
The belief is based on the outputs of climate models that have never been validated and have never made an accurate prediction.
Regarding the Royal Societies you may not be aware that, when challenged to do so, the Royal Society of New Zealand and Prof James Renwick were unable to come up with any convincing evidence that man-made greenhouse gases cause dangerous global warming. None!
After subscribing for 40 years I cancelled my New Scientist subscription because of their totally one-sided view of man-made global warming.
LikeLiked by 1 person
There is plenty of historic evidence linking CO2 levels, global temperatures and sea level.
http://www.johnenglander.net/chart-of-420000-year-history-temperature-co2-sea-level/
LikeLike
Message to kiwi_overseas:
“Linking” means correlation. Correlation is not proof of causation!
LikeLiked by 1 person
…maybe the assumed methane vaccine is a bit like fairy dust which I guess has a zero marginal cost.
LikeLike
Maybe as per your recent lecture you need to remind readers what GDP means.
In our case it was a mother who had a child in NZ, had the babies first immunisation in NZ and then went to PNG. All free. Went to PNG and the immunisation booster shot would have cost her a considerable amount. So returned to NZ.
With NZ’s GDP being less than 35 other OECD countries the equivalent issue occurs when you read of cancer drugs unavailable in NZ but available in UK, Europe and Australia.
However all the figures in the table show GDP growth so nobody will be downsizing their car or cutting down on visits to restaurants. It will just be feeling poorer when travelling overseas.
LikeLike
NZ should not set a concrete date for zero carbon.
The least cost pathway is to allow the NZ ETS price to move with international carbon prices (or proxies thereof).
Reducing the immigration rate to a sustainable level would also help given its an absolute target.
LikeLike
Link to MFE’s online consultation;
https://signup.ourclimateyoursay.nz/protect/
LikeLike
1 If ANY of the climate projection (or any other) theories were accurate to the point of being believable then why are there so many contending theories still. The answer is of course that the models and the data gathering procedures are completely inadequate at covering the vast complexity of the issue.
2 Climate has changed since the earth began, but over the period of partially measurable history there has been what we have come to believe is normal weather, vastly hotter times and a variety of ice ages and little ice ages. We are currently between little ice ages, so unsurprisingly, since the last LIA was considered over in the early 1800’s the climate has warmed and will sometime start cooling again. There is much more to be feared from cold than the historic warm peaks between ice ages. And about the only historic correlation between warming and anything else over a long period of time is that the production of CO2 does not cause warming, rather the warming precedes the increase of CO2 in the atmosphere. Well there is something else, sunspots; their absence seems to usually come before the onset of cold times.
3 The above two points are very difficult to avoid in the formulation of the very shaky climate theories, let alone the political/media driven panic over a condition that for the immediate future promises to plateau at about the same temperatures on average as we have at present, but with far more CO2=more vegetation growth and possible prosperity. Oh how politicians and media folk love crises, panic, pain, anguish, almost as much as violence, shock and horror. Really, government needs to rid itself of the political/media ghouls and get on with the linked goals of prosperity and freedom.
LikeLiked by 1 person
Michael, can you translate 1% of future GDP growth to dollars (in billions)?
Most regulatory impact statements express the costs/benefits of proposed legislation in annual dollars per capita, or per average household, a metric which is widely understood. It strikes me that the ZCA will be the most expensive legislation in history, but most non-economists will not be able to get their heads around that fact.
As to the benefits side, I assume there is nothing translatable into dollars. At 0.17% of global emissions (or less with updated accounting) the Act’s impacts will be purely symbolic.
LikeLike
1% of current GDP is around $2.7 billion per annum. By 2050 of course we’d expect GDP to have increased (if only with inflation), but if we think of the emissions goal as reducing GDP in 2025 by up to 25% relative to the baseline, the sums are absolutely enormous, even discounted back to today’s dollars.
LikeLike
[…] Michael Reddell writes on how the government is consulting on slashing productivity growth. […]
LikeLiked by 1 person
great
LikeLike
[…] June 8, 2018 Mr Reddell looked at the government’s papers regarding the impact of moving to carbon zero or variants thereof. The post is detailed and repays study. A key comment for Adam was this: […]
LikeLike