Among the various arguments advanced for why we should expect that large-scale government-led non-citizen immigration will prove economically beneficial to New Zealanders are claims about the labour market.
There are, for example, suggestions that the unemployment rate will tend to be (a bit) lower than otherwise, because ready access to offshore labour facilitates better skill-matching. Larger labour markets might work in the same direction – easier for people displaced, or new entrants, to find jobs in a deeper more diverse market.
And there is the suggestion that average GDP per capita is likely to be raised just because the average immigrant is more likely to be of working age (few countries let in many 75 year olds). On this telling, even if there were no productivity gains (ie lifts in, say, GDP per hour worked) from large scale immigration, average incomes would be raised simply because of the implied higher rates of labour force participation. In fact, this argument was run only a matter of weeks ago in an official Australian government document, a defence of Australia’s large-scale immigration programme published by the Federal Treasury and the Department of Home Affairs (the department directly responsible for immigration matters). From page 27
After trending upward for almost three decades, Australia’s labour force participation rate declined from the early 2010s through to 2016 (Figure 22). This decline coincided with a large cohort of baby boomers reaching retirement, which weighed on Australia’s participation rate. Yet evidence shows that migrants, particularly skilled migrants, have helped curb the ageing of the population by boosting the labour force. Without the contribution from migrants, all else being equal, Australia’s participation rate would be lower than at present.
Many of these claims had initially seemed plausible enough to me. In fact, in a major modelling exercise done for one of MBIE’s predecessor departments a decade ago – and widely touted at the time – the only overall economic gains from immigration resulted from this assumed higher participation rate.
But a while ago I noticed that the unemployment rate in Auckland hadn’t been any lower than that in the rest of New Zealand. This chart uses annual data, up to and including the latest release last week.
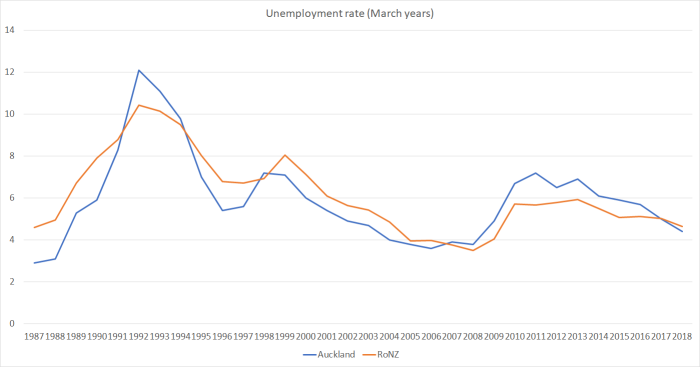
Auckland is a good place to focus on. Not only is it by far the biggest labour market in the country, but it also has by far the highest proportion of foreign-born residents, and receives a disproportionate – but not surprising – share of the new migrants, temporary and permanent. Labour market laws apply nationwide, but you might think that some would be a little less binding in Auckland than elsewhere – for example, there is a nationwide minimum wage, but average productivity is higher in Auckland than on average in the rest of the country. All else equal, again one might expect Auckland’s unemployment rate to have been a little lower than that in the rest of the country.
And yet over the 32 years for which we have the data there is no sign that unemployment rates in Auckland have been lower than those elsewhere. There might be a bit of a cyclical pattern – Auckland does worse in downturns (see early 90s, and the period from 2008 until recently), and better in periods of strong economic growth (and that cyclicality may itself be exacerbated by the large New Zealand cycles in net migration) – but there is no sign of much beyond that.
What about employment rates (calculated as the share of those aged over 15 in paid employment)?
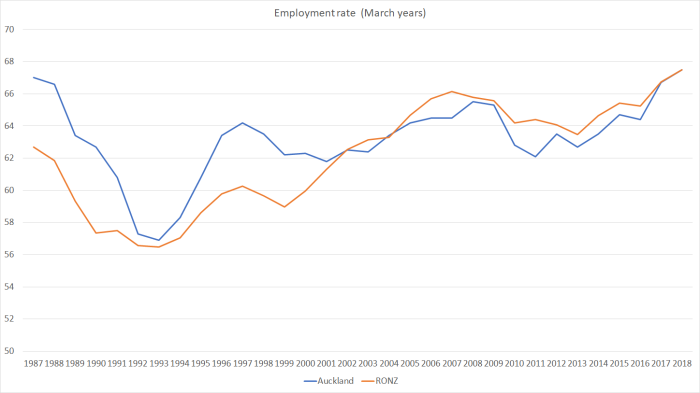
Interestingly, employment rates in Auckland used to be quite a bit higher than those in the rest of New Zealand, but they aren’t now. Perhaps the difference in the earlier period reflects differences in how the economic restructuring and reduction in trade protection affected different regions – it seems plausible (although I’m happy to see any confounding evidence) that the initial job losses might have been more heavily concentrated outside Auckland, with the gap closing again over time. Whatever the explanation for the earlier period, average Auckland employment rates have struggled to match those in the rest of the country over the last 15 years or so (periods encompassing two big waves of non-citizen migration).
And as I thought about it, this chart started to puzzle me more. After all, the denominator is the population of working age, which includes all the elderly, and yet as the recipient of the largest share of migrants wouldn’t one expect Auckland’s working age population to be concentrated in the age ranges with the highest rates of labour force participation? And there are the persistent stories of old people moving out of Auckland – the money tied up in the overpriced house goes further in the provinces.
And, sure enough, here are the official estimates of the share of the working age population aged over 65 in 2017 (the numbers aren’t materially different from the firmer numbers from the 2013 Census).
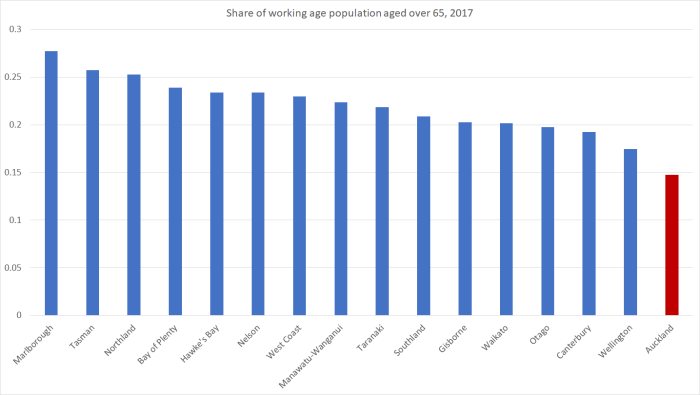
Auckland has by far the lowest share of its working age population aged over 65. Across the country, those aged over 65 have an average employment rate of about 24 per cent, while for the working age population as a whole the employment rate is more like 68 per cent. And yet, despite having so many fewer old people the overall employment rate in Auckland is no higher than in the rest of New Zealand taken together.
There isn’t a great of information about labour force status disaggregated by both age and regional council, but I did find some data for the last few years comparing Auckland and the Wellington and Canterbury regional council areas.
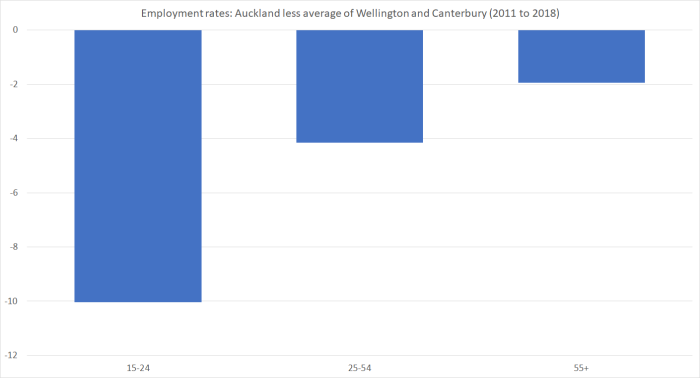
Even among the older cohort, employment rates in Auckland have been a little below those in Wellington and Canterbury (in not a single year was the Auckland rate higher than in either Wellington or Canterbury – despite the smaller number of over 65s). But in the younger cohorts the differences are quite a bit larger. Perhaps some of the difference among the 15-24 cohort reflects the presence of foreign students (although many of them are working), but in the prime age cohort (25 to 54) the average employment rate in Auckland over the last eight years has been, on average, a full four percentage points lower than that in Wellington and Canterbury.
To be clear, this is a not a comment on the employment rates of recent immigrants (which may well be quite – even very – high). The HLFS simply doesn’t have that sort of data. It is an estimate based on the Auckland economy as a whole. And quite what explains it, I’m not quite sure. For anyone wondering if the ethnic composition of Auckland’s population is part (cause or consequence) of the story – whatever factors result in lower Maori and Pacific participation rates – here are the average participation rates for the last decade by ethnicity for Auckland and the rest of the country.
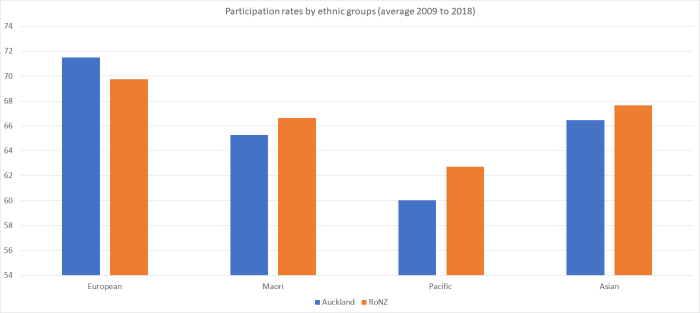
European participation rates have actually been higher in Auckland than in the rest of the country. But Maori and – especially – Pacific participation rates average materially lower.
Whatever the explanation, it isn’t obviously a story in which one of the largest non-citizen immigration programmes anywhere in the world, over decades, has produced an Auckland labour market that seems to be functioning in a way that might suggest economic gains across the board. Unemployment rates are no lower than in the country as a whole, employment rates are materially lower once one allows for the much smaller number of old people in Auckland, and there might be straws in the wind (that final chart) suggesting that the ethnic groups that typically do most poorly in New Zealand anyway are even less likely to be engaged in the labour market in Auckland than in the rest of the country.
Throw in the data I mentioned the other day – average GDP per capita in Auckland lower relative to that in the rest of the country than it was at the turn of the century, and the internal migration data suggesting that (in modest numbers) New Zealanders (net) are leaving Auckland – and it should leave the champions of current immigration policy very much on the defensive. Unwilling or unable to fix the housing/land market, and with no obvious productivity or labour market gains to show for their Auckland-focused strategy, it increasingly looks like a Think Big disaster of a severity and pervasive effect (including on many of our most disadvantaged) that makes the 1980s version (the shockingly uneconomic energy projects) look like a mere bagatelle.
But, remarkably, no political party – major or minor – seems bothered.
(And before anyone pops up to remind me that I often point out that employment is an input not an outcome – not, in itself, a measure of economic success – that is, of course, true. Nonetheless, there aren’t particularly good reasons to suppose that working age Aucklanders have stronger leisure preferences than otherwise similar people in the rest of the country – faced with, eg, the same tax rates – and some reason to suppose it might be the other way round (eg the sheer cost of purchasing a house).)

Those differing participation rates by ethnicity ought to cause concern – and I’m sure they do, especially for this coalition government.
It will be interesting to see how this ‘Housing First’ policy works out. It’s really hard to maintain steady employment without secure, steady and on-going accommodation in one place.
If Auckland lags the rest-of-NZ in any metric (be it education, health, employment etc.) then I think one can look to housing as being an underlying cause.
LikeLiked by 2 people
If you add in the 10 million cows and the 30 million sheep and 1 million goats then Auckland’s 1.6 million smart monkeys should pass all the metrics.
LikeLike
I was most impressed initially by the success of Herd density reduction programmes that led to fewer cows but higher profitability this morning on the RNZ 101.4 news. This became a huge joke when the commentator in serious reporting mode mentioned that it would be great if it could be done without government subsidies.
LikeLike
Remember Rehu, Charlie Rewati. the legendary Oki – Maori tour bus drivers???? I wonder what happened there?
LikeLike
I’m sure housing is part of the story, but I suspect as much as symptom as cause. After all, as I note, the sheer cost of housing should tend to induce more labour participation than otherwise simply to meet those costs (think of the couples with a new baby where they would really prefer one parent to stay home for longer, but the mortgage makes it all but impossible for many to seriously consider).
Low employment rates can be a sensible response to high/sufficient incomes and other interests (that would be broadly my own situation) but the fact that the low participation rates are concentrated in the lowest income (and younnger) ethnicities, suggest that happy story is also unlikely to be the explanation here.
LikeLike
It works conversely as well. If you are a low/middle income couple with children and paying high housing costs – it is in many case financially better for one parent to stay at home, as opposed to be subjected to the abatement regimes associated with WFF and Accommodation Supplement. Childcare and transport costs start to seriously erode that second wage and at the same time these government assistance programs are clawed back.
LikeLike
Good point. And those effects will tend to fall more heavily on (on average lower income) Maori and Pacific people. Having said that, the WFF effect is the same all across the country.
LikeLike
An interesting subject which seems to have eluded the media and journalists and fans of a big dense Auckland. Does not conflict with my preferred analysis:-
High paid immigration – either acceptable or good for NZ. Probably on balance not harmful.
Low paid immigration – either bad or very bad. And motivation for exploitation, corruption and rorts.
“”WFF effect the same across the country”” but what about accomodation allowance – that is much higher in Auckland. Isn’t there an incentive to keep one parent at home or maybe engaged in the black economy?
Having a grandchild with the mother working and the farther at home changing the nappies I had an interest in working out how they would survive. The govt doesn’t seem to advertise what you can get but their family allowance calculator shows one person working 35hours at $20ph would result in $215pw rent allowance in North Auckland and $143pw in Oamaru. Rational financial sense would have me kicking them out of the family home and taking in paying boarders but rational sense is suspended when you have the cutest granddaughter.
LikeLiked by 1 person
Got a request from one of my tenants to spend around $5k to retrofit insulation and to add a heat pump. So being a nice landlord I relented and said to go ahead. But since for me this is a financial investment the cost basically has to be recouped so i had to ask for a rent increase of $30 per week from 3 tenants to cover the cost of the insulation and heat pump ie $4.6k to recoup my $5k spend. The tenant should have just bought himself a $100 dehumdifier and a heater and saved himself the rent increase. But I suspect they are likely on a accommodation supplement anyway so don’t really care.
LikeLike
My weekly goat curry with bone-in from the local Puketepapa(Mt Roskill) shop, Spice Traders just jumped from $11 a dish to $14 a dish. The result of having to pay $50k for skilled chefs from India.
Too bad, no more goat curry for me. Now I will just go to the supermarket and get a $3.50 jar of Rogan Josh curry and drop in $4.99/kg pork shoulder with bones instead.
LikeLike
GGS: Pleased to hear that chefs from India are now getting an acceptable wage. That helps set the trend for all workers in restauraunts so maybe my children will be able to find a job that pays a wage they can live on. Good to hear you are cooking at home but I suspect eventually you will relent and pay the extra $3 just to save having to do the washing up.
LikeLike
Perhaps. But I did notice the significant lack of clientele since the increased prices. I wonder how long before the owner gets desperate to either find lower cost chefs ie illegal labour or face bankruptcy and lose his home. Tough choices in a very competitive food market.
LikeLike
Other restauraunts rorting the system – getting employees to pay for being employed. Two cases prosecuted locally; how many not-prosecuted I’ve no idea. How can the honest compete?
LikeLike
(a)
A bit awkward publishing the graph of the ethnic participation rate without also publishing corresponding employment and unemployment rates?
(b)
Participation rates from StatsNZ show each ethnic group having a participation rate between 66 and 71 – figure 2
(c)
OECD Data – Figure 3, shows NZ participation rate as 79 yet none of the moving parts (figure 2) exceed 71
http://archive.stats.govt.nz/browse_for_stats/snapshots-of-nz/nz-social-indicators/Home/Labour%20market/lab-force-particip.aspx
LikeLike
The OECD chart you refer to only covers participation rates for 15-64 year olds (whereas I’m using the standard SNZ 15+ metric)
I showed the participation rate chart, rather then employment/unemployment, because on this occasion I wanted to focus on people who are actively in the labour market (either employed or, on the SNZ) actively seeking work. Yes, the unemployment rates for Maori and Pacific are higher than those for others, but the Akld unemployment rates for those groups are no higher than the unemployment rates Maori and Pacific experience elsewhere in the country (on average over the last decade or so). the differences are more in the employment rates.
LikeLike
Prime Minister’s Statement
Home Parliamentary Business Hansard (Debates) Read Hansard Reports
Published date: 10 Feb 2004
In the watershed election of 1999, New Zealanders chose between two very clear models of economic and social development. There was the low-value route, still advocated by right-wing parties today, which saw us competing to be the cheapest, not the best, and saw New Zealander divided against New Zealander. The centre-left parties of Government backed the high-value route. Our vision sees New Zealand moving ahead because it is smart, innovative, skilled, and productive. We also want the rising tide to lift all boats, as it has and as it will under the Labour-Progressive Government.
https://www.parliament.nz/en/pb/hansard-debates/rhr/document/47HansD_20040210_00000056/prime-minister-s-statement
LikeLiked by 1 person
Yeah right. 9 years and we went backwards. The next 9 years we trod water and this next lot Phew . We will have lots of extra govt, beneficiaries while they all feed at the trough of this Govt.’s working parties. Parties being the operative work,
By the way it appears that today you finished paying this years taxes.
LikeLike
For 9 years GDP went forward by 3.5% per annum. Prior to that we had -4% GDP as we went into a deep recession engineered by the RBNZ.
LikeLike
Of course we all know that Auckland is our Head Office and we also know that Head Offices are over staffed, never do anything much and are generally out of touch with the rest of NZ.
Always has been that Auckland wages are higher, their output lower and more time gets wasted.
e.g. nothing to spend an hour or more traveling from place to place. Now consider if you are a tradies service person. You spend a bug chunk of everyday on the motorway and then then you have to charge for that time and charge more than tradies elsewhere for the time you are doing something useful.
Of course Auckland is a sinkhole. Always was and it will never change. Unfortunately the same thing is happening in Hamilton and Tauranga. So we will sink to their low level of productivity as well. ( Only thing is we’ve got better lakes and beaches so it’s not so hard to put up with it.)
LikeLike
The rest of the regions just forgot to add the 10 million cows, 30 million sheep and 1 million goats that use huge land and water resources to the productivity count. Poor economic mathematics results in poor outcomes.
LikeLike
But as I illustrated the other day, the Auckland experience actually is unusual in an international context. Biggest cities tend to be, on average, more productive than the rest of countries and (in recent decades) that margin has typically been widening.
We need to avoid resignation re Akld and find some politicians who might actually grapple with this specific NZ failure. (Of course, that may be a vain hope itself….)
LikeLike
It does suggest that Auckland is more a tourist city than most other cities that are financial hubs. Financial transactions being digits on a computer screen do generate substantial volume trading.
LikeLike
International Tourist spending is expected to grow +40% to $14.8 bln a year by 2024. That is a rise from the 2017 level of +$10.6 billion. Visitor numbers are forecast to grow steadily over the next seven years, reaching 5.1 million visitors annually by 2024, up +37% from 3.7 million in 2017.
Looks like no shortage of visitors especially with the Americas Cup in Auckland in 3 years.
Immigration numbers for foreign workers will start tracking upwards soon as the sailors, their families and fans, their support staff(more chefs) and administration start coming into Auckland.
LikeLike