I should really be doing something else, but I just read Brian Fallow’s column in today’s Herald outlining his views on why the government shouldn’t relax its own fiscal rules. Reasonable people can differ on that – and as per my post yesterday I’m certainly not arguing for the government to raise debt levels (per cent of GDP) from here. But what caught my eye was some IMF “analysis” Brian quoted.
He introduced his article noting that on IMF data (or any other measure you like) New Zealand’s net or gross government debt is quite low as a share of GDP. On my preferred measure, net debt is about 8 per cent of GDP. But he goes on
A third reason for being cautious about ramping up government debt is that not all of its obligations are on the balance sheet.
In particular, there is the future additional cost of superannuation and health spending as the population ages.
The IMF has had a stab at calculating the net present value (NPV) of those increased costs out to 2050. We can think of that as how big a pot of money we would need to have set aside, earning compound interest, if those liabilities were fully funded.
It reckons the NPV of the pension spending increase out to 2050 is 54 per cent of GDP. That is $150b in today’s dollars, only partially offset by $38b in the New Zealand Superannuation Fund. The NPV of the expectable health spending increase is even larger, at 66 per cent of GDP.
When those two factors are accounted for, New Zealand is no longer a fiscal outlier, but sits in the middle of the range for advanced economies, between Germany (with its challenging demographics) and Ireland (with its debt crisis legacy).
That sounded interesting, so I dug out the chart Brian appears to be referring to from the latest IMF Fiscal Monitor publication.
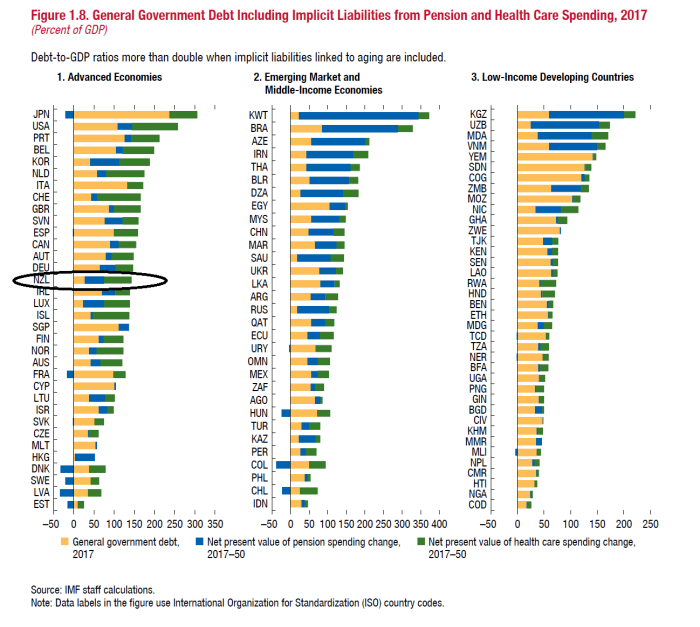
I don’t know quite how the IMF did their health and public pension numbers, or how comparable their estimates are across countries. But just take them as what they are (our pension numbers are high because, unlike many countries, we haven’t done anything to raise the NZS age). Allegedly, New Zealand is now in the upper half of the indebted advanced countries.
But this is a nonsense chart, adding apples and oranges. It might make some sense if every country had the same starting deficit/surplus, in which case future differences in discretionary spending associated with ageing might be the only difference in the projected future debt paths across countries.
In fact, some countries are in (cyclically-adjusted) surplus, and some are in (cyclically-adjusted) deficits. Israel, for example, is estimated to have structural deficits of 3.5 per cent of GDP, and the US is now estimated to have structural estimates of about 6 per cent of GDP. Israel is much further down that IMF chart than we are, but annual deficits of 3.5 per cent of GDP (before the effects of additional ageing) soon compound into very large numbers.
And New Zealand? Here are the IMF’s own estimates of the average cyclically-adjusted fiscal balance for 2018-2023 (their forecast period).
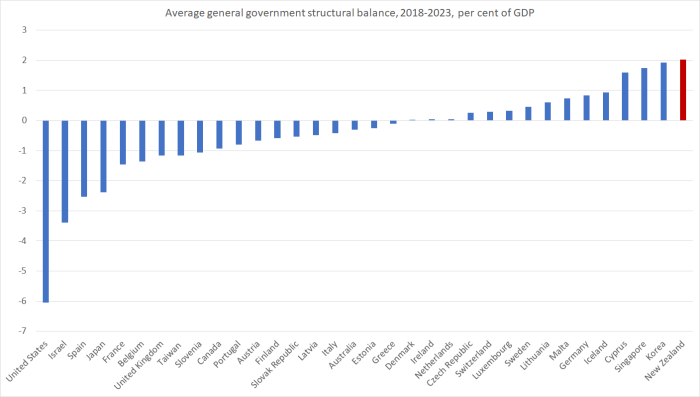
On the IMF’s own numbers we have the largest (structural) surpluses projected over the next few years of any advanced economy. Structural surpluses of 2 per cent per annum, in a country with high real interest rates, compounds to a very big (positive) NPV really quite quickly.
As it happens, Germany is also projected to be running quite large surpluses. No wonder markets aren’t remotely worried about fiscal/debt risks in either Germany or New Zealand. You simply can’t sensibly start with today’s debt, add one bit of additional future spending, and not take account of the baseline fiscal parameters that, in countries like New Zealand, mean we already have material fiscal surpluses (on the books, and in prospect). Fiscal people at the IMF sometimes liked to quip that IMF stood for “It’s mostly fiscal” (the problems, and macro solutions, that is). But they really should be producing better fiscal analysis than this (even if, perhaps, their main interest is big countries with both high debt and ongoing deficits).
None of which means I think NZS shouldn’t be changed. To my mind – as voter – failure to do so is both a fiscal and moral failure. But, despite those future pressures, by international standards our fiscal position remains very strong, and there is – objectively – plenty of time to adjust (even if I personally might prefer the adjustment had already begun years ago).

Personally, I think focusing solely on the debt/GDP ratio isn’t that wonderful. For a start, it’s confusing stocks with flows…
But also it doesn’t take into account other balance sheets in the economy. The household sector has built up a very sizeable Debt/GDP stock and as Ireland found out, depending on the nature of the shock, it can rapidly fall into the government’s balance sheet.
The NZ government is in a very strong position but with the economy operating at capacity, focussing on expanding its balance sheet to mitigate pressure placed on infrastructure due to excessive migration seems rather foolish. Surely it’s better to stem the pressure on capacity via immigration policy?
Expanding government spending now will exacerbate the imbalances already evident.
LikeLike
Not too sure why anyone measures debt/GDP. The measure sure be Debt interest versus net disposable income.
Household Debt is only $170billion plus investment property debt of $85 billion against Household house value of $1 trillion. therefore the debt is not very high.
Immigration policy is driven by Industry. Change the type of industries and you change immigration settings.
LikeLike
Also, I think cross-country comparisons are fraught with danger and creates a “one size fits all” policy prescription. Every country faces different circumstances. It irks me how the IMF try to do these comparisons and then puts a moral spin on it…
LikeLike
Fraught with danger, but also inescapable. One of my criticisms of the IMF, incl on the Board, was that they often do the comparisons v well (esp finding comparators relevant to NZ).
LikeLike
This may be a somewhat silly and naive question but why is our private sector debt so high? Is there such a thing as the “right” or “ideal” amount of private debt?
LikeLike
There isn’t a right or ideal level. Household debt in NZ – as in Aus or UK or Canada or Norway – is high mostly because of high house prices. When land use laws (and population pressures) make house/land prices absurdly high, younger generations buyying housing from older generations need to take on a huge amount of debt. Think of today’s young buying houses at 8 times income from a generation that might have bought their houses at 3 times income. Financing that produces a big increase in the ratio of household debt to income (and in the ratio of household deposits to income – as the sellers, or their heirs, realise the gains).
LikeLike
NZ Household debt of $177 billion is balanced by NZhousehold cash deposits of $170 billion and Kiwisaver of $60 billion. Therefore NZ household debt as a total is not very high.
Commercial business Debt including Investment property debt of $85 billion and Farm Debt of $60 bilion is due to lack of depth of the NZ capital markets. Most small business still prefer using debt as the cost of equity is the loss of ownership and control of the direction of the company.
LikeLike
I sometimes wonder if all this money being saved up for the future ‘social security burden’ will be kind of useless if there is nothing to buy with it when the time comes.
Surely a strong real economy with productivity growth and investment in labour-saving technology is how to best deal with a higher dependency ratio in the future today? Do more with less.
Keeping struggling solo mums today from heating their homes, paying for any educational extras or buying their kids proper coats and shoes and healthy food is supposed to save money to be spent on the pensions of the future??? Deliberately constraining her family’s consumption today is somehow going to make government more financially solvent tomorrow??? Business are going to go on an investment binge with the money not spent on the solo mum? We are going to see increasing productivity because government keeps taxing more than it spends, paying off bond holders (who do what different exactly with the cash???) and keeps the solo mum in her penury for this ‘noble’ goal?
Most likely this ridiculous parsimony will create a family of kids with low education, poor health and poor employment prospects and likely to end up “costing” a lot more – increasing the dependency ratio.
Like failing to maintain your investment property. No point in saving lots of cash if the house has to be demolished in the long run. False economy.
People need to get out a bit more, Go for a walk around some poor neighbourhoods. Spend a day in a decile 1 school and talk to the teachers. Ask yourself when NZ became Soweto for working class people. The chickens will come home to roost eventually in the form of reactionary populist politics and it will be ugly.
LikeLike
Social welfare is the price of peace. 61% of NZ tax goes towards social welfare, health and education already. How much more do you expect?
LikeLike
Out of a Net disposable Income of $180 billion, 90 billion is paid to taxes.
LikeLike