The Reserve Bank was out the other day with some research on the impact on house prices of the successive waves of loan to value limit restrictions put in place from 2013 to 2016. It was a rare Reserve Bank discussion paper – pieces typically designed to end up in a journal publication – to get some media attention. That was, no doubt, because of the rather bold claims made in the non-technical summary to the paper
Overall, we estimate that the LVR policies reduced house price pressures by almost 50 percent. ,,,,, When it becomes binding, LVR policy can be very effective in curbing housing prices.
Since nationwide average house prices (QV index measure) increased by about 40 per cent over the four years from September 2013 (just prior to the first LVR restrictions coming into effect) to September 2017), you might reasonably suppose that the researchers were suggesting that, all else equal, LVR restrictions had lowered house prices by almost 40 per cent (in other words, without them house prices would have increased by around 80 per cent). Of course, that isn’t what they are claiming at all.
The paper was written by several researchers in the Bank’s Economics Department (two of whom appear to have since moved on to other things), and carries the usual disclaimer of not necessarily representing the views of the Bank itself. Nonetheless, on an issue as contentious as LVRs, it seems safe to assume that senior policy and communications people will have been all over the communications of the results. Even if the Governor himself didn’t see it, or devote any time to it, it seems likely this paper carries the effective imprimatur of the Assistant Governor (Head of Economics), the Deputy Governor (Head of Financial Stability) and (at least in the bottom line messages) the Head of Communications too.
In the paper, the authors attempt to identify the impact of the various waves of LVR controls using (a) highly-disaggregated data on property sales, and (b) the fact that shortly after the first LVR restrictions were put in place, the Bank buckled to political and industry pressure and exempted lending for new builds from the controls (even though, generally, such lending is riskier than that on existing properties). By looking at the relationship between prices of new and existing properties before and after the various adjustments to LVR limits, they hope to provide an estimate of the effect on existing house prices of the LVR controls.
Trying to identify the statistical effects of things like LVR controls is hard, but I’m a bit sceptical of this proposed new approach. After all, if new and existing houses were fully substitutable a new regulatory intervention of this sort could be expected to affect prices of both more or less equally. People who were more credit-constrained (by the restrictions) would switch to buying new houses, and those who less affected by the contros (eg cash buyers) would switch more to existing houses.
In practice, of course, the two aren’t fully substitutable, for various reasons (including that most new builds are occurring in different locations – even in the same TLA – than most existing houses), but in the Reserve Bank research paper I didn’t see any discussion of the issue at all. If there is no substitutability at all then the research approach looks as though it should be reasonable, but that seems unlikely too.
But I’m more interested in whether the reported results are anywhere near as impressive as the authors claim.
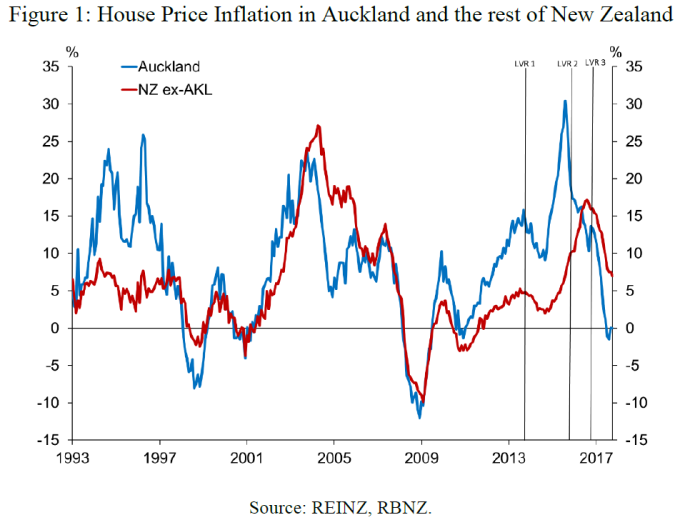
As a reminder, here is their chart of house price inflation developments, with the various LVR interventions marked.
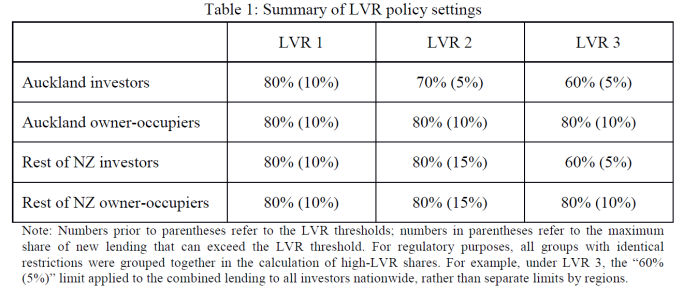
And here is their summary table of those successive interventions.
And here is their summary table of the impact of these LVR adjustments on house prices, as estimated from their model.
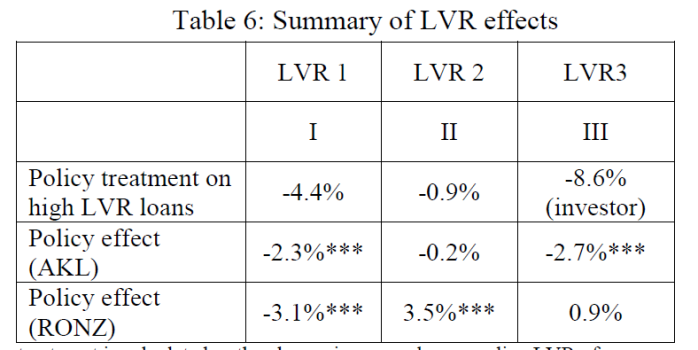
My focus is on the last two lines of the table: the estimated percentage effect on the various different intervention on existing house prices in Auckland and the rest of New Zealand (the three asterisks suggest that the results are highly statistically significant).
Take the initial LVR controls first (which had the added effect of being something out of the blue, shock effects of a tool never previously used in New Zealand). Recall too that, at the time, the big concern was about Auckland house prices and associated financial stability risks. On this particular set of model estimates, the effect on house prices outside Auckland – where there wasn’t a particular problem – was larger than the effect inside Auckland. In both cases, the effect (2 to 3 per cent) isn’t much different to previous estimates, or (indeed) to the sorts of numbers that were being tossed around internally before the controls were imposed. It was generally expected that the controls would have a temporarily disruptive effect, lowering house prices for a while, but the effects would wear off over the following few years. (There are some model estimates on page 9 of this paper the Bank published in 2013.)
And what about the second wave of controls (which tightened financing restrictions on investors in Auckland, and eased them for everyone outside Auckland)? On these latest estimates, those restrictions had no discernible impact on prices in the Auckland market at all, even though they were avowedly put in place because of explicit gubernatorial concerns about investor property lending in Auckland. On, on the other hand, the moderate easing in the rules outside Auckland was so potent that it full unwound the price effects of the first wave of controls.
And, finally, the third wave of controls. These represented a substantial tightening in investor-finance restrictions (especially outside Auckland), and a reversal in the easing (in wave 2) of the owner-occupier financing restrictions outside Auckland. And yet, even though the rule changes were materially larger for borrowers outside Auckland, there is no estimated effect on house prices outside Auckland at all (even though, in wave 2 the easing in owner-occupier restrictions, now reversed, was supposed to have had a large effect). And although the Auckland rule changes are smaller those outside there is no estimated effect on Auckland prices at all. These results aren’t very plausible and suggest that – even if the results are statistically significant – the strategy they used to identify the effect on prices isn’t that good.
One could also note that if one added up the effects across the three columns (which isn’t kosher, but still…….) the total effect outside Auckland is basically zero (actually slightly positive). Even in Auckland, the total is about 5 per cent.
One of the reasons why simply adding up the estimated effects isn’t kosher is because everyone has always recognised that LVR restrictions are unlikely to have long-term effects on house prices. They disrupt established established financing patterns, and thus can dampen house prices a bit in the short-term, but the effects dissipate with time.
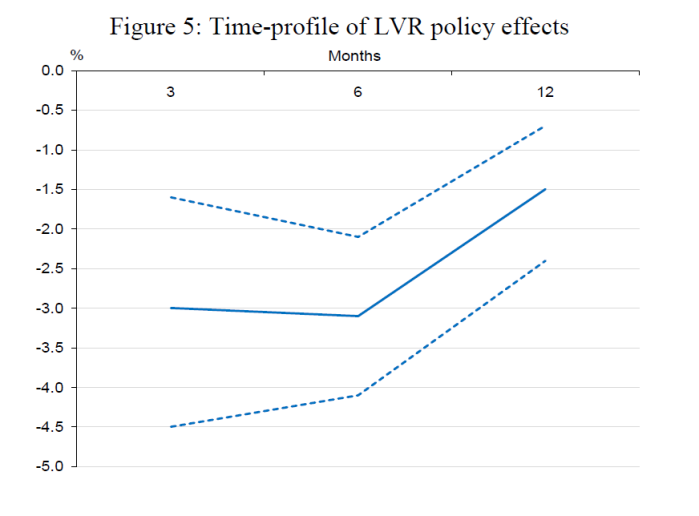
In fact, the Reserve Bank researchers illustrate exactly that point in this chart which (if I’m reading them correctly) relates to the first wave of LVR controls.
As the authors themselves observe
Figure 5 plots the point estimates with 95 percent confidence intervals. Overall, the effect of the first LVR policy on house prices occurs within the first three months and is relatively stable over a six-month period. Thereafter, the moderating effect declines somewhat (to around 1.5 percent after 12 months), perhaps owing in part to individuals having saved up the required deposit under the policy and a price differential having opened up between existing and newly built houses.
Any substantial effects on house prices don’t seem to last long.
To be fair to the Bank, and the former Governor, they never claimed house price effects would last for long. The argument was that LVR restrictions reduced financial system risks by altering the composition of bank balance sheets. That is another contentious claim, but it isn’t touched on in the current paper and so I won’t deal with it further here either.
So what led them to write (and their bosses to approve) the extravagant claim that LVR policies reduced house price pressures by almost 50 per cent? It seems to be this
The moderating effect of LVR 3 was clearly seen in Auckland with a 2.7 percent reduction in house prices. This LVR 3 effect is both statistically and economically significant, as during the same period the average house price increased by 5.8 percent.
Overall, we estimate that the LVR policies reduced house price pressures by almost 50 percent.
But
- as the table above shows, there was no estimated effect on all (from LVR3) outside Auckland,
- even inside Auckland, and granting their estimates, 2.7 per cent is under a third of pre-LVR price increases during that specific period (the 5.8 per cent that happened anyway, plus the 2.7 per cent they claim to have reduced prices by).
- as the chart aboves shows, on their own estimates, the dampening effects of LVR controls seem to dissipate relatively quickly (in that case half of the effect had unwound within 12 months).
- the estimate seems to take no account of the ongoing house price inflation outside the arbitrarily chosen period they measure.
Contrary to their claims, LVR policy is not very effective in curbing house prices. Indeed, its staunchest advocates never really claimed otherwise (for them it was mostly about financial stability), which does leave one wondering why today’s Reserve Bank management are publishing such overblown (and undersupported) claims to be made. As I noted earlier, over a period when nationwide house prices rose by about 40 per cent, this latest model suggests no sustained impact at all on house prices outside Auckland – despite significant interruptions to established financial structures and effective property rights – and probably quite limited effects in Auckland too.
Overblown claims about what LVR controls can do for house prices (especially with no discussion at all of efficiency/distributional costs etc) risk distracting attention from the real regulatory failures that explains the dysfunctional housing market. And they also detracting from the credibility of the Reserve Bank, whose legitimacy depends in part of being authoritative when it speaks.

LVR has a huge impact on credit availability which does impact on the ability to buy. This is particularly so for property investors with multiple investment property. If prices has risen by 40% and a 40% LVR is put in place, then that nullifies the increased equity position of a property investor. That effectively nullifies property investors ability to buy another additional property.
I would argue that there is any real increased bank stability as a result because banks assets are based on the lending amount and not on the house value. Banks usually lend on 20% equity for investors anyway which does require a 20% house value fall in order to threaten perhaps 33% of a banks lending portfolio. Only about 33% of property buyers are reliant on a high level of debt.
Unemployment and job losses is more a threat to bank stability if borrowers are not able to meet bank mortgage payments. A non performing loan is more a threat than a correction in house values. Out of control trigger happy Reserve Bank Governors create more bank instability by engineering recessions and consequently job losses..
LikeLike
Good article Michael. I especially like your conclusion.
“Overblown claims about what LVR controls can do for house prices …risk distracting attention from the real regulatory failures that explains the dysfunctional housing market.”
I have written an article discussing how to improve housing intensification to best take advantage of the government’s investment in Auckland’s congestion free rapid transit network. My work has a strong theme of removing unnecessary regulations inhibiting the housing market.
View at Medium.com
LikeLike
Brendon: before I make my objections I have to say I generally agree with most of what you write and certainly enjoy reading your attempt at a serious analysis of the problems with Auckland’s housing.
According to your graphic Hobsonville Point has been a great commercial success – and the little I can see of it from Beachhaven wharf and its advertising brochures it does seem to have created a successful community. However almost any investment made in Auckland housing over the last decade would be bound to be a commercial success – house prices went from high to stratospherically insane. There are objections to Hobsonville Point as an example for Auckland to follow: it took about a decade to build, has limited social housing, average prices way beyond most working young adults.
You are arguing for housing intensification to take advantage of congestion free rapid transit. But why do we need congestion free rapid transit? Answer rapid population increase. So it becomes rather a circular argument although one which on balance I go along with you. When we start looking at the timescales involved and the money involved we ought to be cautious. As a ratepayer and taxpayer it seems that while my council thinks hard about saving maybe thousands by transferring the cutting our berms contract from a NZ company to an Australian company it jumps at spending $28b on transport infrastructure with minimal financial analysis. If that $28b is divided by the population of Auckland it might be cheaper to bribe Auckland pensioners like myself to move to retirement villages in the tropics. A reduction in the pressure of population increase certainly would be useful.
A final point: these ‘unnecessary’ regulations – who decides which ones are unnecessary? To take a specific example I have a traditional standalone house on a 500sm rectangular site. Last week I contacted one of NZ’s nationwide building companies to investigate replacing the house with a two storey duplex as per their website. At present I’ve no idea whether it would be financially viable but a significant point would be the effect on the two houses either side. In both cases they surely would prefer the status quo but on the southern side their home is already a couple of metres below mine so a double sized building would rob their property of almost all its direct sunlight. So much will depend on council regulations and it would not be fair on my pleasant neighbours if the rules are arbitrarily changed just to satisfy developers.
LikeLiked by 1 person
This Labour government wants to put in trams along Dominion Road which largely consist of single housing. This venture is going to be a real dog unless they start to push up density to 50 level towers along Dominion road. The government has fenced up a lot of state housing in Mt Roskill or now called Puketepapa which does suggest increasing state housing density. Notice the government’s new mantra for immigration is “It is not about how many. It is about the right people for the right jobs in the right place.”
LikeLike
On 6 April 2018 the Environment Court gave its decision to enable the permitted baseline of dwellings in the Mixed Housing Suburban and Mixed Housing Urban zones from 2 to 3.
Whilst parties have until 7 May to appeal, its likely that this decision will come into effect.
The MHS and MHU zones will now be able to accommodate up to three dwellings without having to pass through the Resource Consent application process. A process that’s under severe pressure with no end in sight when efficiency will improve.
Now it gets interesting.
LikeLike
LVR has nothing to do with house prices and everything to do with stopping bankers going bonkers.
I banked with the Bank of Scotland; they were carefully chosen for being the most boring bank for over two centuries. I was never told when the lunatics took over the asylum. A quote from google: “”There is a shocking story that has still not been properly told. It concerns how the Halifax, a staid former building society, and safe-as-houses Scottish institution Bank of Scotland could embark on a £30bn merger and collapse just seven years later – with all of that value completely wiped out””
LikeLike
What surprised me about Bank of Scotland was when I was undertaking a due diligence on a property company set up by 2 British migrants to acquire land around Hamilton and most of Waikato and the development into residential tenanted units aimed at the student market.
Bank of Scotland had loaned this NZ company based on NZ property as collateral amounting to $30 million if I recall. As a property company they were very successful.
What brought the property company down was their venture into the Electrical/Electronic components retail business also funded by the Bank of Scotland out of the equity of their properties.
LikeLike
How can RBNZ write an article about prices of existing residential properties based on a sample of research confined to “new builds” only, but then apply the findings to the wider existing inventory of houses.
During the research period it should also be noted that
Commencing early 2015 China began an operation called “Skynet” to track down fugitive corrupt officials who had absconded with large amount of money to UK, CA, AU, NZ
Then there was operation Foxhunt. Followed by an operation called Hunting “Tigers and Flies” Then in 2016 President Xi lowered the boom preventing the export of local currency. House prices in Auckland (almost) immediately stalled
Personally I have never believed the IRD-LINZ data that produced a foreign buyer cohort of 3%. 3% of current year purchases maybe. But presented as 3% of the total stock of housing of 1.7 million is misleading.
Foreign cash coming in to the top end of existing housing is not the product of mortgages, and thus not influenced by LVR’s while in 2016 the banks themselves clamped down on local buyers using unsubstantiated overseas income (ie recent migrants). Overseas buyers tend to buy in clusters while local buyers tend to buy in domino-like cascades.
LikeLike
No, they use data on sales of both new and existing houses, looking at the change in the relationship between prices of new and existing following the introduction/variation of the LVR rules. It is what is known as a difference-in-difference approach – pretty conventional in empirical macro (and what I often do in words), the only real question here is the one I noted about degrees of substitutability.
LikeLike
President Xi Jin Ping was elected President for life. Coincidently or likely not, the many corrupt officials caught up in the various anti corruption campaigns were pardoned after a stint in re-education programs with their assets still intact in the possession of those same officials.
LikeLike
Rents rise around the country as cost crunch goes on landlords
There have been so many cost and regulatory increases over the last few years that it isn’t a surprise that rental prices are increasing as they are,” federation executive officer Andrew King said.
“Unfortunately the situation looks likely to continue.”
Gareth Kiernan, of forecasting firm Infometrics, agreed.
“Gradual rises in interest rates will maintain upward pressure on rents during 2018 and 2019, and landlords are also likely to try and recoup increased costs associated with tougher standards for rental properties, including improved insulation requirements,” he said.
“The extension of the bright-line test for capital gains from two to five years will limit the willingness of new investors to enter the market, thereby leading to further increases in rents.”
But economist Shaumbeel Eaqub said how much demand there was for rental properties, the number of properties available for rent, and how much people could pay, were much more important factors than landlord costs.
https://www.stuff.co.nz/business/103136899/Rents-rise-around-the-country-as-cost-crunch-goes-on-landlords
What’s up with Gareth kiernan?
LikeLike
Economist Shamubeel Eaqub again demonstrates how unreliable his comments actually are. If he bothered to check the news and the latest statistics and learn mathematics then he would realise that rents can go up because all you do is add another person to the household. Density per household is increasing. Notice the curtains on garages these days? Council allows up to 8 persons per household before it becomes a boarding house and require firewalls and sprinkler systems.
LikeLike
Multi-generational-homes
Does not include multi-family homes
Paul Spoonley tells us on Nine-to-Noon
Caucasion 10%
Maori 20%
Asian 30%
Pasifika 40%
Kathryn talks with Massey University demographer Professor Paul Spoonley about the changing face of New Zealand families and the factors driving the change.
http://www.radionz.co.nz/national/programmes/ninetonoon/audio/2018641029/paul-spoonley-farewell-to-the-nuclear-family
LikeLike
Where do we fit in: 1 Pom, 1 Kiwi, 4 Melanesian, 1 half Aussie, 1 half Samoan, 1 half Maori (that is 3 extra people and their other halves are complicated). Big house, not overcrowded.
LikeLike
Bob, Auckland Council considers households with more than 8 a potential fire hazard zone which requires firewalls between rooms and kitchen and in the ceilings if 2 level structure. Also water sprinker system needs to be installed. Otherwise your insurance is void.
LikeLike
GGS: 2 buildings on one site – both single storey and the Kiwi is under 2 so does she count? 1960’s housing so confident no firewalls. There must be many families in similar situation. I could use your comment to expel one of the kids.
LikeLike