New Zealand’s weak productivity performance has been an on-and-off theme of discussion for decades. We’ve been falling behind for 70 years now, something that was recognised by expert observers almost 60 years ago. In all that time, there has never been any sustained period when we’ve made any progress in closing the gap. A typical cycle seems to involve Opposition politicians – of whichever party – suggesting that they will do better, and that under their stewardship we’ll catch Australia, get back into the upper half of the OECD, or whatever. Once in office, the rhetorical concern often lasts for a year or two, and then typically nothing much else is heard or – worse – there are attempts to twist the data to try to render our underperformance less stark.
There was a bit of focus last year on New Zealand’s latest run of poor productivity outcomes. I and others had noted that we seemed to have had no productivity growth for almost five years. And, sure enough, Opposition parties picked up the issue to some extent, and the then-government attempted to play distraction and pretend everything was fine.
And then there was a change of government, and a couple of months later a new annual update on the GDP numbers. The new numbers saw estimates of GDP for the last few years revised up a bit and – since estimates of hours worked didn’t change – that translated through into a lift in estimates of real GDP per hour worked. In some quarters, a sigh of relief was breathed. And, to be sure, in this context more was undoubtedly better than less.
But when I dug into the numbers it still resulted in this chart

We’d gone from having no labour productivity growth at all (actually marginally negative) over the last five years to total productivity growth over that period of 1 per cent (ie about 0.2 per cent per annum). It is a little better than the previous iteration of data has suggested, but……it wasn’t anything to boast about. It shouldn’t have made anyone much less uncomfortable. And on the updated data this was the New Zealand vs Australia comparison.

Once a year, Statistics New Zealand release official estimates of annual labour productivity growth for what they label the “measured sector” of the economy, which covers around 80 per cent of the economy (total GDP). The latest release, including data for the year to March 2017, was out last week. The “measured sector” includes about 80 per cent of the economy, where Statistics New Zealand is reasonably comfortable about its real output measures (the main exclusions are education and health).
Unsurprisingly, there were some upward revisions in these numbers as well. The numbers don’t get a great deal of commentary, but the reaction seemed encapsulated in this chart from one of the banks.
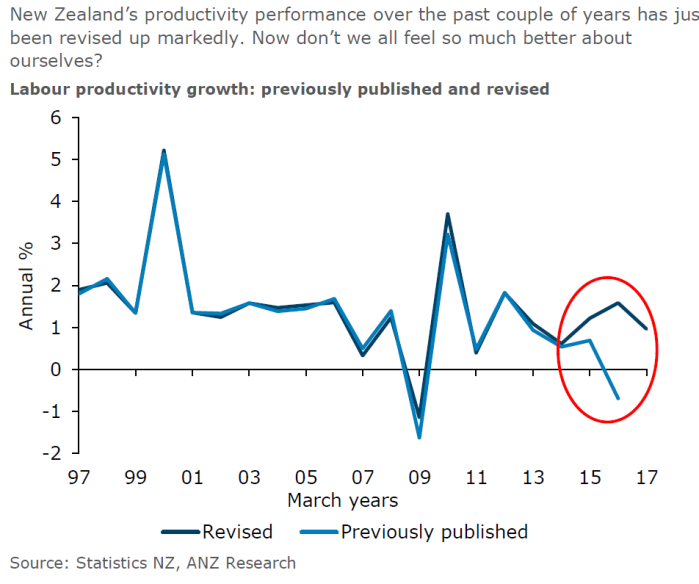
Not only were the numbers for the last couple of years revised up, but if you eyeball the chart productivity growth in the last decade doesn’t look much different than that for the previous decade.
That certainly looks more encouraging.
This is how productivity growth in (a) the measured sector and (b) the whole economy compare, based on the latest SNZ releases. Here I’ve used just production GDP – since it is production sectors SNZ uses to do the measured sector numbers – and have shown the data in log form, in which a constant slope of the line means a constant growth rate.

Recall that the measured sector is about 80 per cent of the economy. And for a gap of that size – the measured sector productivity growth was 17 percentage points faster than that for the whole economy over the 21 years – to have opened up it suggests that productivity in the non-measured sector (the rest of GDP) must have done very badly indeed.
This little exercise is purely illustrative. I’ve deducted measured sector productivity from the total, assuming the measured sector is indeed 80 per cent of the economy, and then multiplied what was left by 5 [(100/(100-80)] to produce a proxy residual index of implied labour productivity in the non-measured sector. This is the result.
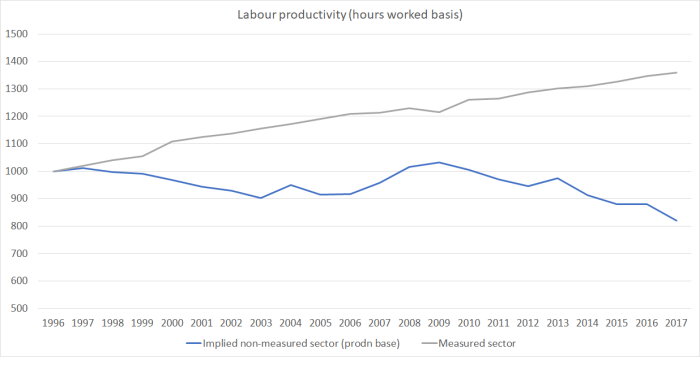
It is only a proxy, calculated residually, and the precise numbers are sensitive to the (changing) exact share of the non-measured sector industries. But the proxy suggests a pretty calamitous picture for productivity (especially, if summary numbers SNZ includes are to be taken seriously, in education) in the non-measured sector. Disgruntled parental consumer of the education system that I am, something doesn’t seem to entirely ring true – these aren’t, after all, quality-adjusted numbers. When, as a matter of policy, money is being thrown at education and (eg) teacher/pupil ratios are being raised, one might expect crude measure of education sector productivity to fall. But that doesn’t seem to have been the story of the last nine years – whether the educational lobbies, or the former government, are to be believed.
One problem with the measured sector data is that there is no ready way to compare New Zealand productivity growth numbers with those for most other countries. There are no standard compilations of such data and it would take a huge amount of painstaking effort for an individual to attempt to replicate the numbers for a reasonable range of other advanced countries. Given the importance of common global (or at least advanced country) trends in productivity, that severely undermines how much use can be made of the aggregate data.
However, the Australian Bureau of Statistics publishes some very similar data, for what it calls the “market sector”, also around 80 per cent of the economy. And SNZ themselves highlight the comparisons between the New Zealand and Australian productivity growth numbers in each of their annual releases. As they note in the latest release, over the period since 1996 (the period for which the two countries have comparable data), labour productivity in the measured/market sector averaged 1.5 per cent per annum in New Zealand and 2.2 per cent in Australia (Australian data is for June years). Over 21 years, those differences multiply up to big numbers – and, in levels terms, we had already fallen well behind Australia by the mid 1990s.
You might have hoped that all those differences were early in the period. Unfortunately, the SNZ/ABS data suggest not.

Starting from just prior to the 2008/09 recession (downturn in Australia) the relative performances of the two measuered sectors look depressingly similar to the pattern in the aggregate (real GDP per hour worked) chart I showed earlier. Over nine years, Australia’s market sector managed total productivity growth a full eight percentage points fast than New Zealand’s measured sector managed.
All these charts just use hours worked as the relevant input measure. Usually SNZ also publish (as do the ABS) the data using composition-adjusted labour input measures (eg if the amount of human capital per worker is increasing, as people get more skilled, that represents more inputs not higher productivity). I’ve become a bit more sceptical of such measures in recent years, since proxies for human capital are often educational achievement numbers, and much of what Bryan Caplan writes about – that much of formal education is about signalling rather than skill acquisition – I find increasingly persuasive. But this year I can’t even show you the numbers as SNZ ends their release noting plaintively
The composition-adjusted productivity in the measured sector data did not meet our quality standards for publication..The absence of this data does not affect any other data published in this release. We don’t have an expected release date for this data
Oh dear.
In sum, there isn’t much in the recent waves of productivity data/estimates that should give anyone serious about economic performance much comfort at all. There are, no doubt, countries that have done worse than us on this score in the last decade, but – starting well behind – we’ve made no overall progress in closing the gaps to other more advanced countries, and have continued to slip (quite materially) further behind our closest comparator, Australia.

When heavily government subsidised companies like Samsung with global sales of $350 billion with 300k employees, it is rather a nonsense for us to expect misleading productivity from farming and agriculture that already export 90% of their produce and have reached peak production with 10 million cows and 30 million sheep. It is nonsense productivity when you decide that a cow is more productive than a human being.
With our largest industries now in tourism and international students amounting to $15 billion and mainly in services then there is no way that we can even expect improving productivity as the best service is always with more people until AI robots can actually do those jobs. But at the moment AI robots still have to try and get a door opened and in my office we are still trying to get to the elusive paperless office afterall the techkies promised that goal 30 years ago.
LikeLike
Neils Bohr said “Anyone who is not shocked by quantum theory has not understood it” and this became paraphrased by Feynman as “If you think you understand quantum mechanics, you don’t understand quantum mechanics”. Following this website for the last year that is the way I grasp ‘Productivity’ as a concept described by economists.
As a layman I grasp the idea of producing something and the time and effort required to do so and maybe a year will pass and the next time with experience it is easier or maybe with age harder. Logically production per hour eliminates one variable but an important one when for example considering how German picked itself up after the war or China did after Mao. However Kiwis work long hours but the subject is productivity per hour so that leaves effort and technology as the other variables.
Someone proved that having children causes fathers to work harder, not just attempt to shift heavier loads but to be more thoughtful about it. The decline in having families and also doing so later means more men (and maybe women) are working in the more casual, indifferent manner of the childless. Certainly having children focuses the mind but this factor would apply to all countries.
Where I have had difficulty is grasping the comparative minor effect of technology on productivity. The last decade which are reportedly low in increased productivity has seen the ubiquitous use hand held devices that make work so much easier: not just my checking spelling but in one of my last jobs when working as an assistant to a chimney sweep his GPS directed him from job to job, he had a means of contacting customers to rearrange jobs when delayed, a simple means of finding who had the critical needed part, it was easy to raise an invoices and check payments and when things got tough taking a photo of a problem and asking an expert’e opinion in real time. Dramatic technological boost to productivity. The same common use of online resources must have help tourism and almost all wholesale and retail businesses.
I remain perturbed that productivity in NZ with its many small businesses is not improving far faster than most of our competitors and I’m stunned that places such as Switzerland or Denmark have per capita figures for productivity so far ahead of us. All the Kiwis I met abroad were reckoned to be both hard working but also pragmatic and productive. Is that the problem – our talent has gone abroad? Back to quantum mechanics – it might begin to make sense.
PS. Writing this lowered the productivity of my producing the evening meal.
LikeLike
My story – reduced excessively starkly to its essentials – is that our undoubted talent is in the wrong place. This is one of the more inopportune land masses on earth from which many people can find really good opportunities (more than issue than “working harder”).
But there is a real reluctance to confront this. At one level that is understandable, but it becomes reprehensible when it is downplayed not just about those of us already here, in place of keenly trying to get lots more people (of no special talent in most cases) to relocate here.
LikeLike
I concur about the no special talent. Banks will not loan money to poor people who need it but almost force it on to the wealthy who don’t need it. Sensible countries and immigration is similar; NZ ought to be searching for the exceptional talent that can chose to go anywhere and rejecting the low-talents that no other country will take.
However the subject is measured ‘productivity’. I wonder what the figures would look like if Auckland did not exist? Presumably it has had higher productivity than rural areas for say 150 years but you report the productivity bonus is less than other metropolitan cities. Auckland had a third of NZ’s population so if it was say 50% or 100% more productive than the rest of NZ then surely our productivity would match or exceed our competitors [mental arithmetic converts the 6% GDP per hour growth to about 20% or 36% respectively] . Or to put it another way if Auckland was as productive as equivalent cities in the UK (Leeds, Manchester, Birmingham, Edinburgh) we might be doing well. If that assertion is true then it is not NZ that has a productivity problem but my neighbours in Auckland.
A second oddity is that it is the growing cities in the USA that are generating the most wealth not the shrinking cities but in NZ the process is reversed – or at least it is in Auckland. How are Tauranga, Hamilton, Nelson doing?
LikeLike
Just received this email from Auckland council:-
“”The value of Auckland’s walkability
City centres are important to the economic prosperity of cities and nations. The large number of people located in close proximity to each other in city centres allows ideas to be quickly generated. Much of this transferring of ideas and knowledge takes place face-to-face. There is a strong relationship between connectivity and productivity. High concentrations of people, firms, and activities enable ideas and knowledge to be generated and easily shared””
With this link http://www.knowledgeauckland.org.nz/publication/?mid=1361&DocumentType=1&
maybe I’m worried about nothing.
LikeLike
Thanks., I might read it when i get time. But I’m sure one could squeeze several million people into (very walkable) downturn Wgtn and it wouldn’t change the fact that there are few opportunities here.
I will be interested to see how they have attempted to identify causal relationships.
LikeLike
The focus has been on bringing in more talented people which is the wrong focus. The focus should be on creating the jobs first that require more talent. With tourism a $11 billion dollar business the jobs are in low skilled labour. When you have an aging population, the jobs are in low skilled labour. With the focus on primary production no talent is required to attach a cow to a milking machine. Unfortunately all our largest industries require no talent other than a number 8 wire.
LikeLike
I largely agree (notably the second sentence). My proposition is that is unlikely that those opportunities will emerge on any scale, but if I were wrong then a reasonable case could be made for a liberal approach to (skilled) immigration to enable more people to share our prosperity. (Or we could simply decide to keep them to ourselves.) What is bizarre is the believe that the same failed strategy, run now for almost 30 years, of bringing in lots of people – mostly modestly skilled – will itself help transform the set of economic opportunities here.
LikeLike
It’s the mathematics again
Stuff.co.nz reports – In 2017 More than 37,850 work visas under partnership were approved last year.
https://www.stuff.co.nz/national/101821889/husband-defeated-as-officials-deport-wife-amid-concerns-over-their-marriage
So … An international Student comes to NZ … enrols at a PTE … does a Business Administration Diploma … applies for and receives Permanent residency. Then brings their partner in on a partnership visa … you know where that’s going
What isn’t clear is what area of the economy is going to absorb all the job-seekers with a Diploma in Business Administration … should they get a job using their skills and we get a doubtful boost to our productivity … that is then diluted by 50% on entry and eventual PR of the partner
But, that’s not the real issue … the real surprise is the number of them in relation to NET migrants of 70,000
LikeLike
A company like ABB which is a Swiss multinational company has sales of $50 billion with 136k employees. Productivity is a simple matter of automation. The more invested in automation the higher the turnover but does not require more employees.
As an accountant one of my jobs is to set up companies. Previously all I needed to do was to push a single button on a fax machine, send the fax to the Companies Office and the company is incorporated by the Companies Office, a government department.
Then they automated their back end process so I cant send a fax any longer. I now have to
1. scan the document and email into a computer,
2. save the emailed document into a relevant folder,
3. upload onto the Companies Office website which will then be reviewed by someone at the Companies Office and confirmed.
Therefore an automation process that is perceived by the Companies Office as improving productivity has meant that my productivity has been reduced considerable.
A one step process has been replaced by a 3 step process on my end.
LikeLike