In putting together yesterday’s post, I stumbled on something I hadn’t noticed previously. In yesterday’s post I showed only New Zealand saving rates – in particular, net national savings (ie savings of New Zealand resident entities, after allowing for depreciation) as a share of net national income. The net national savings rate has picked up quite a bit in the last few years, although not to historically exceptional levels.
But here are the New Zealand and Australian net national savings rates plotted on the same chart.

For the last couple of years, the net savings rate of New Zealanders has been higher than that of Australians. I wouldn’t want to make very much of a couple of years data, and over, say, the last 25 years, the average savings rate of New Zealanders has still been a little lower than that of Australians. But even that average gap has been much smaller over that period than over, say, the previous 20 years.
It isn’t a story you would typically hear from those who argue that savings behaviour is at the heart of New Zealand’s economic challenges. Some will point to the compulsory private savings system now in place in Australia (phased in from 1992). There is no easy way of assessing the counterfactual – what if the system had never been introduced? – but there is no obvious sign that the system has led to a lift in national savings rates in Australia, whether absolutely or relative to New Zealand. Others will (rightly) highlight the big tax changes implemented here in the late 1980s which materially increased the tax burden on income earned by savers (in a way pretty inconsistent with the recommendations of a lot of economic theory). I don’t think those changes were appropriate, or even fair, and would favour a less onerous regime. But in the decades since the changes were made, our savings rates have been closer to those in Australia (where a less onerous tax regime applies as well) than they were in the earlier decades.
One policy change that may have made a difference is overall fiscal policy: the improvement in New Zealand’s overall fiscal position (reduction in general government debt) has been larger than that in Australia (largely reflecting the fact that we were in a bigger fiscal hole 25 or 30 years ago). Higher average rates of public saving may have lifted average national savings rates to some extent.
What about other countries. In a paper I wrote some years ago for a Reserve Bank/Treasury conference, I illustrated that over time New Zealand’s savings rate hadn’t been much different from that of some other Anglo countries. Here is a more recent version of that sort of chart.

New Zealand’s national savings rates have typically been below those in the OECD group of advanced countries as a whole (and perhaps particularly some of the more economically successful of those countries – whether by chance, cause, or effect). But even on that score the last few years look a little different. This chart compares New Zealand against the median of the 22 OECD countries for which there is consistent data over the full period.
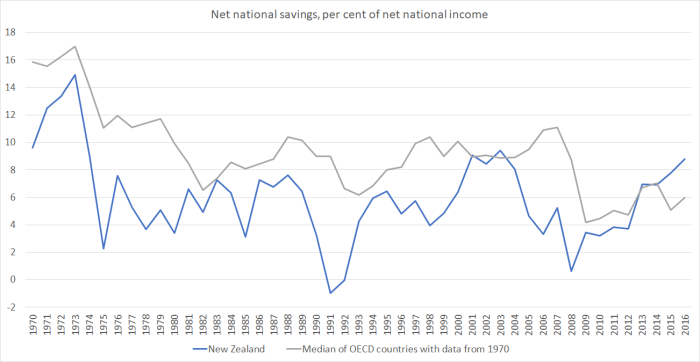
It is quite a striking change, and the reasons aren’t at all clear (see yesterday’s post on the puzzles around the New Zealand data). Perhaps in time some of the rise in the New Zealand savings rate will end up being revised away. Perhaps the lift will prove real, but temporary (as, say, happened for a few years around 2000). But if not, the apparent change in the relationship between our savings rate and those in other advanced countries should help keep our real interest rates – and our real exchange rate – a bit lower than otherwise. If sustained, that would be expected to lift our economic prospects a bit, all else equal.
But it is worth remembering that, all else equal, a country with materially faster population growth than its peers should typically expect to have a higher national savings rate over time than its peers. All else is never equal of course, but New Zealand continues to have a population growth rate well above that of the median advanced country.

I got lost trying to search the difference between National Income (NI) and Net National Income (NNI). After reading all those definitions one comes away feeling bamboozled with the repetitive references to “net-national-savings”
Your reference to the “big tax changes implemented here in the late 1980s” is a bit difficult for those visitors who either weren’t here or who have arrived since 2000
Are WFF, Accommodation Supplement and Student Loans included in NI and or NNI, coz the expenditure side of those components sure as heck would be which leads to the need to deconstruct Net National Savings into components parts of the Income side and the expenditure side to see which of the two are moving and in what direction. There are a number of permutations
so a newcomer migrant arrival into NZ who brings $3 million in cash here and drops it into a Term Deposit account doesn’t get counted?
LikeLiked by 1 person
sorry about all the terminological issues, but they do matter (and it is a pain to go thru them every time) – and esp in countries like NZ and Aus that have a significant negative NIIP position (ie using the savings of others) and in countries like Aus with v capital-intensive production models. Net national savings as a share of net national income is about as close as one gets to a comparable measure of the share of a country’s residents’ income not spent and set aside to actually accumulate wealth (not just, say, cover depreciation).
re the tax changes, I’ve covered them in other places, but the gist was that we went for allowing tax-deductions for contributions to retirement and life insurance products, and not taxing the earnings on those funds to the current system where contributions are from after-tax income and earnings are fully taxed (but final payouts are tax free). In the jargon, we now have a TTE (taxed, taxed, exempt) approach, which is quite unusual internationally. Andrew Coleman at OtagoUniversity wrote a recent paper on the switch and its possible macro implications – a paper I’ve been meaning to write about more fully, but haven’t yet.
https://ourarchive.otago.ac.nz/handle/10523/7292
LikeLike
Pardon a naive layman making a comment. You appear puzzled by differences in savings by date and by country. 50 years ago in the UK the biggest savings by household was in Fraserburgh and Peterhead (NE Aberdeenshire, locals call it ‘the Broch’). Initially this seemed strange because it is not a particularly wealthy area of the country (like your references to NZ being in the wrong place it is an outlying location). The reason for the high savings? Maybe partly the Church of Scotland puritan work ethic but mainly because they were towns that depended on commercial fishing which is a very high risk (both mortality and economics) so it made sense to have high levels of savings both for investing in your own boat, life insurance and the years the herring were in hiding. Maybe countries are the same with savings appropriate to circumstances.
LikeLike
I’m sure that is generally true (“Savings appropriate to circumstances”) – one reason why, having examined all the possible policy distortions that might more adversely affect savings here than abroad – I’ve long been more relaxed about NZ savings numbers than many NZ economists or policy people. But policy choices can make a difference: eg state pension schemes probably result in somewhat lower aggregate savings rate than otherwise (citizens save less than they would, and govts often don’t save much more). In principle, tax measures could also make quite a difference.
But even if there are no contributory policy differences, it is still interesting/useful to try to understand what about countries’ different circumstances gives rise to, eg, such material differences in savings rate. One factor may well be culture, altho economists are often uneasy about falling back to readily on “culture” as a story, such cultures are themselves endogenous.
LikeLike
Maybe in context ‘culture’ = ‘Savings appropriate to previous circumstances’.
What about the size of the economic units involved. I believe NZ has moved from protected unionised medium/large businesses to small and one man businesses – this would mean a need for more savings. Meanwhile family farms moving towards larger farming businesses would reduce the need for savings.
Then again if your small business needs say a new vehicle it can be bought with savings of debt. Current high property prices means we worry less about saving. For example I am contemplating buying a small business for my hard working daughter and her family; it will need maybe $400,000 but I’m relying on having a million dollar Auckland home with no mortgage to finance it. [Egg on my face if Auckland house prices returned to reality].
LikeLike
…NZs relative future investment requirements would no doubt have to feature in that ‘all else equal’ question…..the capital stock is barley treading water?
LikeLike
I would be put on enquiry re the comparison to Australia where the compulsory Superannuation contribution rate is currently 9½% and has been around the 9% mark for a few years. The total value of savings in the Super Scheme amount to $2.2 trillion – something doesn’t add up – if all workers and employees are tipping in 9½% how is the AU savings rate below 5%
LikeLike
Bear in mind (a) not all Australians are workers, (b) people to some extent substitute for other savings forms (eg in NZ Kiwisaver looks mostly to have substituted), (c) plenty of people are now spending their accumulations and (d) people have debt on the other side (if you are forced to put money into a super fund you will probably have higher gross debt than otherwise). Also, these are net numbers – the gross savings rate in all advanced countries is a lot higher than the net one. And govt savings (flow) is pretty low, and govt isn’t a small share of the economy.
The ABS is a pretty highly regarded stats agency, so I’d be surprised if there was a major problem with the numbers.
LikeLike
Maybe the average kiwi can no longer afford a house. So instead of borrowing to buy a house and then using all their money to pay down the mortgage, they instead save what little is left over after paying their bills. Or perhaps the rising house prices have scared people and made them save more. Probably I’ve got the economics all wrong – but if it isn’t just a statistical blip, then perhaps rising house prices might be part of the psychology of the increased savings.
LikeLike
Or older people are cashing in some of their windfall gain in house price and saving some of the profit until they find time to go on cruise liners. Personal experience.
LikeLike
Hi Michael
Savings is such an interesting topic, even if the more important topic is the way that savings are invested.
One of the minor difficulties in the analysis of New Zealand savings, and the comparison of current New Zealand saving levels with past New Zealand saving levels and international savings levels, is that statistical agencies don’t measure savings rates properly. In particular, they ignore the way the inflation rate affects the measurement of saving. The problem is the way the inflation component of interest income is treated. If a country is a net creditor to the rest of the world, their real interest earnings are overstated as the inflation component of interest income is incorrectly included in income. This means their savings are overstated. If a country is a net debtor to the rest of the world, their real interest payments are overstated as part of their interest payments are merely compensation for inflation, and their savings rates are understated. This has been a major issue for New Zealand in the past, because (1) NZ has had one of the largest net foreign debt positions in the OECD, approximately 100 percent of GDP; and (2) inflation has been in the 2 – 3 range. This means New Zealand savings rates have been understated by 2 – 3 percent of GDP – a non trivial amount. Similarly, and for precisely the same reason, New Zealand’s current account deficit has been overstated by 2 – 3 percent of GDP.
The recent global decline in inflation has meant the mis-measurement of savings rates has reduced. I suspect this is one of the reasons why an improvement in New Zealand’s saving rate relative to the rest of the world has been recorded, although I have not tried to estimate the magnitude of the effect for several years. (I wrote a short note on the topic years ago.) Inflation rates for the last five years have been at least 1 percent lower than they were in the 2000s decade, so about 1 percentage of the improvement in New Zealand’s saving rate is probably due to this effect. Even though international guidelines are completely clear on how to make this adjustment, Statistics New Zealand (and the statistical agencies in other countries) have decided not to make this adjustment. That means private economists have to do it. Such is life.
A more interesting question is how much, if at all, the decline in real interest rates have improved New Zealand’s saving position. When a country is a large net debtor to the rest of the world, a decline in real interest rates can significantly increase income. If the households and firms that borrow take advantage of the lower interest rates to repay debt (ie save) faster than they previously were repaying debt, saving rates will increase. I would not be surprised if this effect was material.
Andrew
LikeLike
Thanks for those comments Andrew. I touched on the distortion over time to NZ’s own savings rates from inflation in the earlier post, but forgot to pick up your international point in this one. Of course, Australia’s NIIP position is now similar to NZ’s and so it isn’t such an issue in straight NZ vs Aus comparisons.
LikeLike