The CPI data for the September quarter were released yesterday. They were the last for the period Graeme Wheeler was Governor of the Reserve Bank – charged with targeting inflation – although of course the lags mean that policy choices Wheeler made will still be influencing inflation through next year. The target Wheeler willingly signed up for five years ago was 2 per cent CPI inflation. In his time in office, he saw annual inflation that high only once (of 20 observations). On his preferred core measure – which is probably the best indicator of the underlying trend in inflation – September 2009 was the last time core inflation was as high as 2 per cent.
In fact, here is that (sectoral factor) measure of core inflation back a decade or so.

There are various readings one could put on that chart. On the one hand, core inflation (on this measure) has been astonishingly stable in the last six years or so. That would normally be to the credit of the Governor concerned. Then again, the same Governor explicitly signed up for a focus on 2 per cent inflation, and there has been no sign that the trend in inflation is any closer to fluctuating around 2 per cent than it was in 2012.
On the other hand, at the start of chart, back in 2006/2007 at the peak of the last boom, inflation was clearly too high (relative to the target the government had given us). Partly for that reason, I continued to recommend OCR increases throughout most of 2007. With hindsight – but probably only in hindsight – those increases weren’t needed. But my point here is to recognise that the gap between actual core inflation and the target midpoint (2 per cent) was materially larger then that it is now. As it happens, we didn’t have this particular core measure in 2007, but when we sat around the table debating what Alan Bollard should do with interest rates then, we knew a best estimate of core inflation was around 3 per cent (we were also pretty confident that the unemployment was well below a sustainable level). In fact, at the time the Bank’s Board was asking uncomfortable questions as to quite how 3 per cent annual core inflation squared with the statutory mandate of “a stable general level of prices” (I wrote a, from memory, slightly casuistical paper in response.)
So, if there are legitimate questions about the conduct of monetary policy right now – the Bank having already undone its 2014/15 mistake – they pale in comparison with those that should have been being asked in 2007. (As I recall it, Stephen Toplis was raising such questions then, and attracting the ire of the then Governor).
What do yesterday’s inflation data show?
I’ve previously shown a table of six core inflation measures
| Core inflation, year to Sept | |
| CPI ex petrol | 1.8 |
| Trimmed mean | 2 |
| Weighted median | 2 |
| Factor model | 1.8 |
| Sectoral factor model | 1.4 |
| CPI ex food and energy | 1.5 |
A couple of those measures are actually bang on 2 per cent. On the other hand, the Reserve Bank has been consistently clear in recent years that its favoured measure is the sectoral factor model (a statistical exercise that searches of underlying common trends in the disaggregated components of the CPI), and international comparisons often use a CPI ex food and energy measure (it is the one core measure the OECD reports for its member countries).
Hawks might be inclined to dismiss the Bank’s preference for the sectoral factor model as just “cover for a reluctance to raise the OCR to where it ‘should’ be”. I think they would be wrong to do so. It isn’t that long since the median core inflation measure was running materially below the sectoral factor model number, and the Bank was then asserting that the core inflation measure was a better guide. I wasn’t fully convinced at the time, but it seems that they were probably right.
We only have consistent data for all six core measures back three years or so, but even that is enough to illustrate the point. In this chart I’ve shown the sectoral core measure and the median of the other five measures.

The gap between the two lines was larger a couple of years ago than it is now. I don’t think many observers will find it that credible that in the sort of economy we’ve experienced in the last couple of years “true” core inflation has picked up as strongly as the blue line suggests. The general understanding of how inflation works, in settled and stable economies, is that there is lots of short-term noise, but that the underlying trend – the bit monetary policy should usually focus on – is pretty sticky and slow-moving. Personally, I find it more convincing to believe that core inflation has been pretty consistently low for several years than to suppose it has gone through the quite large cycles some of the other measures suggest. In support of this proposition, over the almost 25 years for which we have estimates from the sectoral factor model, it is easy – with hindsight – to tell a persuasive story about what was going on in that series. Less so with some of the other measures.
One other way to illustrate the point is to compare the sectoral factor model numbers to a couple of the other core inflation indicators for which there is a long run of data. This compares the sectoral factor model and the factor model (an earlier iteration, using a similar class of filtering techniques).
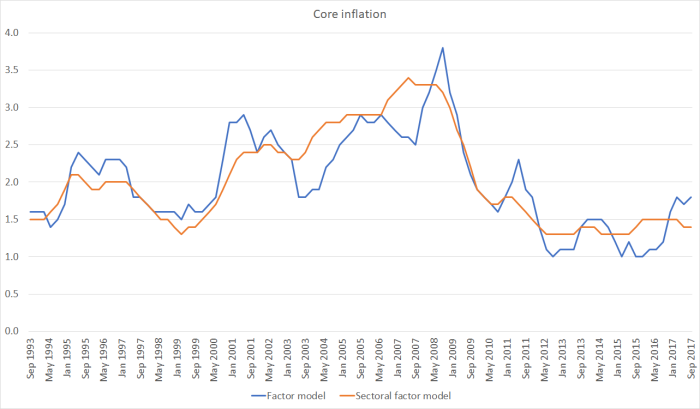
Or in this one a comparison of the sectoral factor model with the CPI ex food and energy (in the latter I haven’t manually excluded the 2010 GST spike).
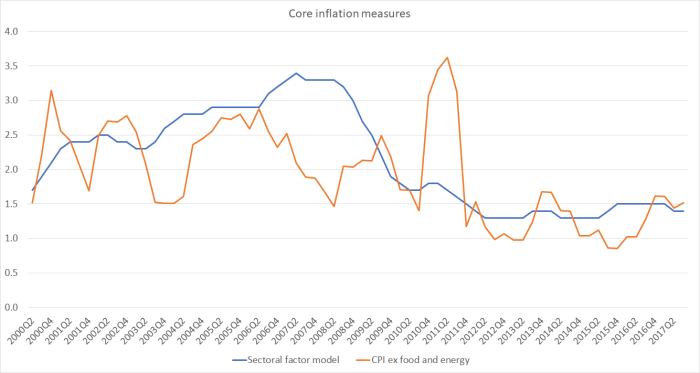
You will struggle to find an economist who thinks that, in an economy like New Zealand’s, the underlying trend in inflation is anything like as noisy as those other measures suggest.
We don’t have a formal Policy Targets Agreement at present, but for some years now PTAs have included this phrase
For a variety of reasons, the actual annual rate of CPI inflation will vary around the medium-term trend of inflation, which is the focus of the policy target.
There isn’t much sign either that the medium-trend of inflation is fluctuating around 2 per cent – where it supposed to have been – or that it has been increasing and getting any closer to target.
Here is another way of looking at the issue. Headline inflation is thrown around by changes in taxes and government charges, and although SNZ don’t (unfortunately) publish a series of CPI inflation excluding taxes and charges (as many other countries’ statistical agencies do), they do publish a series of non-tradables inflation excluding government charges and the cigarettes and tobacco component (the latter having been the subject of repeated large tax increases in recent years, which have nothing to do with the underlying inflation process). The data only go back 10 years or so, but here is what that chart looks like.
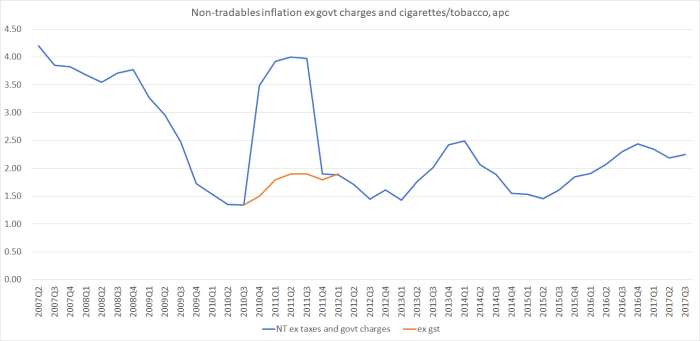
This measure of core non-tradables inflation is off its lows (in 2010, 2012, and 2015) but shows no sign of racing away. Construction cost pressures play a big role in this series, but even with the pressures in that sector, this measure of non-tradables inflation is currently running at only around 2.25 per cent. The 2014 peak was (a bit) higher. (Consistent with this story, wage inflation – although quite high relative to productivity growth – has also been showing no signs of acceleration).
I saw one commentary yesterday suggesting that if non-tradables inflation was above 2 per cent that was grounds for thinking about tightening – after all, 2 per cent is the inflation target midpoint. Actually, for decades non-tradables inflation has averaged well above tradables inflation. Our benchmark in discussions at the Bank was often along the lines of “a 2 per cent inflation target means tradables inflation averaging about 1 per cent and non-tradables inflation averaging about 3 per cent”. As it happens, for the 17 years the Bank has data on its website, tradables inflation has averaged 1.0 per cent, and non-tradables inflation has averaged 3.2 per cent (CPI inflation averaged 2.2 per cent).
If the Reserve Bank is serious about ensuring that core inflation fluctuates around per cent, they will need to be seeing quite a lift in non-tradables inflation from here. There is nothing in the data suggesting that lift is already getting underway. And, of course, that is largely why their own projections haven’t shown any OCR increases for some considerable time.
Against this backdrop, the troubling question remains why every commentator (I’ve seen) has been focused on the timing of a potential OCR increase (even if all agree it is probably still some time away). Core inflation is persistently below target, the best measure of core inflation shows little or no sign of picking up, and – not irrelevantly – the unemployment rate is still above any credible estimates of the long-run sustainable rate. It is not as if rapid productivity growth is driving prices downward either – some sort of “good low inflation”. Instead, there is no aggregate productivity growth. And few commentators seem to envisage GDP growth (headline or per capita) accelerating from here. Even if there are some encouraging signs in the world economy at present, it isn’t at all clear to me why one would think the next OCR change was any more likely to be an increase than a cut.
I wouldn’t be pushing for an OCR cut at present, but it isn’t hard to envisage how we might be better off if the OCR was a bit lower than it is now. I’ve resisted the argument that house price inflation should be an additional factor in OCR decisions, and I’m not about to reverse that stance just because house price inflation is (temporarily?) subdued, but for those who did want to give house price inflation some extra weight even that argument against further OCR cuts probably has to be put to one side for now.
In conclusion, I noticed this paragraph in the BNZ commentary on yesterday’s numbers
What is peculiar to New Zealand, however, is the very confused governance picture we have at the moment. Not only do we have a caretaker governor but we also don’t know who the incoming government is or what its expectations are for future fiscal stimulus, the Policy Targets Agreement and the Reserve Bank Act itself. Until these questions are answered it is very difficult to make any meaningful comment on future RBNZ action with any degree of certainty.
I’d largely agree with all that. It remains possible that the Bank could be operating under a different PTA as soon as next week (it happened to varying degrees in each of 1990, 1996, 1999 and 2008), and even then the (unlawful) caretaker Governor has little or no effective mandate to do anything much, minding the store until a permanent appointee is in place. Of course, even when all those uncertainties are resolved – Governor, and any (or no) changes to the PTA or Act – it will still be hard “to make any meaningful comment on future RBNZ action with any degree of certainty”. Doing so would require a degree of knowledge about future inflation pressures not gifted to central banks, or to private forecasters. We (more or less) know what we see now, and not much beyond that (ever).

IMHO, it is inarguable that nothing other than zero per cent annual core inflation squares with the statutory mandate of “a stable general level of prices”.
LikeLike
I have some sympathy for that (altho eg there are upward biases in the CPI, probably worth up to half a per cent per annum), altho with the current state of “technology” (zero lower bound), I don’t think it would be wise to pursue even “true zero” core.
Personally, I would probably favour amending the Act, to express an ambition along the lines of “medium-term stability and predictability in the value of money” (precise words would need more thought)
LikeLike
Love your blog, Michael. But I’m over ‘central-banking’. The ludicrously loose policy and QE around the West (esp BOJ, ECB, Fed) in my opinion has been immoral in how it has sacrificed the savings income of prudent elderly savers, and forced many into them over-valued sharemarkets where they shouldn’t be (unless, of course, they simply suck up the pathetic returns on their term deposits and live a lesser life). Central bank policy over the last ten years has effectively turned savers into unproductive speculators – indeed, we’re all forced to be speculators now.
BOJ simply won’t be able to tighten and is paying the bills of the Japanese government – how can that have a good ending? ECB won’t be able to tighten. Fed is great at talking it up, but I don’t think they will be able to tighten far so heaven only knows what happens when we get to the recessionary part of business cycle.
My question for you: do you think a central bank should also have within its ambit to cool these bubble financial asset prices they’ve created? Because I think the current level of debt in the West (due to central banks) and the historically and unjustifiably high sharemarket valuations, are the biggest threat to the West – economically and societally – since the height of the Cold War.
LikeLike
Thanks Mark
Having said that, I’m not sure where to start because I disagree with most of what you are saying, It would take a separate post to do a response justice, but just briefly, I think low interest rates are largely a real (savings vs investment) phenomenon rather than one brought about by monetary policy. One anecdote – just because i happened to be looking at it yesterday – is a 30 year German govt inflation indexed bond, with a modestly negative real yield. Monetary policy effects just don’t last long enough to explain anything like that. Consistent with my story, the gap between NZ and world interest rates hasn’t materially changed in the last decade, even tho the central banks you list have been lots of unconventional stuff, and the RBNZ (and RBA) haven’t.
On debt, my take tends to be that in much of the West there hasn’t been material further growth in debt over the last decade (as % of GDP). NZ is an example – even household debt/GDP isn’t materially higher than it was in 2007. In the US it is actually materially lower. Of course, in many of these countries there are big fiscal problems – the US, Italy and Japan the worse G7 examples.
That’s all very abbreviated, but the line you run is held by plenty of serious people, so I’ll think about whether I can do justice to the topic in a post at some stage. (But, re central banks, they should never be given the sort of mandate you suggest, because if they had it they would lose it when/if they tried to lose it, and in the process undermine some of the good aspects of limited central bank operational independence.)
LikeLike
If interest rates are priced by market, what’s point of OCR?
Noting I don’t think a central bank is any a construct of a free market; rather it denotes a command economy.
LikeLike
In a monopoly as NZ banks are then the market does not provide the best price. The OCR then plays an important role as a guideline that banks adhere too to not be caught by the Commerce Commision for violation of competition. It’s called gaming the system.
LikeLike
But, Getgreatstuff, what has that got to do with a free market? Bureaucrats picking interest rates, and the last 10 years stimulunacy, has been hugely damaging, as world will soon find out.
Here’s another thing: if we had actual market risk pricing money, not RBNZ’s artificially low rates, we’d have only half the last decade’s dairy conversions, and swimable rivers.
LikeLike
The risk is low as the NZ government have typically bailed out banks. In the 1920s depression no NZ banks collapsed. The BNZ was bailed out when it encountered liquidity problems. With massive amounts of credit available from QE interest rates in NZ is too high as the RBNZ has been interfering exstensively with the market.
LikeLike
Mark – this is my understanding of how real/market factors constrain the interest rates central banks set (Michael can correct me if I’m wrong). Broadly speaking, the monopoly a central bank has on the creation of currency allows them to set a short term interest rate – the rate at which they will create new currency and lend it into the economy. But if they set an interest rate that is too low for economic conditions, there will be an inflationary spiral and they’ll eventually be forced to raise (nominal and real) interest rates a long way. That was the mid-60s to mid-80s in most western countries. Conversely, if they set interest rates that are too high for economic conditions, they’ll create a depressing deflationary spiral and they’ll eventually be forced to cut rates a long way. That was the 1930s and (I think, to an extent) the period from 2011-2016 in most countries (because central banks refused to accept that economic conditions called for persistently low interest rates). So even though central banks have a “choice” about where to set interest rates, ultimately economic conditions make that choice for them – and if the central bank resists it will just have to move interest rates even further in their undesired direction in the long run! Market participants set long term (10+ year) interest rates based on where they think the central bank will have to move them eventually, and set short term rates where they think the central bank will actually (correctly or erroneously) set them.
LikeLike
Zathrus
But, by your own words, it still involves a command central bank to be modelling an economy. We who know the importance of free markets, and free markets pricing money (not politicians and bureaucrats), know that no central command can model the complexities of market economies. What if even their inflation modelling is wrong? Yellen is going to raise rates – and I wish she’d get on with it, because DOW hyper-valuations (& DOW is up 160 points this morning) are now totally detached from their ‘moderately’ (Yellen’s words) growing economy – sorry, Yellen is going to raise rates December based on the Philips Curve, but that model is no longer reading their labour market anything like accurately – that’s why Yellen can’t figure out why there is so little inflation and no wage growth given full employment. So she will raise rates against an inflation that is not going to happen based on a model that doesn’t, and can’t, read the complexities of that economy. I still hold that central banking (vis a vis Keynesian ‘modelling’) has brought the West to a point, via insanely loose (I call it immoral in the way it has destroyed savers) monetary policy, where we risk collapse every bit as deep and fundamental as when the Soviet command economy collapsed (and that economy/system looked strong right up until it didn’t).
Central banks distort market signals, and create the crises they were supposed to solve.
I also don’t agree with Michael that there isn’t a material growth in debt. He is reading this from a % of GDP, but debt levels have increased exponentially in volume and more importantly so much of that debt is junk (created by central banks). Google and read the story of Toys’r Us demise. Over 50% of those surveyed in Vancouver are worried about their ability to cover even a 1% increase in mortgage rates (thanks to central bank created property bubbles throughout West). A majority of Flyover America is single pay cheque away from default.
But time, and whether Yellen can tighten without bringing down Fed’s stack of cards – what in that sentence connects anywhere with free markets – will tell.
Disclaimer: I will admit to sour grapes. I decided two years ago share markets were growing dangerously disconnected from the ‘real’ economy via this Keynesian stimulunacy, so I have all my savings in tax efficient PIEs at investment grade banks earning a paltry 2.49% after tax. I have no regrets about that, it’s the right place for my wife and I to be, as we wouldn’t have time to recover from a significant and sorely needed market correction – but I watch these ludicrous returns this year and I can’t figure what investors are thinking – Hang Seng up 30% since January; every other market well into double digits, including Nikkei, and I’ve mentioned the loose as a goose forever policy of the BOJ, but factor in their dreadful demographics, which can’t be fixed and how does that wash out; DOW is up 29% since Yellen stated she thought it was over-heated last year, and … well, as I said, I believe we are beyond irrational exurberance, and I believe the guilty party is the practice of central banking including, overseas, immoral and frankly insane QE programs.
LikeLike
Addendum to my last post: what loose central bank policy since 2008 (at least) has also fatally done is encourage and even fund malinvestment, instead of letting malinvestment correct quickly via markets. And the more you kick malinvestment into the future, the uglier the correction has to be.
LikeLike
hmmm; I do struggle with the tension that exists between support for flexible micro labour and product markets and the implicit targeting of non-tradeable inflation at 3% to hit a macro 2% goal; in fact, improving productivity in the non-tradeable sector and/or increasing competition seems to be part of the typical ‘structural reform’ recommendation list? A stable price/quality path through time is perhaps a logical outcome of past reforms that have encouraged exchange based on (relatively) informed buyers and sellers; so agree, cut the OCR and let the additional demand belong to the most competitive offering….
LikeLike
Much faster growth in the non-tradables productivity would of course be welcome – and would close, to some extent, the gap between T and NT inflation. But, of course, it isn’t something the RB can do anything about. There are some reasons to expect NT inflation to be higher than T inflation – many non-tradables are labour intensive services, where there is sometimes less scope for productivity growth (the extreme example: an orchestra uses just as much labour as it did 100 years ago, and as a result concerts that were once cheap are now often rather expensive.
LikeLike
….or, the ability to view a concert online with a lag, has increased the demand for live performances.
As an aside, I was reading in one place about the global ‘saving glut’ and in another spot that global debt/GDP has never been so high: any thoughts on that one day appreciated as that seems a riddle!!
LikeLike
Actually it is very simple. Global interest rates are low. This discourages individuals from savings. Net income therefore flows into shares, bonds and property which offer a higher return from increased capital value. The Dow just hit another all time record. Private savers have reduced savings but institutional fund managers with excess funds will lend as portfolio managers have to balance the risk profile with a percentage of savings which banks on lend.
LikeLike
The lack of depth in our capital markets mean that businesses rely on debt. If the cost of debt is higher than our global trading partners we become very simply uncompetitive against our currency competition. Of course our high labour component will now be at $20 n hour minimum wage which NZFirst wants.
LikeLike