I was up early this morning to talk to the breakfast meeting of a Rotary club about immigration and economic performance in a New Zealand context (similar points to my LEANZ address last week, but shorter and a bit simpler). I hadn’t been to a Rotary meeting for decades, since going to the odd one as a teenager as my father’s guest, and somewhat alien as it was (altogether too extrovert for me, especially at 7am), it was also rather inspiring – people working together to make a difference in their community; some of George H W Bush’s “thousand points of light”.
In the course of my talk, I’d made my standard point that in New Zealand rapid population growth seems to have contributed to crowding out business investment. Whatever the reason, over the decades business investment as a share of GDP in New Zealand has averaged around the lower quartile of what has happened in OECD countries as a group. Driving home I remembered that a couple of months ago I’d downloaded all the data to help illustrate some of the stylised facts that bothered me, but had never gotten round to using the resulting charts.
All else equal – and it never is – a country that has faster population growth would normally be expected to devote a higher share of current output to investment than countries with slower population growth. That observation isn’t exactly rocket science. More people need more houses, and roads, and shops, and offices, and schools, and hospital, and factories. A country with no population growth at all could simply maintain its capital stock per person by devoting enough of current output to capital expenditure to cover depreciation. (To be clear, in all this I am using national accounts measure of investment (“gross fixed capital formation”), which (largely) measures resources devoting to building new stuff.)
Houses make up the largest single component of the reproducible capital stock (and almost half the total in New Zealand at present – note that this is houses, not the land under them). And since everyone needs a roof over their head, and almost everyone does, you would expect to find a materially larger share of current output devoted to house-building in countries with faster population growth rates. There is lots of short-term cyclical volatility in house-building activity, so it makes sense to look at average over a long enough period to look through cycles.
In this chart, I’m looking at the period from 1995 to 2014 and looking across OECD countries. I chose the period because quite a few OECD countries – especially former eastern bloc ones – don’t have data before then, and when I downloaded the data a couple of months ago a few countries didn’t yet have 2015 data. One year won’t materially alter the picture.
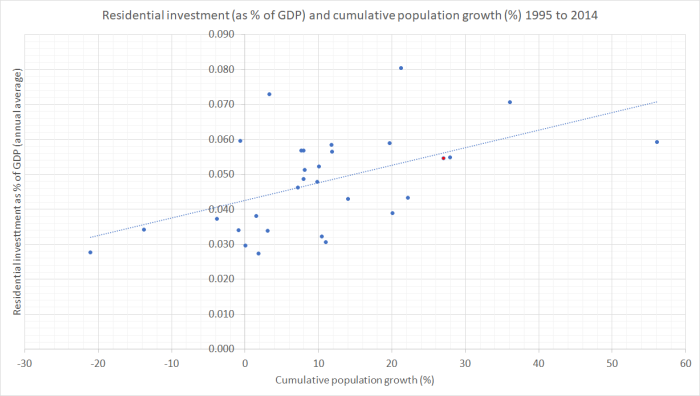
New Zealand is the red dot close to the line (above population growth of about 27 per cent).
The slope has the direction you’d expect – faster population growth has meant a larger share of current GDP devoted to housebuilding – and New Zealand’s experience, given our population growth, is about average. But note how relatively flat the slope is. On average, a country with zero population growth devoted about 4.2 per cent of GDP to housebuilding over this period, and one averaging 1.5 per cent population growth per annum would have devoted about 6 per cent GDP to housebuilding. But building a typical house costs a lot more than a year’s average GDP (for the 2.7 people in an average dwelling). In well-functioning house and urban land markets you’d expect a more steeply upward-sloping line – and less upward pressure on house/land prices. But that isn’t today’s point, which was simply that more people has indeed meant more residential investment.
But what about the business investment picture? In the data, business investment is a residual – calculated by taking total investment and subtracting housing investment and general government investment. Again, all else equal, you would expect a country with a faster population growth rate to have devoted a larger share of current output to business investment. Workers need “tools”, and if economies are going to maintain their trajectory of growth in income per capita, then the growth in the capital stock needs to at least keep pace with the number of workers.
(You might wonder why I look across countries, rather than just across time within individual countries. There are two reasons. First, in many countries there isn’t much variation in population growth rates. And second, to the extent there is, reverse causation may well be at work – a booming economy will tend to draw in more people. )
But here is what the cross-country chart looks like.
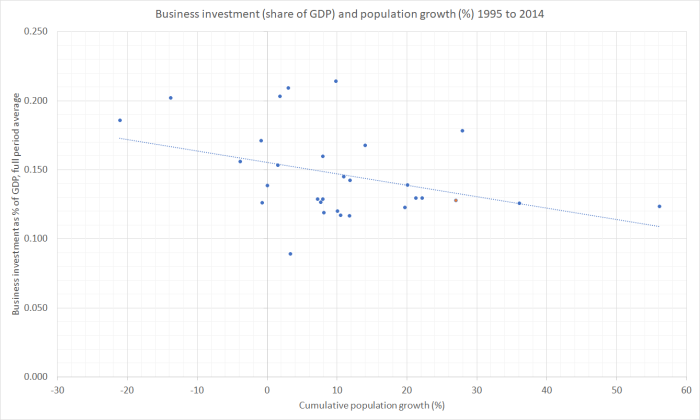
Again, New Zealand is the red dot near the line.
There is plenty of variation – not every observation is close to the line – but there is no sign at all of the expected upward slope. If anything, the regression line is downwards – the faster population growth was across these countries in this period, the smaller the average share of current output devoted to business investment. The (non-housing) capital stock per person will have been growing materially more slowly in the average high populaton growth country than in the low population growth countries. The countries with material falls in population were all former eastern-bloc countries, who might be thought to have lots of convergence (and investment) opportunities anyway. But even if one deleted them from the chart entirely – and recall that we too were supposed to have lots of convergence opportunities – the regression line is still very slightly downward sloping (basically dead flat).
It is a chart that should be pretty troubling. Even a modestly upward-sloping line would still be weaker than ones prior might lead one to expect.
Some readers with more of a background in formal economic research don’t like these scatter plots at all. They rightly note that it captures just a relationship between two variables, and there is a lot of other stuff inevitably missing. The relationship may be causal, but it might not be. One protection against that risk is the use of long period averages for 30+ countries. But, as importantly, scatter plots of this sort have to be taken together with the wider context – other stuff we know.
For example, is there a plausible mechanism that might account for such a relationship? Well, the notion of “crowding out” is a pretty well-established one in the economics literature. When the government increases its expenditure, the typical result (in a reasonably fully employed economy) is for private sector spending to fall. Higher interest rates and a higher exchange rate are part of the mechanism by which that happens. Whether or not there is a full offset is debated, but no one seriously doubts the mechanism or the direction of the effect. Investment spending tends to be more sensitive than consumption spending, with the exchange rate channel making tradables sector activity (sales and investment) particularly likely to respond.
Increased demands associated with faster population growth may well work in much the same way. The summary, scatter plot, data certainly isn’t inconsistent with such a story. In the New Zealand context, one of the stylised facts we have to grapple with is that our real interest rates have been persistently higher than those in other advanced countries, and our real exchange rate has fluctuated around persistently high levels. (And when I restrict the business investment chart only to countries with floating exchange rates, the downward slope is still apparent.)
So I don’t find the scatter plot in isolation conclusive, but it is troubling nonetheless – and should be for those who like to invoke the empirical estimates of large per capita income gains from immigration, again in a cross-country context. How likely are such gains, if countries with relative fast population growth rates (almost all, on account of high immigration inflows) are also the countries that, on average, have relatively modest levels of business investment? Firms invest to take advantage of the new opportunities that arise.
I’ve asserted that high levels of planned immigration have a disproportionate effect on investment in the tradables sector. These aggregate data don’t shed any light on that split – they are just total business investment. But, at least in a New Zealand context, it makes sense that things will have worked that way. Higher real interest rates than in other countries – unmatched by faster productivity growth – will deter all long-lived investment here, regardless of sector. But when the exchange rate is also boosted, firms considering new investment in the tradables sector are exposed to a double-whammy: highest cost of capital, and a less competitive position relative to foreign firms. Domestic demand tends to be strong in countries with fast population growth, while international demand is something New Zealand firms just have to take as given. As our export share of GDP hasn’t been growing – if anything shrinking – while those in most other OECD countries have, it seems reasonably likely that investment in theNew Zealand tradables sector has been much weaker than otherwise, and weaker than that in the non-tradables sectors. That weakness in tradables investment is likely to affect both our natural resource based industries (deterring more capital intensive modes of production) and in the struggling (where unsubsidised) other parts of the tradables sector.
For many countries, population growth isn’t that materially influenced by national policy. In the former eastern bloc countries, the fall in population is about natives leaving. In some other countries, illegal immigration can be a big issue. But in New Zealand – and Australia – policy makes a big difference. We have full control over our borders, and let in lots of legal non-citizen migrants. In New Zealand, in particular, it looks as though discretionary policy choices have worsened the business environment, and in particular skewing things against the prospects for strong investment by firms that could successfully take on the rest of the world.
(In case anyone is interested, somewhat to my surprise I discovered that there is also a downward-sloping regression line when one plots general government investment and population growth. I’d expected to find that the government investment just happened anyway – governments not being subject to market tests. But over these countries in this period it didn’t. If, optimistically, you think that government investment is a complement to private investment in improving economic performance, that should be particularly worrying. Even if the lagging government investment is just about keeping up with the numbers of schools and hospitals (say) a higher population requires, it doesn’t exactly look like a mark of success – whether in New Zealand, or across the OECD.)

Many of the CEOS who make it to the top in our corporations are political animals with no ability to innovate. They are great at running businesses for short term ROE and not very unfocused on the long term, this is mainly driven by how they are remunerated and how much equity they own. This is a global problem, competitive capitalism eventually sorts these businesses out however the process is terrible for staff constantly mindless restructuring “Petronius arbiter”. The troops were constantly reorganised into a state of confusion.
LikeLike
Our top CEOs are hampered by the lack of depth of funding. New Zealand businesses are highly dependent on debt to fund expansion. If the cost of debt is too high then that limits business investment because the margins need to be higher in order to fund the cost of holding debt. Most NZ businesses prefer debt rather than investors afterall the whole point of being in a business is being able to manage your own time and the direction of the business. With investors you lose autonomy and the investors set the direction of the company and also there is a percentage share of profits. With debt funding you are 100% in charge. With equity funding, you are not.
LikeLike
Presumably much of the ‘house building’ investment was private money therefor there was less available for capital investment.
During the latter part of the review period many Western governments were trying to reduce debt. This might have had a higher priority than increasing investment in schools and hospitals. If this austerity phase is over for political rather than economic reasons there might be more ‘social’ investment.
LikeLike
re housebuilding, yes but remember that any displacement can’t be quite that simple, as a country with a fast-growing population can borrow (larger current account deficit). at a global level, people in countries with high population growth would be expected to borrow from those in countries with little or no population growth (eg NZ/Aus on the one had, and Germany/Japan on the other).
LikeLike
Small business borrow from the equity of their homes to run businesses. Residential debt is usually 2% to 5% lower than Commercial debt.
LikeLike
It is not the population growth that is affecting business investment. It is the Reserve Bank aggressive intervention in interest rates under our trigger happy RB governors and now currently aggressive 40% equity LVR that is affecting business investment. Due to the small capital markets, NZ businesses rely on debt to invest in assets. If the cost of debt is too high or the lack of credit available to borrow then business investment is severely affected.
LikeLike
Productivity deceleration over the last 30YRS and under investment in our infrastructure explain a big chunk of the productivity puzzle
LikeLike
The new Waterview Connection is money well spent. Great job NZ Transit and the National government. I am blown away by how fast the traffic has moved throughout Auckland. It used to take me 45 minutes on Dominion Road to get from Mt Roskill to Mt Eden in peak traffic. If i use the suburban roads with lots of twists and turns I can get that down to 30 minutes. But ever since that Waterview Connection has opened, it now only takes me 10 minutes.
Yesterday, I drove up to the Airport from Mt Roskill to cheer the Americas Cup arrival. It was a fast 10 minutes as well. Must also thank Auckland Airport for the free parking they provided for the cheering fans.
LikeLike
yes sounds like a big positive for productivity numbers going forward.
LikeLike
The National governments direction on Roads of National significance is proving to be a good one. The big puzzle with rail is how to get there and where to park. Len Brown’s and Phil Goff pushing for rail is starting to look rather redundant and a white elephant. That initial Intercity rail from city to Mt Eden is going to cost $3 to $4 billion by the time they are completed. What a waste of money. There is no way I would ride a bicycle to get onto rail if I am more than 10 minutes walk away.
LikeLike
….is this roughly right: NZ business folk have (increasingly) found labour cheaper than capital so invested in activity requiring people to serve local markets rather than investing in capital to serve distant markets; if so, begs the question – has this been profitable despite a dent to aggregate productivity? No data guru (sorry!) but could anything be inferred about historical returns on capital in NZ businesses via national account data? (similar to this note):
Click to access ES_19_2015-08-18.pdf
LikeLike
I’m not sure anyone has ever done the data analysis of that sort for NZ – not even sure the data are readily accessible, But, on average, you would have to assume that returns here have been relatively high – they have to be to cover the higher (than overseas) cost of capital, implied by a persistently higher risk-free rate. I’ve seen people try to reverse the argument – “see, returns on capital are high here so there must be lots of opportunities”, but in fact it is only the relatively most number of projects able to meet those hurdle rates that get done.
Re your first sentence, it isn’t so much that labour is cheaper than capital, as that when the marginal costs of labour and capital are roughly equalised not that much capital (per worker) is deployed. And yes, it does look as tho there has been a skew towards domestic industries, more so in the last 13 years or so since the exchange rate really stepped back up.
LikeLike
Hi Michael
This relationship between business investment and population growth is quite well known in the older development economics literature – see for example
Higgins, Matthew and Jeffrey G. Williams (1996) Asian Demography and Foreign Capital Dependence NBER Working Paper 5560
Picketty wrote about it as well: a lot of the early part of the book examines the cross country relationship between population growth rates and capital intensity. In many ways it reflects the Feldstein Horioka result – that investment and savings rates are postively correlated across countries (ie that capital flows across borders do not fully offset the difference between investment opportunities and local savings). If you have rapid population increase, you need high rates of investment to keep per capital levels of capital (or innovation) high, and if foreign interests don’t provide all of the investment as a country you will need to save it yourself. This even an implication of the literature examining dynamic efficiency – the famous r > g equation that New Zealand has loved to ignore for five decades. The golden rule level of output, found when the return to capital is equal to the economic growth rate (population growth rate + per capita income growth rate) has the implication that places with faster population growth rates should have lower per capita capital levels when investment rates are positively correlated with saving rates.
Incidentally, there is a very similar relationship between population growth and residential building within New Zealand – residential construction is higher with places with higher population growth. This is because we don’t build enough bridges for people to live under, and so have to build houses for them to live in. In the last two decades, Auckland has proved a bit of a laggard.
To my mind one of the curious aspects of modern monetary economics is how much it ignores population growth. It is never asked whether the monetary policy suitable for regions of a country with fast population growth is suitable for the regions of the country with slow population growth, but it is no means obvious that it is. There is evidence that the interest rates prevailing in rapidly growing cities in small countries are higher than the interest rates in rapidly growing cities in large countries. This is not the case in large countries where real interest rates are lower in fast growing cities than slow growing cities. (This may be the reason why the highest average real interest rates in any city in the OECD since 1950 were experienced by the citizens of Auckland, 1990- 2010.)
Oh, there is so much that is interesting in this space. Unfortunately, finding clean ways to unravel the data to find out which relationships are spurious and which relationships are causal is quite challenging. Knowledge is advanced most reliably when theory and data point in the same direction and are robustly tested. Pointing out the main features of the data, as you do, is clearly a good starting point.
Andrew
LikeLike
Thanks Andrew. I”d forgotten Piketty had dealt with that material – must go and dig it out of the garage.
LikeLike
Is NZ Governmental immigration policy a written tome set in concrete somewhere setting out the results to be expected from that policy, or is it an accumulation of bubble thoughts collected over time
LikeLike
The above enquiry is prompted by your Rotary Address article
LikeLike
I’m not sure there is one single source. I’ve used MBIE’s post-election briefings to the Minister of Immigration – the source of the imfamous “critical economic enabler” description of our immigration policy – and also things like the MBIE Migration Trends and Outlook. But i don’t think there is any serious dispute that the bulk of the programme is designed with economic benefits (to NZ) in mind. There are bits round the edges – eg refugees, and working holiday programmes – but the bulk of the story is deliberately economic in focus.
LikeLike
To coin your phrase “designed programme” brings me back to square one. Is this programme (for want of a better word) a set of instructions somewhere being followed by someone – it must be – some minions somewhere down the line will have scribed there understanding of a set of instructions from a supervisor and those written records have been handed over to the next incumbent on the departure of the previous office holder, then to the next, to the next, to the next and so on ad infinitum – that’s really what happens – and it becomes a bible which then gets refined – betcha
Maybe it’s time for the lever-pullers to get a grip
LikeLike
Sure, but there is a succession of quite detailed Cabinet decisions seting out policy in each of the various areas of immigration policy. The residence approvals target, for example, was revised by Cabinet only late last year, and only a couple of months ago Cabinet revisited various aspects of work visa arrangements.
LikeLike
Changing that residence visa target downwards still did not stop net migration record of now 72k 8 months later.
LikeLike
Interesting stuff. A few semi-random thoughts: –
-it would be interesting to see US building numbers for no/lo/hi growth cities. Don’t suppose they are available? It would have the advantage of reducing some of the other factors such as labour/materials costs, building styles that may vary more between countries.
-cost of construction might be interesting to factor in. I believe NZ has relatively high construction costs, so might suggest we are putting less into building houses than the line would suggest would be appropriate.
-is it possible to do a pop growth vs int rate graph to see if there is a correlation between the two as you suggest.
-this may not be conclusive evidence of an impact of population growth. But I would expect those that disagree to be able to demonstrate why it is unrelated or irrelevant.
-shame you didn’t have this for your chat with Eric Crampton.
LikeLike
“Crowding out” is a bit passe these days, Michael. I don’t recall a single mention of the concept in my Macro 300 paper last year. And I was looking for it!
“Crowding in” is more in line with modern thought, admittedly post 2008 in mainstream economics.
Crowding out has basically met the same fate as Ricardian equivalence.
But you don’t need to believe me, try a Nobel Laureate:
https://krugman.blogs.nytimes.com/?s=crowding+out
I may be wrong, but I don’t recall secular stagnation appearing in your analyses – maybe you could apply some thought to that concept when trying to find solutions to problems that are bedevilling most, if not all, mature advanced economies, including the productivity puzzle. We are not alone in our travails!
On the latter, Irving Fischer of the U.S. Federal Reserve has recently opined that governments have the answer in the form of greater investment in physical and human capital. Given the experience of Japan since the 1990s, and my approval in principle of his suggestions, I’m not sure he has that right. But neither is crowding out.
LikeLike
If “crowding out” wasn’t in Stage 3 macro, that probably tells you more about academic macro. It is certainly very much alive in policy – ask the Reserve Bank (or Tsy) about the impact of a fiscal stimulus in an economy already at more or less full employment.
I recall that Krugman column, but it doesn’t affect my point. For a start, it is partly about Ricardian equivalence, which is a different issues altogether. But more importantly, Krugman was talking about an underemployed economy at the zero bound on nominal interest rates. In that world, monetary policy can’t do much more to boost demand, but fiscal policy can – and will succeed in doing so, unless there are some very strange adverse confidence effects. Krugman has no problem with the proposition of crowding out in a world with positive interest rates and full employment – he more than anyone in the wake of the crisis enjoined policymakers to remember the basis IS/LM analysis, whatever the greater apparent sophistication of modern academic macro.
Re secular stagnation, I have no particular problem with the thesis, but no specific expertise in it. This isn’t a global productivity blog – rather I’m mostly interested in explaining where we deviate from other advanced countries, rather than the common trends we all experience.
I presume you meant Stan Fischer?
LikeLike
Thanks for your reply Michael. I’ve been a bit too busy to reply earlier, but I certainly appreciate your thoughts.
Of course, I’m never going to cover all my bases in a brief comment, but, if I may…
I would be disappointed if Treasury still entertained seriously the notion of ‘crowding out’ post 2008, as it was expounded prior to that year. There is clearly a demand deficit in most advanced economies, including ours if we exclude temporary factors, mainly recent natural disasters, the dairy boom and immigration, and include demographics (i.e secular stagnation). And coupled with the microeconomic ‘reforms’ beginning in the 1980s, which swung the power equation inherent in the employer/employer tension excessively in the employers’ favour, the headline unemployment figures are no longer an accurate representation of slack in an economy. I think PK would not disagree with that, today.
In addition, a Venn diagram of government/private investment would show increasingly overlapping circles since the 1980s (not an adverse process, in my opinion, but), which, again, reduces the validity of the concept of crowding out.
I would just like to add that I don’t think one can analyse the NZ economy in isolation from the other (mainly) Anglo-Saxon economies. We are all (mostly all?) suffering from the same productivity conundrum. I think we won’t find the answer for NZ without taking into account what is happening those similar countries, albeit they not as subject as us to the gravity equation.
I don’t see an easy or obvious way out for us, to be honest. And I am increasingly coming to the conclusion that high immigration does not help.
And yes, of course, Stan Fischer. Debt deflation theory has been prominent in my mind for a while, given I live in Auckland 🙂
Cheers.
LikeLike