Perhaps all governments these days eventually do it, but one of the things that I’ve come to dislike most about our current government is the way they and their acolytes simply make stuff up. I could, I suppose, understand them not actually doing anything much. After all, they didn’t promise to do anything much.
But the endless spin, and stuff that is just made up, sickens me. Apart from anything else, I try to bring up my kids heeding the biblical injunction to honour those in authority over us. I don’t read that as suggesting people won’t disagree with those who hold office, but there is something quite sick about the political process – and perhaps about a society that tolerates this stuff – when so often one reads comments from senior ministers or the Prime Minister to which one can only explain to kids interested in such things that “they are just making it up”. We should expect much better than that.
I’ve written before about the current and former Prime Ministers’ dismissal of housing or conjestion problems as “quality problems” or “signs of success“. And there are the repeated claims that New Zealand’s economy is doing better than almost any other advanced country – a suggestion ably challenged in an article by journalist Graham Adams yesterday. But today, since it is the day Murray McCully leaves ministerial office after a very long period in ministerial roles in two governments. I wanted to focus on an unfounded claim in a recent speech to the New Zealand Institute of International Affairs by the outgoing Minister of Foreign Affairs.
He begins with an unexceptionable observation
The key feature of the past decade has been the rise of China, in terms of both our bi-lateral relationship, and as a regional and global power.
Not just of the past decade, but the past several decades.
And, as the Minister notes, there has been a big growth in bilateral trade (goods and services).
In my eight and a half years in this role I have seen our exports to China increase from around $2 billion to nearly $10 billion, and visitor numbers more than quadruple from under 100,000 to over 400,000.
But then he dramatically over-reaches
Had it not been for the dramatic expansion of trade and economic relations with China in the early years of the Key Government, New Zealand would have suffered a long and sustained recession, and all of the associated social challenges that we have seen in some European nations.
There is simply no support for this proposition anywhere in the rest of the speech.
The implication, of course, is that New Zealand has done well over the term of this government. But here is a chart of real GDP per capita for New Zealand and the United States, both normalised to 100 in the December quarter of 2007, just prior to the recession.
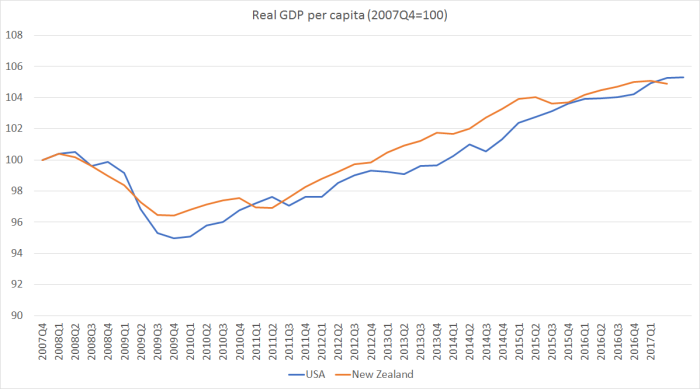
The United States, you will recall, was the epicentre of the financial crisis, and had a very nasty fall in house prices. The United States cut interest rates as far as they then thought they could go.
New Zealand, by contrast, had a relatively modest home-grown financial crisis (localised in the non-systemic finance companies), never reached the limits of conventional monetary policy, and had a much stronger fiscal position going into the recession than the US (or most other advanced countries had). Oh, and we the big bonus of a sharp fall in interest rates, as a country that had borrowed heavily from the rest of the world.
And yet look at the chart. The initial recession was certainly a little deeper in the US than it was here – but China wasn’t a significant influence on what was happening here in 2008/09. But then we had a double-dip recession in 2010.
For a couple of years it looked as though we might be doing a bit better than the US, at least on this metric, but even that optimistic possibility has now faded away. Over the nine years shown, real GDP per capita has grown almost exactly as slowly in New Zealand as it has in the United States (average growth rates of barely 0.5 per cent per annum). You’d have to know economic data pretty well to be able to tell apart the US and New Zealand lines for the last six years or so.
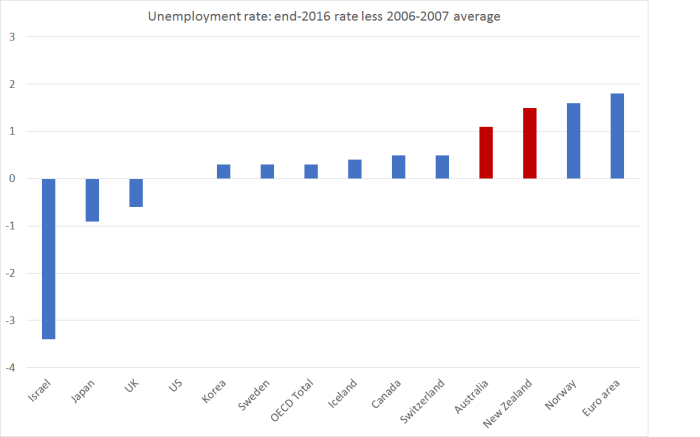
So we had a pretty nasty recession, which we took years to recover from. On some metrics – eg the unemployment rate – we still haven’t. And all that even though China took up a larger share of our exports. It is so even though in those “early years of the Key government”, China was a big source of demand driving activity in our biggest trade and investment partner, Australia.
The Minister seemed to be telling a trade and exports story – certainly those are the numbers he quoted. But here are exports as a share of GDP for the two countries, again back to December 2007.
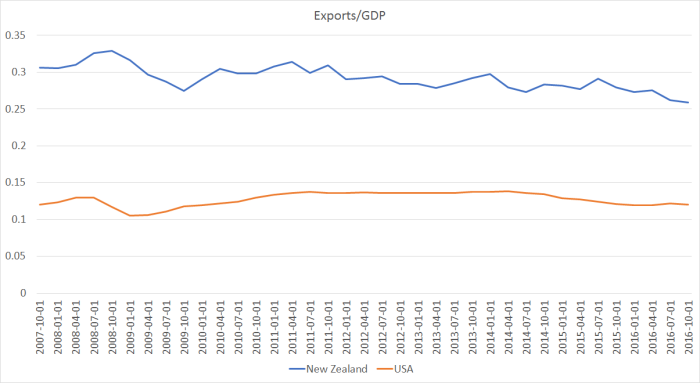
In both countries, exports took a hit during the recession – in the US’s case it was mostly volumes, while it our case much of it was prices (the fall in export prices). But, despite all that additional trade between New Zealand and China, our export share of GDP has fallen quite a bit over the last few years, while that in the US (always much lower, given that the US is a large country) has held remarkably steady.
Perhaps this fawning “China our saviour” line went over well when the Premier of China was visiting recently, but it really doesn’t amount to much at all. The country composition of our exports has changed – and for a couple of years perhaps high prices out of China for milk powder lifted farmer incomes – but as a share of the overall income, exports have been shrinking. We produce stuff (mostly bulk commodities), and someone buys it. In recent years, China has been a more important buyer – although Australia remains our largest export market – and the free trade market with China is likely to have been helpful, but it has hardly transformed our economic fortunes.
There are other differences between the US and New Zealand experiences. The US unemployment rate went up much more than ours did during the recession, but then came down much more sharply and is now a bit lower than ours.
But one striking difference over the last few years is in the estimated population growth rates.
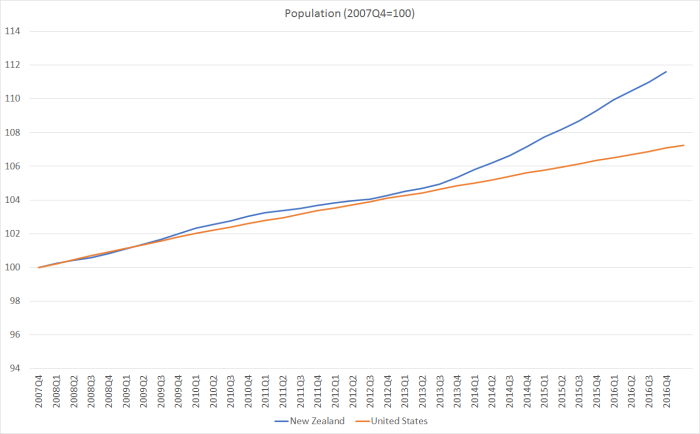
Overall, ours is a story of little or no productivity growth (none for the last five years), of an economy that – going by the headline statistics – seems increasingly inward focused, reliant on population-fuelled (and earthquake rebuild fuelled) domestic demand. And it is a pretty poor performance all round.
There are, of course, worse places among the advanced countries, and if that is all the Minister had wanted to say, no one could disagree. But instead he over-reached, suggesting that somehow we’d done well. We haven’t. And mostly that is down to our own choices – or, more specifically, those of the government in which Mr McCully has been a senior minister.

Michael, do you have commentary on how the low productivity might be improved? With reports recently suggesting halving dairy output where can real growth emerge?
LikeLiked by 1 person
It takes 10 million cows to generate $10 billion in GDP compared with 1.5 million people in Auckland to generate $75 billion in GDP. Dairy output is not very productive if you factor in that a cow eats the equivalent of 20 people. The amount of pasture land to feed 10 million cows could have fed 200 million people.
LikeLike
I still can’t follow you? I just looked out my window to confirm that my cows aren’t enjoying the fruits of their GDP production, it is only I in my warm house with all its consumer trappings.
The point that matters is GDP per capita. Maybe a 100,000 people generate the 10 billion in GDP from the 10 million cows so still much better GDP per capita tha Auckland.
Maybe the land could produce food for 200 million people but how many people would be required to produce tha food. Pakistan produces food for around the many people but GDP per capita is pretty grim
LikeLike
This does mean that GDP per capita is wrong. It does not factor in the massive input costs that livestock has on the environment. 10 million cows also generate the equivalent waste of 200 million people which in turn has devastated our environment with dirty waterways, unswimmable rivers and lakes, nitrate leaching into coastal oceans leading to poisonous algae bloom, devastating coastal fish habitats. The methane gas emissions contribute significantly to ozone depletion, increased rates of skin cancer in our region. Methane gas is also a green house gas which leads to global temperature warming, melting of the Antartica ice caps and climate change. Our island neighbours are sinking and our dairy industry is a significant contributor.
LikeLike
Japan has 125 million people and GDP per capita looks pretty good over there. What I am saying is that we are already feeding and handling the food production and the waste production of 200 million people to get $10 billion in GDP. Most countries with 200 million people has GDP that exceeds trillions of dollars.
LikeLike
“GDP per capita is wrong”. “GDP per capita looks pretty good [in Japan]”. You are being a little contrary I think. Then; “Most countries with 200 million people ha[ve] GDP that exceeds trillions of dollars.” But that is immaterial because most countries with around 200 million people or more are poor per capita and have low quality of life (Pakistan, India, China, Indonesia, Brazil, Nigeria). Yes dairying has it’s problems but cf to tourism at least it keeps those employed in the sector on a good income.
LikeLike
“Between 1850 to 1950 the development of the third world in India was greatly influenced by British rule. The detrimental effects of colonization, famine and nationalism during this time played a key role in managing to keep India underdeveloped and eventually once claiming their freedom leaving them known as a third world country. By examining actions taken by British rule during the nineteenth century and how the effects of colonization influenced India into the twentieth century we can see the impact colonization had in developing the third world.”
https://history105.libraries.wsu.edu/spring2015/2015/01/20/lingering-effects-of-western-european-colonization-on-modern-day-outsourced-labor/
India, Pakistan blames British colonial rule as a direct result of their third world status. The British Empire asset stripped at the expense of the local indigenous population.
LikeLike
This post https://croakingcassandra.com/2016/06/24/17690/ probably covers much of the background, incl various things I would support.
But probably the two most important changes I would promote would be:
– a much lower target rate of non-citizen immigration (something like 10-15K per annum, similar in per capita terms to the US intake of non-citizens)
– a markedly lower tax on business income.
The former would result in a materially lower real exchange rate, and interest rates more in line with the rest of the world. It would also respect the extreme limitations posed by our location – after decades, we haven’t been able to do much more than crank out more land-based exports, and some pretty serious constraints seem to be emerging there. This simply doesn’t look like an opportune location for many successful outward oriented businesses that aren’t natural resource based. Some will start here, but it will almost always be better (more valuable) for them to relocate nearer the major centres of world econ activity.
And lower taxes on business income – taxes which are almost entirely borne by labour in the long-term – would further increase the incentive to invest here, making the most of the able people we have.
Of course, things like fixed land use law should also be priorities, but they’d be much less relatively important if we weren’t putting so much pressure on the land (urban and other) from a deliberate choice to drive up the population so rapidly – and this in a location where the natives have been leaving for 40 years now.
LikeLike
A target of 45,000 leads to retaining 15,000 residency migrants if churn rate factor is taken into account. NZ businesses are small and mainly localised. Multinationals have only branch offices in NZ. For top positions, career development and large salaries, these are only available in larger cities. Therefore many new migrants, especially students given residency will only stay for 3 to 5 years before departing NZ for better career prospects in a larger city.
LikeLike
Would-Should first employ a McKinsey type-look-alike to submit a list of business and investment activities that are export orientated that can produce employment and export revenue in a remote location like new zealand.
Then ….
Re-arrange the immigration scheme to induce people of that bent to come to new zeakand and invest here and do their thing. If after 5 years there is no sign of success at the endeavour then they should be asked to hand there chits back in and turkey off and allow someone else to come and have a crack
LikeLike
They usually do not stay if they can’t make a go of it. There is a high churn factor. Many start businesses not realising that our small population does not sustain businesses. It is low volume high margin businesses that survive. Many adopt a high volume and low margin approach which does not work in NZ. Many inevitably fail as they do not fully understand that a low population requires different skills in business acumen.
LikeLike
Michael
Your comparison of GDP/Capita neglects debt. A quite substantial part of US GDP over the last decade has been debt funded where as I’m pretty sure that NZ’s per-capita debt (govt + corporate + personal) has fallen. I’m sure that if you normalized for that, NZ’s performance would be relatively quite a bit better.
Another comparative factor that needs to be recognized is income distribution. If their GDP growth has largely benefitted the top 1% and ours has been more evenly shared you would arrive at different conclusions .
Comparisons of unemployment rates are highly misleading given that their labour participation has fallen while ours has risen. Were you to recalculate that graph to show per-capital labour force as opposed to unemployment I think NZ would look a lot better than the USA.
Tim
LikeLike
Tim
I thought I’d replied, but must have failed to post the reply.
On debt, the US has had a big increase in public debt but a fall in private debt. We’ve had a modest increase in public debt and a modest increase in private debt. Overall, I doubt there is much difference. Another way of looking at it is the difference between investment and national savings in the 2 countries. Again, over the last 10 years the gaps for the two countries are quite similar, with us just a bit more dependent on foreign savings than them.
On unemployment/employment, I think it depends what you are trying to assess, As a measure of excess capacity, one should definitely look at unemployment – it is the measure of those willing and able to start work if only a job were there. Beyond that, yes employment/population is higher in NZ, but then labour is a cost – foregone leisure. In fact, we’ve only managed to produce similar GDP per capita growth to the US by using more inputs (that additional employment) – the counterpoint to the complete absence of productivity growth in NZ in the last five years or so.
On distribution you may be right (I’m not close to the figures) but my impression had been that the big shift towards the 1% in the US occurred in the run-up to the 08.09 recession rather than since.
LikeLike
Yes I agree with your thesis Michael, Key and now the current Prime Minister have long over played the China syndrome, and the TPP factor. It is one of the few areas that this government has actually made policy advances (following on the Clark govt mind you)
I agree with Tim’s comments though.
Also measures like real exchange rates etc are dangerous simplification of the issue. The NZ economy is now far more diversified, like the USA, a significant amount of exports is now earned in the “service” area “tourists” and “education”.
Traditional exports, beef, lamb, dairy, wine, kiwi fruit, are good base load income streams, and all would agree some of these sectors could do a hell of a lot better added value wise, but they are only part of the case you are making, not the whole picture.
LikeLike
Actually i put tourism mostly in the “land-based” category: people come for the scenery, not the great cathedrals, art galleries, or even the urban buzz
And sadly much of export education is an immigration rort – and even at the recent peak the number of student visas was only around the previous peak 15 years ago.
LikeLiked by 1 person
The most visited city is still Auckland with 18 million passengers in and out of Auckland Airport.
LikeLike
Michael,
Following your line of argument on the reduction of business tax, why not take it to its logical conclusion and reduce it to zero. If, as you contend, such taxes are eventually borne by labour, then this should have a re-distributive effect?
LikeLike
In principle I have no problem with that. In my ideal world, a progressive consumption tax would replace all income taxes. Hard to operationalise effectively though.
LikeLike
We should just adopt Singapores Tax model. 17% corporate and individual tax rate and 17% employer and employee contribution. Interest rates kept at 1%.
LikeLike
Correction 17% employer and employee contributions.
LikeLike
“..the endless spin, and stuff that is just made up, sickens me..” and “..there is something quite sick about the political process – and perhaps about a society that tolerates this stuff…” and I thought I was grumpy.
I came to this blog after reading the Auckland University report https://www.workerexploitation.co.nz/report . I have not managed to sit and read all 78 pages but take just this minor extract on page 38 (pdf page 53)
“However, this is not always the case for female students, some of whom are then vulnerable to sexual exploitation (Interviewee 104, also 67). Another informant (88) told of how a small group of Indian girls arriving in New Zealand on student visas were put to work in a sewing factory or brothels to pay the debt they owed for their airfare”.
A clear evil. The informant either told the truth or lied but given the academic source and the number of similar passages it should be assumed true until disproved. Where do we assign blame? Partly the students naivety, partly the agents in the home country overselling opportunities in New Zealand, partly the employers in NZ. However once the situation is clearly described and the government effectively does nothing then we are all responsible. Arguments about the economic value of the education market sound just like the pro-slavery arguments William Wilberforce fought against.
Yes the government has tightened things a little and yes there have been some prosecutions but nothing effective has been done; nothing that stops it in its tracks.
Other reported rorts such as buying businesses purely to obtain family residency and the residency by political donation are irritating. This exploitation to the point of slavery makes my blood boil. Clearly I will not be voting national again but which party is taking this issue seriously – are they all so worried about being accused racist that they cannot fight evil?
LikeLike
I wish to congratulate you on your blog articles. It appears that you have the attention of the purveyors of alternative facts in Wellington. You have the microphone. That the current incumbents have successfully used the 24 hour news cycle to convey nonsense that is buried by the next shovelful 24 hours later and are still using that principal is either (a) testimony to the gullibility of the masses becoming desensitised, or (b) the belief the masses are no longer listening or (c) the masses aren’t listening
The essence of your writings has been canvassed in the public domain for at least 8 years. With little effect. It has been ignored. It has not risen to the reach the ears of the mandarins in wellington – until now. They are hearing you. You have the podium. You have the lectern. I urge you to please keep it up
LikeLiked by 2 people
How it is done
Reminds one of this comment in the Otago Daily Times couple of years ago
He’s at it again – Art of deflection – by robyn-red-breast in ODT
If we analyse how John Key uses language to deflect questioning, (such as, as it has been reported, that he doubts that a person in China wakes up in the morning and randomly thinks “I think I’ll buy a house in Auckland”), we see that what he is doing is commenting on his view of how a Chinese person would or would not think; this response, which is an avoidance of responding directly to the question of housing affordability in Auckland, puts the questioner on the back foot and potentially disables the questioning. It is important, of course, that the questioner is not stymied and that he/she can get back on track. One way to do this is, obviously, is call him on what he is doing by asking him to explain what that has to do with the cost of housing in Auckland and its affordability for New Zealanders. By deflecting he avoids being called to account and also minimises the importance of the question.
These tactics can and are used by politicians of all persuasions but John Key has mastered the art and employs it very successfully.
22 July 2015 – ‘http://www.odt.co.nz/news/politics/349952/pm-painfully-out-touch-housing
LikeLike
I like the idea of an “Economic Transparency Act” or some formal independent measure like Graham Adams mentioned in the article you linked. Something that’s difficult to spin.
http://www.nzherald.co.nz/business/news/article.cfm?c_id=3&objectid=11613468
LikeLike
I didn’t have a particular problem with the idea, but (a) there is a huge amount of data out there already, which mostly isn’t too hard to find, and (b) there would still be lots of debate about what indicators were really relevant etc.
For a while – not sure if they still do it – MBIE was actually producing a rather good, chart-heavy, set of useful comparative information.
I suspect the biggest problem is a reluctance to consider alternatives (“there are none so blind as those who choose not to see”), the fact that the denizens of the economic bureaucracy (as distinct from the politicians) don’t have good persuasive alternative approaches, and a real reluctance to consider seriously something like mine (which involves quite a degree of unaccustomed humility for NZ – giving up the “big country” (or even mid-sized) ambitions that have been around for 100 years or more, and recognising that when the natives are leaving on the scale they have been for the last 40 years, it is telling one something about the relative econ opportunities here and in other advanced countries. It isn’t a matter of shame – any more than it should have been for Ireland or Italy in the 19th C – just the reality of geography and the nature of the (rather limited) opportunities it gives rise to now. Perhaps things will be different in 100 years – Ireland after all is now rich and successful – but let policymakers then respond to circumstances then.
LikeLiked by 1 person
Thank you for writing so well. I like the phrase “big country ambitions” – more food for thought.
I’ve only looked at the MBIE spreadsheets this week. As you say they are ‘rather good’. I have checked a few figures against their latest database dump ( R1 – Residence Decisions by FY.csv ) and found no faults. I cannot think of any reason why they should take more than say 5 minutes to bring up to date; in fact it could be automated to update at midnight every night. I will investigate further but if they are designed by a programmer clever enough to make them look so professional then they will also be well protected from tampering with.
I’m not too bothered by the delays because there is a built in latency between policy change and actual measured change. For example killing parental reunion must allow applications in progress to be completed and putting in a middling pay restriction will take time before (a) it dissuades potential students aware of their dumbness from applying to study (b) causes some current residents to return home (c) makes the current rorts and exploitation even more flagrant.
LikeLike
Largely agree about the data delays, except that the delays have the effect of focusing too much commentary on the PLT numbers, which simply aren’t very enlightening for many questions. Update the MBIE tables monthly and release them thru SNZ and they get a lot more attention (like, say, the building permits data).
LikeLike
Far be it from me to defend politicians, but you seem to have succumbed to the very disease you accuse McCully of.
He said:
“Had it not been for the dramatic expansion of trade and economic relations with China in the early years of the Key Government, New Zealand would have suffered a long and sustained recession, and all of the associated social challenges that we have seen in some European nations.”
from which you infer:
“The implication, of course, is that New Zealand has done well over the term of this government.” And then post a simple picture of NZ vs the US.
But McCully made no claim about NZ vs the US. At best, what he said could be interpreted as a claim that NZ had performed better than “some European nations”. In which case the relevant picture is of NZ vs Greece. Or Italy. Or Spain. Or…
More fundamentally, what he’s actually saying is that NZ-China links enabled NZ to perform better than would otherwise have been the case. This seems like a statement of the bleeding obvious, but if there really are any doubts, these can only be resolved by a comparison of NZ actual performance with the counter-factual, not by a comparison of NZ with the US.
LikeLike
I think there is something in your point, and I could have been clearer. I don’t think any credible observer would say that the difference between the Greek or Italian experience and NZ’s was China, so what I was trying to do was line up NZ’s experience with another floating exchange rate advanced economy, that clearly didn’t get a big boost from Chinese demand thru that period, and compare our experience. Had China been as much of a boon as McCully implied, one might reasonably think we’d have done better than, say the US (in fact, many NZers – including quite well-informed ones – seem to assume that we have done.
As I’m sure we both agree, identifying and assessing the relevant counterfactual isn’t remotely easy. But as total export volumes did nothing spectacular during the period, it is probably reasonable to assume that the milk powder would have been produced anyway and sold to someone else. And even if the prices had been lower then all else equal the RB would have set interest rates lower and the exchange rate would have been lower. It is a different story for the more recent surge in Chinese tourism – not in the early years of the Key govt – where the new Chinese interest probably is mostly a net addition to overall exports.
LikeLike
I cannot see how the USA has any comparison with NZ. US companies are the largest and the earliest technology adopters in the world. They are the leaders in the high tech sphere. They are innovative creative and market leaders and highly competitive. We are small niche players and tech followers. Our economy is still primary product based pretty much akin the economy of the Roman Empire.
US companies and investment created China.
LikeLike
If you don’t like the US – which i used mostly because good quarterly data are readily available – compare how with done against other smaller advanced countries that control their own monetary policies.
On real GDP per capita, using IMF WEO data, our growth rate from 2007 to 2016 beat Canada, Norway, Sweden and Swtizerland, but lagged behind Australia, Iceland, Czech Republic, Israel and Singapore. If you throw a couple of mid-sized countries, we did better than the UK and worse than Korea.
We just haven’t done that well. In aggregate we haven’t done that badly either – although of course our starting point was being poorer than all those countries except the Czechs. But as the boosters like to point out, our employment/population ratio has increased, suggesting that we’ve needed a bit more labour input than most to get the same additional output. Productivity is, as ever, the problem.
LikeLike
[…] The same week the Pike River video footage emerged, Michael Reddell, a relentlessly reasonable and unexcitable critic of New Zealand’s immigration policy, posted an exasperated piece on his blog Croaking Cassandra titled: “A Government that Simply Makes Things Up”. […]
LikeLike
[…] recession of 2008/09 was actually quite bad. I’ve covered this argument before, in a post after a speech outgoing Foreign Minister Murray McCully gave last […]
LikeLike
[…] wasn’t very grovelly – none of the nonsense Murray McCully was using just a few months ago about China saving us through the financial crisis of […]
LikeLike