I was having a conversation with someone the other day, trying to explain both what data there were on movements of people into (and out of) New Zealand, and which data was useful for what purpose. Reflecting on that afterwards, it seemed that a post might be useful. This follows on from my post last week on the Herald’s misleading article on “work visas”, but is intended to be much general, not aimed at anyone or any recent comment in particular, and to be something I can refer (others) back to.
For those who find my discursive posts a bit trying the quick summary is that if you want to talk about immigration policy – something that only affects non-citizen movements – use the MBIE data. MBIE, of course, could and should make it much easier to do so.
Being an island a long way from anywhere, it is pretty easy to count pretty reliably the number of people coming into or leaving New Zealand. Perhaps there are a few illegals who never declare themselves, but even if so it is a trivial issue for us.
And, of course, when you enter or leave New Zealand you have to fill in, and hand over, an arrival or departure card before you can continue with your journey. We know exactly how many people come in and go out. In principle, the data could be available daily, but in practice monthly is just fine. Statistics New Zealand publish that data.
But these data often aren’t that useful for anything. Even seasonally adjusted, this is what the quarterly data look like (in all chart in this post, I’ve annualised any quarterly or monthly data, so that you can implicitly benchmark it against the headline net annual inflows people are most familiar with).
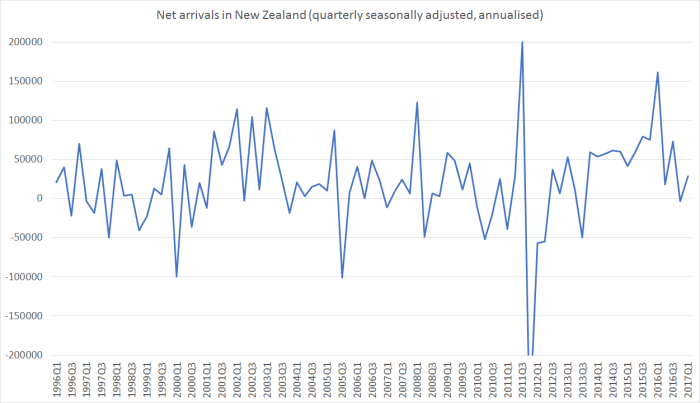
There is a huge amount of short-term volatility, and any new quarter’s information has almost no information value at all. After the event you can see the big net inflow periods around 2002/03 and over the last few years, but it takes a lot of time to discern any trends. Some of the volatility relates to identifiable one-off events: one can readily see the short-term inflows for the last Lions tour in 2005, and for the Rugby World Cup in 2011. Much of the rest of the volatility can’t easily be pinned down, or adjusted for, at all. So mostly (but see below) people don’t pay much attention to this series. Using total movements data is made even harder by the fact that SNZ don’t publish a breakdown by citizenship (even though they have the data).
The permanent and long-term migration (PLT) data are a (largely successful) attempt to look through the noise, and provide a reasonable timely indicator of (changes in) the number of people coming and going fairly permanently. If you say on your arrival/departure card that you are intending to come (or be away) for more than 12 months you end up in the PLT category. This is what that data looks like (quarterly seasonally adjusted, and then annualised).

There are still big cycles in this series, but the short-term volatility is much less than in the net total arrivals chart above (and it would be even more obvious if the scale on the second chart was not much more compressed than that on the first chart).
What is more, SNZ publish this data by citizenship. That enables us to separate out movements of New Zealand citizens, (who don’t permission at all to come and go), Australian citizens (who do need permission, but have been given ex ante blanket permission) and all other citizens, who need specific approval from the New Zealand government to come and stay. I showed the chart of New Zealand and non-New Zealand citizens a week or so ago.
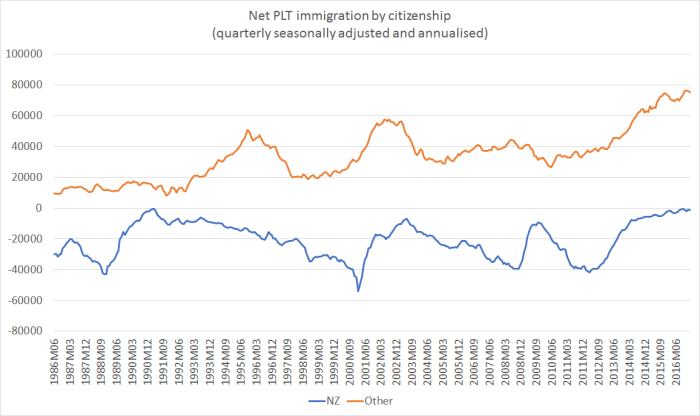
Both those series are also quite smooth. Usually, it takes only a few quarters to see if the trends in these series have been changing.
That can be really useful, at least in principle, for some purposes. If you are the Reserve Bank, trying to keep tabs on housing market pressures or overall pressure on resources, it is useful additional information. It is more important here than in many countries both because immigration flows are so large, but also because the scale of the cyclical variations – relative to the size of the economy – are larger than in most advanced countries.
It is also useful information if you want to comment on the behaviour of New Zealanders (coming and going), because it is all the data we have. New Zealanders don’t need permission to come and go (it is also the only data on Australian citizen movements, but the size of those flows, and the variation in them, is quite small).
But the PLT data aren’t ideal by any means – not even for the movements of New Zealanders. As we’ll see below, they probably pick turning points quite well, but for levels they can at times be quite seriously misleading.
And that isn’t because of ill-will or malice on anyone’s part. It simply reflects the fact the data rely on self-reported intentions. Sometimes people aren’t sure of their plans, but even when (probably mostly) they are, plans change. Plenty of New Zealanders head off to Australia, in particular, planning never to come back. But some won’t find a job, and others will just miss friends and family, and they’ll be back within 12 months. Others go, planning to be a way for only a few months, but they find they like it, a temporary turns more permanent, or perhaps they just fall in love. And if they ever come back, it will be an absence much longer than 12 months. And, even for New Zealanders, this all works in reverse: people come home, intending to stay, but actually…they miss the bright lights or whatever and are gone again a few months later.
Plans also change for non-citizens. After a few months, some find New Zealand isn’t all it seemed on the brochure, and some go home again. For others, they might have come for a few months, and then found opportunities for a work visa, or even eventually for residence.
You might think the differences/errors would be small, but often they aren’t. They probably don’t much affect the usefulness of a single quarter’s data, compared with that for the prevous quarter, and for macro forecasters that might be almost all that matters. But over very long periods, the differences can be massive (and unpredictable). Here is a chart showing the cumulative net arrivals for the last 20 years or so, from both the PLT data and the total migration data.
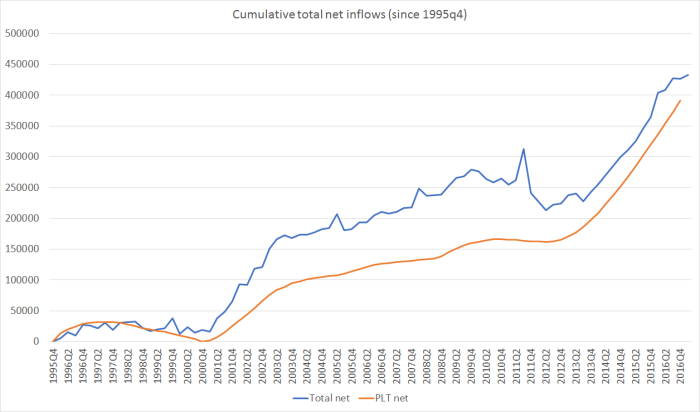
With this particular starting point, the cumulative gap isn’t that large at present. But at times it has been very large. (And the big differences at times aren’t just changes in the stock of tourists in New Zealand, or New Zealand tourists abroad.) Cumulatively, over this 20 year period we’ve a bit more actual permanent and long-term migration than the arrival and departure cards suggested. But in the last decade or so, it has been the other way round (as the gap between the two lines has materially closed). It isn’t easy to get a sense of how much of the differences are changes of plans by New Zealand citizens and how much by non-New Zealanders.
Statistics New Zealand recognise that the PLT numbers they publish – and which they themselves use in publishing quarterly population estimates for the periods between censuses – are no more than approximate indicators. Prompted by the Reserve Bank, a couple of years ago they published this note on work they had done on Alternative methods for measuring permanent and long-term migration.
Here is their opening chart, which highlights (in particular) the big gap between total migration (net passenger movements) and recorded PLT in the 2002 and 2003 period.

They identified three possible methods of working out (later) who actually was away for, or in New Zealand for, more than 12 months. Those methods produced impressively consistent results

As is clear in the chart, the actual PLT inflow over 2002 and 2003 was much larger than had been suggested by the reported intentions of travellers in the published PLT data (in fact, since New Zealand’s population was quite a bit smaller then, the net inflow as a share of population at peak was a bit larger than what we’ve seen – according to published data – in the last year or so.)
The limitation of these alternative methods is that they can be done only after a year has passed since the initial arrivals/departures happened. That is no small point, but it is hardly unique to immigration data. Our official GDP series are regularly revised for several years after the quarter to which they relate, as better annual data come available to Statistics New Zealand.
Unfortunately, Statistics New Zealand apparently has no money to update or report these better estimates on an ongoing basis. That seems quite extraordinary – although perhaps par for the course in underfunding important statistics in New Zealand – for data that plays such a significant role in economic monitoring and public debate in New Zealand.
The alternative methods don’t invalidate the use of the published PLT numbers for short-term cyclical analysis. Even though these are only annual charts, you can see that the turning points in the series are much the same as in the published PLT data. But if the absolute level of the net numbers can be out by so much – as SNZ themselves recognise in completing this analytical work – so, inevitably, will the absolute levels of the many of the derivative series drawn from the PLT numbers. Use the overall PLT numbers by all means for some short-term purposes (is the rate of population growth right now accelerating, slowing or holding roughly steady), but it is crucial to recognise the limitations of those data.
Perhaps the new Minister of Statistics could look at securing some budgetary funding for Statistics New Zealand, to enable them to move those alternative methods into becoming a regularly-published and updated part of the suite of official statistics?
But if you want to have an informed discussion about immigration policy – the choices by the New Zealand government as to how many non-citizens to allow to live and work here, under what terms and programmes – the PLT numbers really aren’t very useful at all. After all, the PLT data only capture visa types rather loosely, and many people change the visa they are on while onshore (including more than 70 per cent of those eventually granted New Zealand residence visas).
More importantly, we can use – what surely government officials advising ministers on immigration policy mostly use – direct administrative data generated by MBIE itself on the numbers and types of visas granted, and to whom they are granted. MBIE administer the immigration programmes, and grant the visas that are issued. They know exactly how many they have issued, and to whom. And they know when those visas are cancelled, and thus can tell you how many are outstanding. It is immeasurably superior data for discussions of immigration policy.
The problem is that although MBIE has this data, and presumably could update it every single day from its own systems, it is really quite hard for the public – and even analysts – to use it on a timely basis.
Once a year they publish Migration Trends and Outlook, chock-full of interesting charts and tables. And at the same time they provide accompanying detailed summary spreadsheets of the annual data both on the residence approvals programme – the centrepiece of our immigration policy – and on the numerous temporary visa programmes. Those tables are great.
But these publications are available only with quite a lag. Last year’s report, for the year to June 2016, came out in late November. Presumably the next issue is now at least six months away. For some purposes it isn’t a problem. For others, it is serious problem. Analysts cannnot simply go to the MBIE website (let alone the Statistics New Zealand website, where much of this should be accessible) and find easy to use summary data on a monthly or quarterly basis, seasonally adjusted where appropriate. Consider another set of administrative data. Building permits are also granted by government entities: Statistics New Zealand collect them from 70 or TLAs and make the data available, readily usable, by the end of the following month. Since only one agency issues visas, there is really no excuse for not having at least as good data (coverage and timeliness and accessibility) on immigration approvals.
MBIE do put out quite a lot of data on a monthly basis. But it is a series of enormous (eg half a million lines long) spreadsheets here. You could, if you wanted, produce your own summary tables, formatted along the lines of MBIE’s annual tables, on a monthly basis. You could, if had the technical capability, seasonally adjust the data yourself. But to do so is a major hassle for any ordinary analyst (public sector, media or whatever), the more so when one is used to statistical agencies providing accessible summary data, in usable formats and seasonally adjusted where appropriate. As I noted the other day, it took me an hour or so to generate 10 numbers on how many Essential Skills visas had been granted to nationals of various countries in the last year. By contrast, it took less than two minutes to download the comparable data for earlier years (from the MBIE summary tables).
It isn’t good enough. The outgoing head of MBIE, David Smol, and the Minister of Immigration should really make it a matter of priority to get this data out there, in readily usable form, on a high frequency and timely basis. It is inconceivable that it would cost much to do so, and by doing so they would help contribute to a much better informed debate on actual immigration policy. It isn’t as if, as in some countries, immigration policy is minor matter in New Zeland – like or not, even MBIE recognise that we have one of the largest per capita immigration programmes of any advanced country.
Now, it is true that for many of visa programmes, neither the numbers approved nor the make-up of those who receive approvals, change very much from year to year. Mostly, if you want to know about how many people, and what sort of people, we are approving, whether as residents, students, or the various classes of work visas, looking at the last annual numbers will give you a reasonable picture. There just isn’t that much noise in the series – and I commend the Migration Trends and Outlook tables to those, perhaps including those in political parties, wanting to offer deeper analysis or policy alternatives. But year old data simply isn’t good enough, when much more timely data are available internally – and could readily be formatted to be more widely usable by non-government analysts and commentators. Nature abhors a vacuum, and when it is so much easier simply to fall back on timely PLT data then, with all their limitations, too many people will do so. And the debate will be the poorer for that.
It can easily be done. For example, Education New Zealand gets the student visa data, apparently within a few days of the end of each month. They in turn transform that data into a fascinating monthly “dashboard” (an example is here). There is no reason why we couldn’t have official detailed tables, and a Hot off the Press from Statistics New Zealand, for these and the other visa categories. After all, immigration policy is (concretely) about how many visas we issue, to whom, and on what terms. When people want to talk about how many work visas have been issued, and to whom, they shouldn’t be going anywhere near the PLT data. They should turning automatically and instinctively to accessible data from the visa-granting agency.
And when people want to debate the medium-term contribution of immigration policy to New Zealand population growth, again they shouldn’t be going anywhere near the PLT data, but turning to the rich data MBIE has, going back a large number of years now, on the total numbers and the various possible breakdowns (age, nationality, sex, occupation, approval stream etc). These are people who will, in most cases, be future New Zealanders. By comparison, PLT arrivals data will shed almost no useful light at all.
(Sometimes, of course, like all statistics, if they can’t be used for actual illumination the PLT numbers can still be (mis)used for support).
Because you can’t easily get it from MBIE, here is the table I ran last week on one breakdown of residence approvals for the year ending March 2017 (with thanks to the reader with MS Access who did generated them).
| Residence Approvals: Year ended 31 March 2017 | ||
| Application Substream | Application Criteria | Number approved |
| Skilled Migrant | Skilled Migrant | 25,357 |
| Work to Residence | Talent – Accredited Employer | 1,464 |
| Investor Category | Investor 2 Category | 1,404 |
| Entrepreneur Category | Entrepreneur category | 740 |
| Work to Residence | Long Term Skill Shortage List Occupation | 527 |
| Investor Category | Investor 1 Category | 154 |
| Partnership Deferral Skilled | Skills/Business deferral | 142 |
| Work to Residence | Religious Worker | 122 |
| Work to Residence | Talent – Sports | 27 |
| Employee of businesses | Employees of businesses | 3 |
| Business / Skilled | Sub-total | 29,940 |
| Refugee | 1,902 | |
| Samoa Quota | 1,008 | |
| Pacific Access | 607 | |
| Other | Ministerial direction | 295 |
| Other | Victims of Domestic Violence | 28 |
| Section 61 | Section 61 | 133 |
| International / Humanitarian | Sub-total | 3,973 |
| Family Tier 1 & 2 | Family Parent Tier 1 | 2,555 |
| Parent | Family parent | 457 |
| Sibling | Family sibling | 397 |
| Adult Child | Family child adult | 47 |
| Sibling | Family sibling | 2 |
| Parent Sibling Adult Child Stream | Sub-total | 3,458 |
| Partnership | Partnership | 9,439 |
| Dependant Child | Family child dependent | 1,861 |
| Partnership | Partnership – Partner of an Expatriate | 1,247 |
| Parent Retirement | Parent Retirement | 37 |
| Partnership Deferral Family | Partnership deferral | 23 |
| Dependant Child | Family Child dependent – Dependants of an Expatriate | 11 |
| Partnership | Partnership | 3 |
| Uncapped Family Sponsored Stream | Sub-total | 12,621 |
And here is my own (time-consuming) table of the top 10 countries for people getting granted Essential Skills work visas, updated to include the year to March 2017.
| Essential skills visas granted, by country | |||
| 2006/07 | 2015/16 | 12mths to Mar 17 | |
| Philippines | 1695 | 5,408 | 6174 |
| India | 1943 | 4,812 | 4904 |
| UK | 4692 | 3,686 | 4086 |
| Fiji | 2145 | 1,973 | 1756 |
| China | 2749 | 1,823 | 1801 |
| South Africa | 2003 | 1,382 | 1807 |
| Ireland | 481 | 969 | 824 |
| Brazil | 1376 | 923 | 1066 |
| South Korea | 1145 | 828 | 767 |
| United States | 1493 | 820 | 837 |
| Total all countries | 31015 | 31766 | 32775 |
You should really be able to get those, and so much more, readily from MBIE. Sadly, you can’t.
As a result, the debate – whichever angle you find yourself inclining towards – is poorer than it could, and should, be.
UPDATE: I can also recommend Alex Tarrant’s amusing piece on some of the data issues.

PLT counts international students and then double count international students when they convert to a working visa 3 years later on completion of their courses. Net PLT data is therefore exaggerated and likely wrong.
LikeLike
That isn’t generally true. You only get in the PLT if you leave after your study and then come back and somehow claim you (a) weren’t NZ resident for the last year or so, and (b) were now planning to be here more 12 months or more. Not saying it can’t happen, but it isn’t obvious why there is any more risk for students than for any other temp visa holder coming and going.
But, as I say, the MBIE approvals data is the best source and should be used a lot more than it is.
LikeLiked by 1 person
Michael, your statement can’t be correct. If you look at the arrival card, the information required is
What was the MAIN reason for your trip? business, education, other
Which country will you mostly live in for the next 12 months? New Zealand, other
If you are not staying permanently what is your MAIN reason for coming to New Zealand?
visiting friends/relatives, business holiday/vacation
conference/convention, education, other
Therefore the working visa arrival data comes from another source other than the arrivals card. There is therefore a high likelyhood of double counting.
LikeLike
I’d still be surprised if it accounted for much.
Take a foreigner arriving here on a 2 year study visa. They should fill in “2 years” when asked how long they plan to stay, and “education” as reason for visit.
Click to access passenger%20arrival%20card%20english%20language%20version.pdf
If they simply stay in NZ at the end of 2 years and never cross the border again, there is no risk of double-counting at all
But lets assume they take a 3 mth holiday back home (say India) before taking up a 2 year working visa job. When they leave NZ, they should fill in that they have been living in NZ for more than 12 months, and that the purpose of their visit home is visiting friends and relative (VFR).
Click to access nz-passenger-departure-card.pdf
On return to NZ after 3 months, they should fill in the arrival card as “living in NZ” and the purpose of their trip away would have been VFR. (so they won’t be counted as a PLT arrival, or here for “business”
Of course, there is always the non-trivial risk that people don’t fill out the cards correctly. And of course that is why I don’t have much confidence in the PLT numbers, for other than cyclical turning points, and encourage people to use the MBIE data.
In the MBIE data, the person will be counted once as a student visa, once as a working visa, and perhaps at a later date they might be counted again as granted a resident visa. Which is, of course, why those various classes of visa grants can’t simply be added together.
LikeLike
Your statement is again incorrect. When a student first arrives in NZ they will be counted as a PLT. As we all know there are 3 months in a year that student vacancies potentially arise in rental properties, it starts off usually in Nov up to the end Jan. This means that tens of thousands will leave each year for their 3 months holiday. This also means that a student that is usually here for the first year will not have been here for 12 months as a year starts from Feb and ends in Oct which is 9 months. They would indicate that they have not been in NZ for 12 months when they depart NZ for their holiday in year 1. When they return, they will be dounted again as PLT.
Most students will go home for holidays in Year 1 dues to homesickness. When they leave for holidays they will be counted as short term arrivals. The departure card questions are:
Are you, or until today were you, living, working, or studying in New Zealand for 12 months or more? No.
By answering No, the departure card questions cease.
They will be counted as short term arrivals departing. When they return they will again be counted as PLT.
Therefore students that leave in year 1 for holidays will be double counted.
Again the PLT is badly distorted.
LikeLike
Also there is nowhere on the arrival card that signals a person is on a working visa which means that 40,000 work visa arrivals over the last 12 months counted as PLT must have come from another source other than from the Arrival card which indicates a significant double count of international students when they convert to their work visa.
LikeLike
NZ statistics in 2012 counted Auckland population as 1.5 million we all celebrated. Census 2013 count was 1.42 million. In a period of 12 months we lost 80,000 people in Auckland. There is therefore a very high chance that there is a significant innaccuracy in the PLT count, likely in the international student space.
LikeLike
Confused. you are not alone.
By Alex Tarrant
The scene: Alex, a Member of Parliament who may or may not be in Government or Opposition, has called in Sandy, his political advisor, to discuss a key policy as the General Election approaches.
S: Morning Alex. You mentioned on the phone something about devising a new immigration policy?
A: Morning Sandy. Yeah, well this morning I was listening to my favourite talk-back radio programme and they were saying we let 72,000 people into this country last year, when there’s double that number of unemployed locals. That’s outrageous. We need to do something about it.
Much more and a fun read. at;
http://www.interest.co.nz/opinion/87394/episode-when-alex-and-his-political-advisor-sandy-try-dig-through-numbers-attempt-come
A: 72,000 physical people from overseas, coming to live here, when all these New Zealanders are on the dole!
S: Well if you’re going to be throwing numbers around like that, then actually 129,518 physical people arrived here to stay permanently or long term in the year to March.
A: What? That’s even more outrageous! Where’s that figure from? Why aren’t we talking about that number?
LikeLike
The actual residency migrant count in the 129k is only a tiny 17k gross.
LikeLike
38k are returning kiwis.
6k are long stay tourists
24k are international student arrivals.
LikeLike
What would I say as a businessman looking at the numbers above
29,940 skilled immigrants are undoubtedly adding value! Our economy could not function without them.
The Rest, adding to 29,000 approximately,
Draw your own conclusions, (refugees, dependants, pacific islanders) My opinion would be possibly they are a net drag on the economy.
An obvious solution presents itself.
As for Alex Tarrant satire via Viking there are 139,000 officially unemployed, thus 29,940 skilled immigrants represents, 21.5% of that figure, or 5 years worth of skilled immigration to replace what is arguably the bottom of the barrel. The bottom of the barrel has been reasonably stable over recent years so hence my claim we are at the bottom of the barrel.
Hence another obvious solution presents itself.
QED immigration problem solved, skilled workforce problem solved. Debate finished!
LikeLike
Ross, this, what you call “the bottom of the barrel” (why would you use an offensive term like that) or what is more correctly called the long term unemployed only represent about 12% of the total or some 15,000 individuals. I think we have that covered already with hundreds of thousands of immigrants in the past few years, don’t you. The other 88% have been in recent employment (within 12 months) and all unemployed are (supposed to be) actively looking for work.
All of the countries we take immigrants from have unemployed and underemployed people, almost without exception at higher levels than we do so I guess you could say we’re helping them with their problem. Perhaps we should be taking care of our own issues first. I really think we should be having a good hard look at where we are going with the immigration and unemployment dynamic. It is not all about what businesses say they want either.
LikeLike
When chefs top the list of the skilled migrant category, it is clear that the $20 billion dollar tourist and international students need to eat foreign food. Unfortunately you can’t train locals brought up on hangi and MacDonalds to be able to cook foreign food. Therefore there no choice but to bring in foreign chefs.
LikeLike
You also have to add foreign speaking waiters, foreign front end reception to the skilled migrant list as you can’t train locals to speak a foreign language. Service is about being able to speak to the customers and understand their needs. No point fronting up with a local that can’t cook or speak to customers, you might as well shut the hotel down and put up signs that says. No foreign tourists, we only serve locals because our staff can’t understand what you are saying.
LikeLike
(This comment is from reader Michelle, who had trouble loading a comment)
Ross, I wonder if you should actually spell out your ‘obvious solution’ regarding the so called net drag on the economy by refugees, dependents, Pacific families. I am no economist! (Michael will attest to that) but I read this blog to engage with different opinions to my own. I am saddened that you point the finger on the basis of personal bias. Had you considered the net drag of economic crime? http://www.radionz.co.nz/news/national/257185/economic-crime-costs-up-to-$9-point-4bn
LikeLike
Chefs – Questions that have been asked before with no answers
Why do we need so many of them – do the chefs imported in prior years leave? – where do they go – why isn’t there any spillover from imported skilled chefs to train locals
Now – from the horses mouth – the contradiction – Cassia wants to bring in trainee chefs
Cassia – Auckland’s best restaurant for modern Indian restaurant. Chand Sahrawat used her restaurant’s win to speak up about the Government’s proposed immigration changes, saying it was denying skilled people the chance to live in New Zealand. Junior chefs deserved the chance to make their way up in the profession and restrictions on immigration would stop that, she said.
LikeLike
There are no answers Iconclast, the so called skilled chef migrant category is a colossal scam intended to deceive our naive and gullible immigration service. No one knows what these characters are up to; no follow up is done, the skills/qualifications are fabricated and the rort continues. Apparently we now need to bring in waiters and waitresses, it’s absurd, most of our tourists are from English speaking countries and most of the rest have enough English to get by.
When tourists travel they prefer to sample local cuisine; some NZ oysters or scampi perhaps. Catering to tourists? yeah right!
LikeLike
Unfortunately the reality is quite different from your perception.
Time and time again when I work with retail stores, foreigners gravitate towards sales staff that can speak their language. Even if an NZ born asian is not a foreign language speaker, I have been informed that asian tourists will still gravitate towards asian looking sales staff.
The largest number of tourists is Australia, part of Oceania and increasingly it is the Asian migrants in Australia that are coming across to NZ for holidays.
Tourists
12 months to March 2017
Oceania 1,568,688
Asia 923,056
Europe 537,600
Americas 426,384
Africa Mid East 48,576
Not stated 29,424
Total 3,543,631
http://www.stats.govt.nz/browse_for_stats/population/Migration/IntTravelAndMigration_HOTPMar17.aspx
If you follow a group of tourists from asia in the North island holiday. It is typically 3 days in Auckland, visit all the free tourist attractions, then eating in Chinese restaurants and go to souvenier shops, 2 days in Rotorua 1 day trying out the local hangi and the 2nd day in a Chinese Restaurant and go souvenier shops, check out taupo lakes for 2 days have a BBQ sausages, lamb and beef steaks on day 1, then go to the nearest chinese restaurant on day 2 and souvenier shops, then back to Auckland and go to a chinese restaurant, goto the souvenier shops and then on a flight back to Asia.
LikeLike
OK. 10 of the 17 comments on this post are from you. That is probably about enough for now – especially when the post itself wasn’t even very contentious.
LikeLike
In response to Michelle’s question I would reply as follows: Most of the post(ers) here are anti immigration and cite the net immigration figure of 72,000 as an evil.. Michael has provided a breakdown of the numbers on immigration which is great because he makes it easier to have an intelligent discussion about the issues if you have the facts. My “obvious solution” was tongue in cheek attempt at satire. Readers of this blog want to cut immigration then here are some stark choices, one measure is usefulness as measured by skill..
Re crime I think it would a great future post from Michael with appropriate breakdown of the numbers by race and class would be the place to start.
My perception of, crime ,(like health, and like education), is that most of the drag is coming by race, Maori and Pacific Island. The later group came here by poor immigration choices in the past of letting “no skills” into the country based on a social conscience approach.
This supports my argument above that choices should be made on skill.
Hope this answers the question.
Cheers
Ross
LikeLike
I think quantum theory has issues with the observer changing the data. It is certainly true with ethnicity perceptions. There was a study in the USA where black students about to sit a maths exam were split into two groups and each received a 20 minute lecture: (a) were told about great black achievements (b) were told the failure rates by race and how blacks on average did badly. The result being group (a) did markedly better in their maths exam. The only logical deduction being that they were less likely to give up when the maths questions were difficult.
This concept is public knowledge. My local chimney sweep is 1/16th Maori and he knows his iwi etc but avoids any mention of Maori in front of his daughter because he is concerned that she would use it as an excuse to stop making an effort at school. My son had a friend whose Maori mother was a senior social work manager in South Auckland – she deliberately lived in affluent North Shore with her PI husband so their children were not influenced by the South Auckland Maori/PI culture (BTW the family moved to Australia).
I agree with you that class is critical. Take our shameful system of encouraging poor Indians to study crap courses in NZ with the carrot of residency hung in front of them. Replace each one with an Indian with a Phd from a top university and I could accept that. At present they end up in Oxfors, Yale, Harvard and the technology belt in San Jose.
BTW (in other words irrelevant to the article) almost every radio interview about immigration has the question “but if you stop skilled immigration / work visas where would we find IT staff?”. IT was my skill when I arrived a dozen years ago so can I answer it: “just the same way other countries do: training. IT is not some mythical rare accomplishment like having perfect pitch”.
LikeLike